Experimental Study of Flow in a Plenum Chamber of a Swirling Fluid Bed
Safiah Othman1,*, Normayati Nordin1, Abas A. Wahab1, Vijay R. Raghavan2
1
Universiti Tun Hussein Onn Malaysia, 86400 Parit Raja, Johor. 2
Universiti Teknologi Petronas, 31750 Tronoh, Perak.
*E-mail: [email protected]
Abstract:
In the present study an experimental system is constructed for verification of the numerical approach used in designing the plenum chamber of a swirling fluidized bed. The airflow entering the plenum chamber is measured by a pitot static probe inserted into the inlet pipe of the chamber. Static pressure tapings are provided at two planes on the plenum chamber in order to obtain the pressure drop across it. Particle Image Velocimetry (PIV) is used to visualize the flow and provide 2D quantitative information about the velocity field. From the resulting outputs, the pressure drop across the plenum without a cylindrical hub implanted at the centre was found to be higher than with it. Although the existence of hub increases the viscous friction due to more area in contact with fluid, the more pronounced form drag caused by the abrupt flow expansion in the empty bed is greatly reduced in the column with hub. Furthermore, elimination of losses near a wide region at the column center give the latter set up an advantage with respect to pressure loss. As a result, less pressure drop across the chamber with a hub incorporated is of evident. Also obtained are the 2-D airflow vectors in the plenum chamber as captured using PIV apparatus. The flow vectors are essential in understanding the general aerodynamics in the test unit. In addition, computational software could provide the velocity magnitudes of the flow. These data are essential to validate the numerical codes.
Keywords: Experimental study, plenum chamber, swirling fluidized bed, validation, PIV
1. Introduction
The flow in the plenum chamber of the swirling fluidized bed is more complex and different from the situations studied earlier [1,2]. Intensive literature review has been carried out [3-5], and to the best knowledge of the author, no work has been done hitherto specifically on this case. Therefore the objective of this study is to experimentally investigate the flow structure in the plenum chamber. The following studies will then been conducted at the aim to determine the influence of various inlet types and hub designs as well as the introduction of multiple inlets on the aerodynamic behavior in the plenum chamber of a swirling fluidized bed. It is expected to lead to optimum performance characteristics of the swirling
fluidized bed, which are uniform and high heat and mass transfer between gas and liquid.
2. Methodology
The experimental system was constructed for the purpose of verification of the numerical approach to be used in designing the plenum chamber. The experimental results obtained could be compared to the simulation data in order to choose a numerical methodology that provides results with the least deviation.
5 mm in vertical direction. Ambient air is directed from a blower into the column via a piping system. A flexible hose was used to transport air from the blower outlet into a long straight pipe section. A pipe reducer was needed to joint these hoses of different diameters. The flexible hose was chosen due to its ability to tolerate misalignment as well as its capability to absorb vibration from the blower. Its function as a damper is significant to protect the perspex column and to reduce disturbance during the measurement. The straight pipe is of 1.6 m in length, which is longer than 15 times its diameter (0.1 m) to provide fully developed flow at the plenum entrance [6]. In addition, a relatively fine screen was placed upstream of the pipe in order to homogenize the generated turbulent air stream.
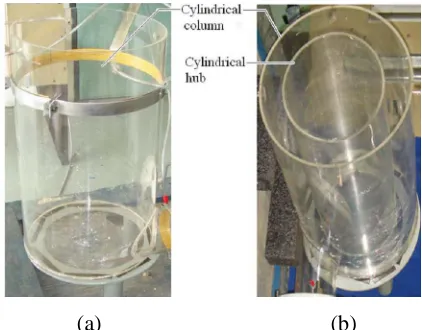
A 20 cm perspex flow modifying center-body (hub) of 50 cm height could be implanted at the center of the chamber (as shown in figure 1b), so that the experiment might be conducted with or without it. In this case, the airflow is restricted within an annulus path between the two cylinders.
[image:2.612.91.302.429.594.2](a) (b)
Fig. 1: The plenum chamber; a) empty column; (b) cylindrical hub implanted
The centrifugal blower rotates at approximately 2870 revolution per minutes (50 Hz) when 3.5 kW power is supplied. Airflow into the studied system is controlled at the desired rate by means of the blower inlet damper. The friction caused by rotating
components resulting in the increment of air temperature. Measuring the actual temperature of air is essential in obtaining good analysis data. Therefore a thermometer is available to determine the temperature of air leaving the blower.
2.1 Instrumentations
The airflow entering the plenum chamber was measured by a pitot static probe inserted into the inlet pipe of the chamber. It measures both static and stagnation pressure on the inlet plane, thus permits determination of the inlet flow velocity by equation 1 [7].
Bernoulli’s equation for air reduces to:
2
0 v
2 1 p
p (1)
A digital manometer of resolution 1 Pa measured the pressure differential across the pitot static probe. Computational software was used to record the measured data and calculate the statistical parameters.
From measurements of the air velocity at different radial positions inside the pipe, the flow regime was found to be turbulent for all tested velocity conditions. With the assumption of a fully developed flow, only the air velocity at the central axis, vc, was
recorded and the mean velocity inside the pipe, v, was derived using the Prandtl one-seventh power law, shown in equation 3.2 with n equal to 7 [8].
1
2 1
2 2 n n n v v c (2)
From equation 1,
) (
2 0
p p
vc (3)
Density of air depends on its temperature as determined by the thermometer as it leaves the blower.
Therefore the air density, 3 5 / 1172 . 1 ) 316 ( ) 287 ( 10 0132 . 1 m kg RT p
Static pressure tappings were provided at two planes on the plenum chamber in order to obtain the pressure drop (∆p) across it. One plane is 5 cm below the plenum outlet plane while the other is on its inlet pipe (15 cm away from the column). Four tapings were made on the upper plane and two on the inlet pipe. Multi tapings enable the average of static pressures on different peripheral positions to be determined.
2.1.1 Particle Image Velocimetry (PIV) Particle Image Velocimetry (PIV) was used to visualize the flow and provide quantitative information about the velocity field on several horizontal and vertical planes in the plenum chamber [9,10]. This is a technique whereby the velocity field may be inferred from the motion of tracer particles in the fluid. The density of the particles must be well matched to the density of fluid to avoid errors due to the influence of gravitational forces. In these experiments, smoke of density 1.12 kg/m3 (Aerotech SG 590) was injected into the airstream, through the gap near the blower inlet damper, into the airstream to follow streamlines. A Solo Nd:YAG laser was used to illuminate the particle suspension in the plenum chamber both vertically and horizontally. The Nd:YAG laser emit infra-red radiation the frequency of which can be doubled to 532 nm – a green wavelength. Dantec Dynamic 80C60 HiSense CCD Camera of 768×576 pixels resolution connected to a frame grabber card in a PC views the apparatus through the window at right angles to the illuminated plane. FlowManager software was used to operate the frame grabber. During the data acquisition, the PC records a sequence of images of the tracer particles. The image resolution is of 5 ps. Each image is subsequently divided into interrogation windows of 64 × 64 pixels. The velocity of
the flow in each window is calculated using cross-correlations between corresponding windows in successive images.
Using this technique, it is assumed that the tracer particles follow the motion of the fluid exactly; hence the displacement of the particle assembly matches the fluid displacement. The property actually measured is the distance travelled by particles in the flow within 10 ms of time interval between successive images. This corresponds to the time delay between two laser pulses. Consequently, the instantaneous whole field velocities can be calculated as below:
time ce tan dis
speed (4)
3. Results and discussions
A preliminary testing on various blower inlet damper settings on the airflow rates supplied was performed. An opening has then been preferred as it provides airflow rate in the range expected. Similar setting however, supplied different airflow rate into the plenum chamber for experimental set-up with and without a cylindrical hub implanted at the center of the column.
[image:3.612.320.545.524.605.2]Measuring the pressure differentials across the pitot static probe, p0 - p∞, and substituting their average as calculated by the computational software into equations 2 and 3 gave results as presented in table 1.
Table 1: Experimental results
Plenum chamber p0 - p∞
[Pa] vc [m/s] v [m/s]
Empty plenum 127 15.06 12.3
Cylindrical hub 137 15.67 12.8
Table 2 presents the pressure drop ∆p
Table 2: Pressure drop across the plenum
Plenum chamber ∆p [Pa]
Empty plenum 19
Cylindrical hub 16
The pressure drop across the plenum without a cylindrical hub implanted at the centre was found to be higher than with it. Although the existence of hub increases the viscous friction due to more area in contact with fluid, the more pronounced form drag caused by the abrupt flow expansion in the empty bed is greatly reduced in the column with hub. Furthermore, elimination of losses near a wide region at the column center give the latter set up an advantage with respect to pressure loss. As a result, less pressure drop across the chamber with a hub incorporated is of evident.
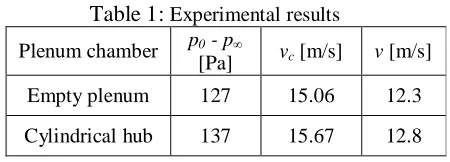
The following are the 2-D airflow vector in the plenum chamber as captured using PIV apparatus. The flow vectors are essential in understanding the general aerodynamics in the test unit. In addition, computational software could calculate the velocity of the flow represented by each arrow as. A set of two velocity components could be acquired from each vector diagram. Figures 2 (a to c) are the 2D velocity vectors on the plenum horizontal plane at three different heights labeled as top, mid and bottom in figure. Figures 4 (a and b) consequently, are the velocity vectors on two orthogonal vertical planes intersecting the column central axis as demonstrated in figure 5. The planes are labeled as plane 1 and plane 2.
(a)
(b)
[image:4.612.106.289.82.166.2](c)
Fig. 2: Velocity vector (scale; 1mm : 1 m/s) on three horizontal planes for empty plenum;
Fig. 3: Three plenum heights (mm) labelled as top, mid and bottom
The velocity vectors above show that the swirling flow dominated a major portion of the chamber except near the centre of the column, where the axial velocity turned out to be the most significant component. On the bottom plane, the dominant inlet velocity near the column entry is as expected. On the top and mid plane however, it is interesting to note that highest velocity magnitude occurred near the end opposite to the air entrance into the column. This could be physically
explained by air being forced to flow upward in a swirling motion, toward the only exit.
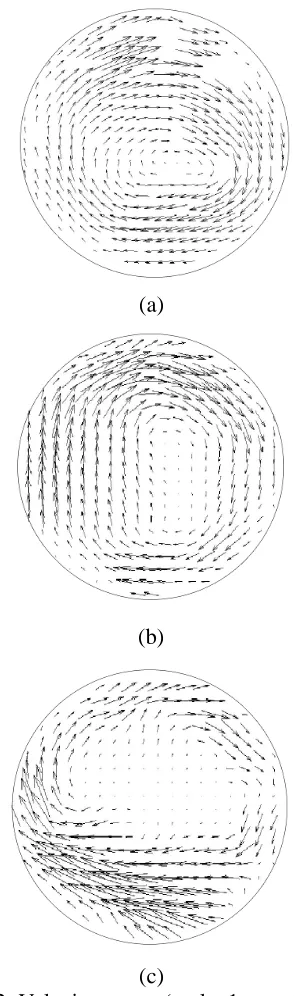
The significance of axial velocity component near the centre of the column is enhanced by the vertical flow visualizations in figures 4 (a and b). In addition, it verifies that reversed flow do take place in the centre region, however in the direction shifted to one of the wall sides. This explains the existence of the other two velocity components in this region.
The reversed airflow near the plenum center is due to its negative pressure region. To understand this, one has to imagine a whirlpool in a river. Low local static pressure near the center is due to its high peripheral velocities. Therefore it causes air to flow downwards at the center.
Spurious vectors and missing vectors are as expected from this technique; occur for a variety of reasons. These may be associated with the optical conditions, for example, reflection of a light source from a glass surface. In fact, the light deflection on the wall of the plenum contributes to worse
quality of vertical images (figures 4 and 9) compared to the horizontals (figures 2 and 8). Non homogeneity of the tracer particles will also cause erroneous results. Motion of trace particles into or out of the illuminated plane may cause problems.
Similar patterns are again verified by the velocity vectors for plenum chamber with a cylindrical hub implanted at the center (figures 8 and 9).
(a)
(b)
Fig.4: Velocity vector (scale; 1mm : 1 m/s) on two orthogonal vertical planes for empty
[image:5.612.360.491.223.674.2]Fig.5: Two orthogonal vertical planes crossing the column central axis, labelled as
[image:6.612.115.273.90.241.2]plane 1 and plane 2
Fig.8: Velocity vector (scale; 1mm : 1 m/s) on the top plane for plenum chamber with a hub
(a)
(b)
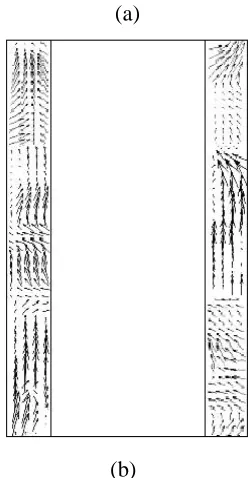
Fig. 9: Velocity vector (scale; 1mm : 1 m/s) on two orthogonal vertical planes for plenum
with a hub; (a) plane 1; (b) plane 2
4. Conclusions
References
[1] Merry, J.M.D. (1971). “Penetration of a horizontal gas jet into a fluidised bed.” Trans. Inst. Chem. Eng. 49. 189.
[2] Ouyang, F. and Levenspiel, O. (1986). “Spiral distributor for fluidized beds.” Ind. Eng. Chem. Process Des. Dev. 25. 504. [3] Shu, J., Lakshmanan, V.I. and Dodson C.E. (2000). “Hydrodynamic study of a toroidal fluidized bed reactor.” Chem. Eng. and Processing 39. 499 – 506.
[4] Rubin, F.L. (1960). “Design of air-cooled heat exchangers.” Chemical Engineering 68. 91 – 96.
[5] Depypere, F., Pieters, J.G. and
Dewettinck, K. (2004). “CFD analysis of air
distribution in fluidised bed equipment.” Powder Technology 145. 176 – 189.
[6] Sherman, F. (1990). “Viscous flow.” New York: McGraw-Hill.
[7] Holman, J.P. (2001). “Experimental
methods for engineers.” 7th. Ed. Boston:
McGraw-Hill.
[8] Fox, R.W. and McDonald, A.T. (1994).
“Introduction to fluid mechanics.” New York: Wiley.
[9] (2002). “Flow manager software and introduction to PIV instrumentation.” Denmark: Dantec Dynamics.