A thesis submitted to the Graduate School of Engineering of
Nagaoka University of Technology in partial fulfillment of the requirements for the degree of
Doctor of Engineering
by
Jais Bin Lias 06539591
Academic adviser
Associate Prof. Dr. Munehiro Kimura
Department of Electrical Engineering Nagaoka University of Technology
Abstract
Photoalignment technique in liquid crystal devices (LCDs) fabrication processes is classified into a non-contact process which provides an anisotropy in liquid crystal (LC) alignment layer by exposing ultra violet (UV) light. The greatest benefit for using this technique is to avoid electrostatic charges and impurities on the substrate. Moreover, photoalignment can realize the structures which has the required liquid crystal director azimuth with the selected area of the cell, thus viewing angle characteristics can be improved by the pixel dividing. In this study, the photoalignment technique was applied to the fabrication of a bistable type LCD and polymer-stabilized blue phase (PSBP) LCD.
Recently, blue phase (BP) liquid crystal (LC) has attracted the attention of many researchers because of its exotic structures and properties. BP with a structure of self-assembled three-dimensional cubic structure formed by double-twisted arranged LC cylinders is usually observed in a cooling process from isotropic to chiral nematic (N*) phase LC. Such a molecular arrangement exhibits an optical isotropy, selective reflection to circular polarized light, a reflective band switched by external fields, and microsecond response. These characteristics show some potential applications of BP such as large-screen flat panel displays and tuneable photonic band gap devices. The very narrow stable temperature range of the BP, however, typically a few Kelvin, is a serious problem for device applications. Although, much effort has been made to expand the narrow temperature range of the BP, Kikuchi et al. firstly reported that the temperature range of the BP can be expanded over 60 °C by adding a small quantity of precursor polymers within the BP materials, referred to as a polymer-stabilized blue phase (PSBP).
Table of Contents
Chapter 1 1
Introduction 1
1.1. History of Liquid Crystals 1
1.2. Research Background 3
1.3. Objectives of the Investigation 5
1.4. Outline of This Thesis 6
Chapter 2 8
Physical Properties of Liquid Crystals 8
2.1. Introduction 8
2.2. Thermotropic, Polymeric and Lyotropic Liquid Crystals 9
2.2.1. Thermotropic Liquid Crystal 9
2.2.1.1. Nematic and Cholesteric Phases 10
2.2.1.2. Smetic A and Smetic C Phases 12
2.2.2. Polymer Liquid Crystal 12
2.3. Properties of Liquid Crystals 13
2.3.1. Dielectric Constant 13
2.3.2. Refractive Index 14
2.3.3. Elastic Constants 14
2.3.4. Viscosity 16
Chapter 3 19
Optics of Liquid Crystals 19
3.1. Introduction 19
3.2. Light propagation in an Isotropic Medium 19
3.3. Light propagation in an Anisotropic Medium 22
3.4. Jones Matrix 26
3.5. 4×4 Matrix Method 29
Chapter 4 40
Bistable Liquid Crystal Technologies 40
4.1. Introduction 40
4.2. Principles of Operation, Advantages and Limitations 40
4.2.1. Bistable Cholesteric Display 40
4.2.2. Surface Stabilized Ferroelectric Liquid Crystal (SSFLC) Display 41
4.2.3. Bulk Bistable Twisted Nematic (360° BTN) Display 42
4.2.4. Surface Nematic Bistability 43
4.2.4.1. Zenithal Bistable Display (ZBD) 44
4.2.4.2. Surface Controlled Bistable Nematic (BiNem) Display 45
4.3. Present State and Expected Future of the Bistable LC Technologies 46
Chapter 5 49
Liquid Crystalline Blue Phases 49
Chapter 6 58
Investigation of Liquid Crystal Alignment on Patterned-Alignment Films Processed by UV Light 58
6.1. Introduction 58
6.2. Liquid Crystals Alignment Method 60
6.2.1. Rubbing Method 60
6.2.1.1. Definition 60
6.2.2. Photoalignment Method 62
6.3. Bistable Switching Models 63
6.4. Experiment 64
6.4.1. Orientation Confirmation of the Twisted-Homogeneous Bistable and Bistable HAN Cells 65
6.4.2. Measurement of the Twisted Angle of the Twisted-Homogeneous Bistable Cell 66
6.4.3. Measurement of the Pretilt Angle of the Twisted-Homogeneous Bistable Cells 67
6.4.4. Switching Experiment of the Twisted-Homogeneous Bistable Cell 68
6.5.1. Orientation Confirmation of the Twisted-Homogeneous Bistable
and Bistable HAN Cells 68
6.5.2. Measurement of the Twisted Angle of the Twisted-Homogeneous Bistable Cell 70
6.5.3. Measurement of the Pretilt Angle of the Twisted-Homogeneous Bistable Cell 71
6.5.4. Switching Experiment of the Twisted-Homogeneous Bistable Cell 72
6.5.5. Effect of the Pattern Pitch 74
6.6. Conclusion 75
Chapter 7 78
Determination of Polar Anchoring Strength for Polymer-Stabilized Blue Phase Liquid Crystal Devices Processed by UV Light - SOITE Method 78
7.1. Introduction 78
7.2. Experimental Methods 79
7.2.1. Observation of Polymer-Stabilized Blue Phase 79
7.2.2. Measurement of Polar Anchoring Energy Coefficient Aθ by SOITE Method 80
7.3. Result and Discussion 83
7.3.1. Observation of Polymer-Stabilized Blue Phase 83
7.3.2. Measurement of Polar Anchoring Energy Coefficient Aθ by SOITE Method 84
7.4. Conclusion 87
Chapter 8 89
Determination of Polar Anchoring Strength for Polymer-Stabilized Blue Phase Liquid Crystal Devices Processed by UV Light – Hung’s Method 89
8.1. Introduction 89
8.2. Experimental Methods 90
8.2.1. Observation of Polymer-Stabilized Blue Phase 90
K11 and Bend Elastic Constants, K33 93
8.3. Result and Discussion 99
8.4. Conclusion 103
Chapter 9 106
Conclusions 106
Publication and Research Activities 108
List of Figures
Figure 2.1. Molecular structure of solid, liquid crystal and liquid 8
Figure 2.2. Molecular structure of 5CB (4-n-pentyl-4-cyanobiphenly). 9
Figure 2.3. Status change of a thermotropic liquid crystals. 9
Figure 2.4. Molecular order in a nematic liquid crystal. 10
Figure 2.5. The arrangement of molecules in the cholesteric mesophase. 11
Figure 2.6.The arrangement of molecules in the Smetic A and Smetic C phases 12
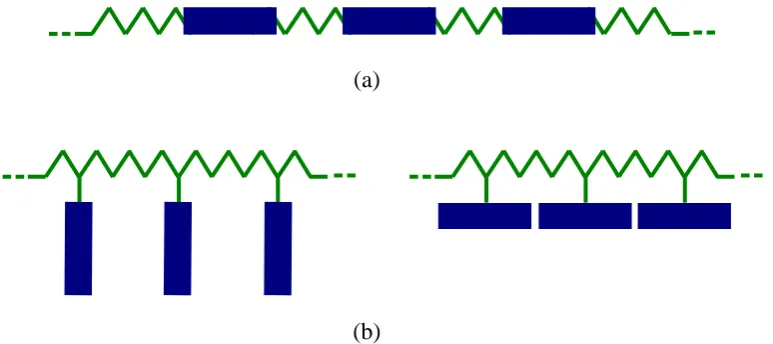
Figure 2.7. Polymeric liquid crystals: (a) main chain; (b) side chain. 13
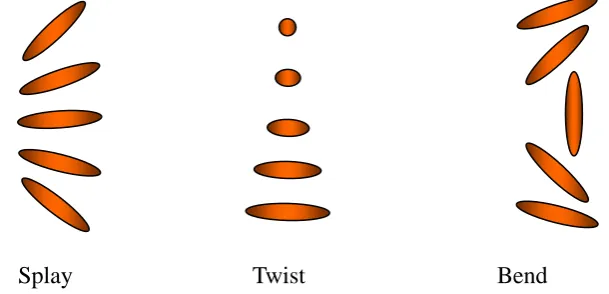
Figure 2.8. The three basic types of deformation in the liquid crystals 14
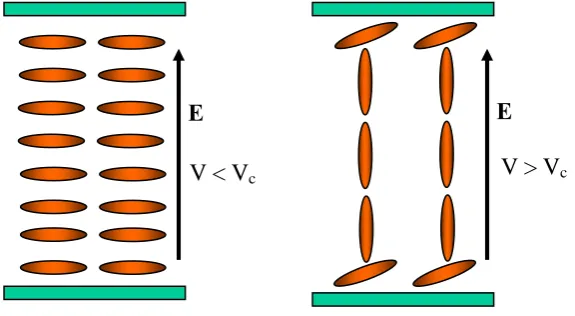
Figure 2.9. The Freedericksz-transition. Left: the condition when the applied voltage is below the threshold value; right: the condition when the applied voltage is above the threshold. 15
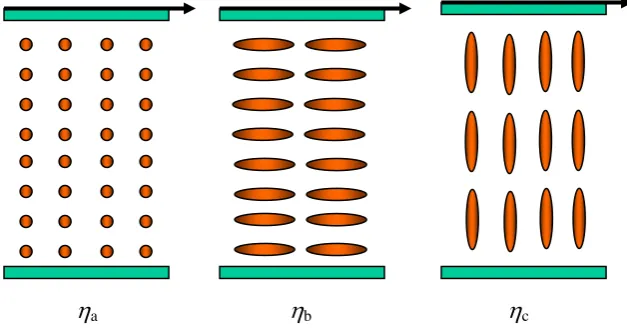
Figure 2.10. The force necessary to slide the top plate over the bottom plate with the liquid crystal in between depends on the orientation of the liquid crystal molecules. As a consequence, liquid crystals possess more than one viscosity constant 16
Figure 3.1. Light transmission from an isotropic to anisotropic medium. 30
Figure 3.2. Light transmission and reflection by an anisotropic plate sandwiched between isotropic media. 35
Figure 4.1. Textures realized in the bistable cholesteric display 41
Figure 4.2. Bistable textures of the SSFLC display 42
Figure 4.3. Textures and transitions in the Berreman’s bistable twisted nematic 43
Figure 4.4. Flexoelectrically controlled nematic device using surface bistable states 43
Figure 4.5. Bistable surface anchoring in the ZBD device. (a) High tilt defect-free state; (b) Low tilt state (the pair of defects is located in the gray regions) 44 Figure 4.6. Textures and transitions in the BiNem device 45 Figure 5.1. Structure of blue phases {as schematically illustrated in ref. [11a]}.
Singularities of the director field (disclinations) appear since the double twist cylinders cannot fill the space of the unit cell continuously. At positions in the vicinity of the disclination lines, the orientational order parameter disappears (as in the isotropic phase). Thus, blue phases are stable in the temperature range close
to the isotropic liquid state. 49
Figure 5.2. a) BP single crystal in a polarizing microscope. b) Kossel diagram (diffraction pattern of a single crystal illuminated by convergent monochromatic light). c) Prof. Dr. Walter Kossel (1888–1956), who studied the diffraction of X-rays on single crystals when the X-ray source is inside the crystal [8].d) Electro- optical test cell showing the electric-field-induced shift of the Bragg wavelength for a BP system with negative dielectric anisotropy.[10]. 51
Figure 5.3. Compounds used in ref. [1] . 1: Nematic bimesogens (n=7, 9, and 11). 2: Chiral dopant (R corresponds to mesogenic moieties not being specified in ref. [1]). 52
Figure 6.1. Rubbing of the polyimide layer. 60
Figure 6.2. The definition of parameters associated with rubbing. 61
Figure 6.3. Different pretilt angle generation in photoalignment method 62
Figure 6.4. (a) Schematic diagram of the stripe patterns with alternating random-planar- and homeotropic-alignment potentials. (b) Director configuration of the YZ and X states. 63
Figure 6.5. Two types of configurations of bistable LC cells: (a) twisted- homogeneous bistable mode; and (b) bistable hybrid mode. 64
Figure 6.6. (a) Experimental setup for periodic stripe pattern formation using unpolarized UV light. (b) Schematic illustration of the textured stripe patterns with alternating random-planar- and homeotropic- alignment states after unpolarized UV light exposure. 65
Figure 6.7. (a) Optical arrangement and coordinate system of the extinction angle method. (b) Polarized light axis related to the director in the extinction angle method. 67
Figure 6.8. Optical system of the transmission ellipsometer. 67
Figure 6.9. Polarized microphotographs of the twisted-homogeneous bistable cell using different LCs: (a) MBBA without electric-field application; (b) MBBA with electric-field application; (c) 5CB without electric-field application; and (d) ZLI-2293 without electric-field application. 69 Figure 6.10. Polarized microphotographs of the bistable HAN cell using different
field application; and (c) ZLI-2293 without electric-field application. 70
Figure 6.11. Δ & Ψ on 0 deg incident. 71
Figure 6.12. Δ & Ψ on 30 deg incident. 72
Figure 6.13. Switching behavior of the twisted-homogeneous bistable cell. 73
Figure 6.14. 40 μm pitch LC cell 74
Figure 6.15 4 μm pitch LC cell 74
Figure 6.16. 1 μm pitch LC cell 74
Figure 7.1. Schematic of SOITE method. 80
Figure 7.2. The cross section of the model of LC cell used to measure the surface polar anchoring energy coefficient. 83
Figure 7.3. Typical POM textures of blue phases observed on cooling (1 ◦C/min): BP I. 84
Figure 7.4. Optical system of transmission ellipsometer. 84
Figure 7.5. Digital camera image of the LC cell under voltage application. 85
Figure 7.6. Δ+ andΔ−under applied voltage. 86
+ Figure 7.7. Δ − Δ− under applied voltage. 86
Figure 8.1. Geometry of an HAN cell. 93
Figure 8.2. Schematic diagram of light passing through an HAN cell for the oblique incidence. The xz plane is assumed to be the plane of incidence. 95
Figure 8.3. The cross section of the model of LC cell used to measure the surface polar anchoring strength. 97
Figure 8.4. AFM image of bar coated substrate – 2D. 98
Figure 8.5. AFM image of bar coated substrate – 3D. 98
Figure 8.6. Typical POM textures of blue phases observed on cooling (1 ◦C/min): (a) BP II, (b) BP I, and (c) N*. 99
Figure 8.7. Refractive indices of 5CB + JC-1041XX. 100
Figure 8.8. Relationship of capacitance versus applied voltage. 101
Figure 8.9. Theoretical and experimental results of R versus λ for β = °0 . 102
List of Tables
Table 4.1. Comparison of the performances of the main liquid crystal
technologies 47
Table 6.1. Twist angle measurement results 71
Table 6.2. Elastic constant K ratio of the LC materials 71
Table 7.1. Composition of LC mixture. 79
Table 7.2. Composition of samples used in the alignment film (Mixture 1). 79
Table 7.3. The properties of ZLI-4792. 83
Table 7.4. The experimental result. 87
Table 8.1. Composition of LC mixture. 91
Table 8.2. Composition of samples used in the alignment film (Mixture 2). 91
Table 8.3. Measurement values of refractive indices of 5CB +JC-1041XX obtained by using Abbe refractometer. 100
Table 8.4. The simulated results of initial values of Cauchy coefficients of anisotropic refractive indices. 100
Chapter 1
Introduction
1.1.
History of Liquid Crystals
Between 1850 and 1888, researchers in different fields such as chemistry, biology, medicine and physics found that several materials behaved strangely at temperatures near their melting points. It was observed that the optical properties of these materials changed discontinously 1qawith increasing temperatures. W. Heintz, for example, reported in 1850 that stearin melted from a solid to a cloudy liquid at 52°C, changed at 58°C to an opaque and at 62.5°C to a clear liquid. He and a colleague, at one point referred to the change at 62.5°C as a second melting point.
An important invention of the time was the heating stage microscope by Otto Lehmann, a physicist from Karlsruhe, Germany [1]. This microscope allowed control of the temperature of the sample. In a later version, with polarizers added, it became the standard equipment in every liquid crystal research laboratory.
In 1888, an Austrian botanist named Friedrich Reinitzer, interested in the biological function of cholesterol in plants, was looking at the melting behaviour of an organic substance related to cholesterol [2]. (The chemical structure of cholesterol was still unknown. Today we know that the observed substance was cholesteryl benzoate). He observed, as W. Heintz did with stearin 38 years before, that the substance melted to a cloudy liquid at 145.5°C and became a clear liquid at 178.5°C. He also described some of the same color phenomena that had been reported by earlier scientist working with cholesterol derivatives: a blue color briefly appears upon cooling when the clear liquid turns cloudy, and a blue-violet color occurs just before the cloudy liquid crystallizes.
convinced that the cloudy liquid was a uniform fluid phase, but one that effected polarized light in a manner typical of solid crystals, not liquids. This combination of characteristics – flow properties like liquid and optical properties like a solid – finally led Lehmann to label these substances “liquid crystals”.
Research in the area of liquid crystals burgeoned in the years after 1888. Some of the more important results are listed below:
• 1922: George Friedel describes the structure and properties of liquid crystals and
classified them in 3 types (nematics, smectics and cholesterics) [3].
• 1962: The first major English language publication on the subject "Molecular
Structure and Properties of Liquid Crystals", by Dr. George W. Gray [4].
• 1962: Richard Williams of RCA found that liquid crystals had some interesting
electro-optic characteristics and he realized an electro-optical effect by generating stripe-patterns in a thin layer of liquid crystal material by the application of a voltage. This effect is based on an electro-hydrodynamic instability forming what is now called “Williams domains” inside the liquid crystal [5].
• 1964: George H. Heilmeier, then working in the RCA laboratories on the effect
discovered by Williams realized the switching of colors by field-induced realignment of dichroic dyes in a homeotropically oriented liquid crystal. Practical problems with this new electro-optical effect made Heilmeier to continue work on scattering effects in liquid crystals and finally the realization of th,e first operational liquid crystal display based on what he called the dynamic scattering mode (DSM) [6][7][8].
• 1960s: Pioneering work on liquid crystals was undertaken in the late 1960s by
the UK's Royal Radar Establishment at Malvern. The team at RRE supported ongoing work by George Gray and his team at the University of Hull who ultimately discovered the cyanobiphenyl liquid crystals (which had correct stability and temperature properties for application in LCDs).
• 1970: The twisted nematic field effect in liquid crystals was filed for patent by
• 1971: The company of Fergason ILIXCO (now LXD Incorporated) produced the
first LCDs based on the TN-effect, which soon superseded the poor-quality DSM types due to improvements of lower operating voltages and lower power consumption.
• 1972: The first active-matrix liquid crystal display panel was produced in the
United States by T. Peter Brody [9].
• 1991: A French theoretical physicist, Pierre-Gilles de Gennes, who had interest
to liquid crystals and soon found fascinating analogies between liquid crystals and superconductors as well as magnetic material was rewarded with the Nobel Prize in Physics 1991.
The future of liquid crystals has just begun. There are still unsolved physical problems in this area, despite the fact that researchers in the fifties had already withdrawn form this area, thus giving an interesting field for the pure scientist. The need for liquid crystal applications grew, requiring engineers specialized in this field. Statistics show that cathode ray tube displays in TVs and computer monitors will be overtaken by liquid crystal displays in the near future. More recent applications involve switchable windows that can be changed from clear and opaque with the flip of a switch, liquid crystal displays with wider viewing angles, and displays that can remain in use for years without the need of power.
Knowledge in the field of liquid crystals is crucial for an understanding of biological membranes, thus biologists, medical researchers and pharmacists are also interested in liquid crystal research.
1.2.
Research Background
The liquid crystal display (LCD) technology is currently the dominating technology for flat panel displays. The application range from simple twisted nematic (TN) display in a wrist watches to the latest vertically aligned (VA) and in-plane switching (IPS) modes for states of the art, high definition large screen LCD-TVs. The main advantages of the LCD are its thin profile, low emissive display, does not generate any light itself, instead it modulates light passing through the unit. Several mechanisms for light modulation have been developed and presented. These mechanisms include polarization rotation, phase retardation, absorption, light scattering and Bragg reflection.
lately gathered much attention because of its advantages over the conventional rubbing of polyimide coating and several different approaches for the realization of photoalignment have been presented. Common to all methods is that anisotropy in the alignment layer is provided by exposing linearly polarized ultraviolet (LPUV) light to a photo-sensitive material. Due to its non-contact nature, a photoalignment eliminates generation of dust and electrostatic charges as well as mechanical damage to the surface. From another point of view, photoalignment is also interesting because the technology enables greater control of several important liquid crystal cell parameters, including pretilt angle, azimuthal and polar anchoring energy, all critical parameters for the realization of surface controlled bistable devices.
Portable electronic devices, such as a mobile phones and personal digital assistants, have lately increased the demand for high performance display with low power consumption. An interesting candidate with the potential of fulfilling these demands is the reflective single-polarizer surface controlled bistable twisted nematic (BTN) LCD. Being a direct-view reflective display ambient light is used to read the information. Hence the device does not require any backlight, leading to reduced power consumption and panel weight stable states in the absence of an electric field, is capable of practically unlimited multliplexing, leading to high resolution on a passive matrix. This results in the elimination of the costly active matrix thin film transistor addressing technique that traditionally has to be used in the order to achieve high levels of complexity of the display. Furthermore, in bistable devices, voltage is only needed when the image is changed. As a consequence, the power consumption of these devices is extremely low. Since the early 1980s, nematic, cholesteric and smetic bistable liquid crystal technologies have been proposed. During recent years, there has been an increasing interest in surface controlled bistable nematic device based on anchoring breaking. The main advantage of these newer technologies is their robust and longterm bistablity. The bistable LC display is also suitable for portable electric device such as electronic paper (e-paper).
gap materials [11–14]. The very narrow stable temperature range of the BP, however, typically a few Kelvin, is a serious problem for device applications [15]. Although, much effort has been made to expand the narrow temperature range of the BP, Kikuchi et al. firstly reported that the temperature range of the BP can be expanded over 60 °C by adding a small quantity of precursor polymers within the BP materials, referred to as a polymer-stabilized blue phase (PSBP) [16]. Coles and Pivenko reported that, in dimer LCs with large flexoelectricity, the temperature range of the BP was more than 44 °C [17]. Yoshizawa and coworkers reported that the T-shaped molecules and the binaphthyl derivative represented the BP temperature ranges of 13 and 29 °C, respectively [18, 19]. Some other methods such as adding hydrogen-bond LCs and nanoparticle stabilization have also been used to expand the BP temperature range [20, 21].
1.3.
Objectives of the Investigation
There are two main objectives of the investigation. The first one is to come up with a bistable liquid crystal device using unpolarized UV light, single-step laser patterning on a photoalignment layer using a photomask was proposed to achieve an equilibrium configuration of LC molecules in contact with a periodically patterned substrate. The patterns were formed by stripes of alternating random planar and homeotropic anchoring on a submicrometer scale in the order of 0.5 micrometer. Two possible configurations of bistable LC cells that can be obtained by combining a micropatterned surface formed with alternating random-planar- and homeotropic-alignment with planar- or homeotropic-alignment surfaces were proposed. The alignment properties of the two proposed models were investigated, along with the microscopic switching behavior of micropatterned nematic liquid crystal cells.
1.4.
Outline of This Thesis
References
[1] O. Lehmann, Z. Phys. Chem. 4 (1889) 462.
[2] F. Reinitzer, Wiener Monatschr Für Chem. 9 (1888) 421. [3] G. Friedel, Annu. Physique 18 (1922) 273.
[4] G. W. Gray, S.M. Kelly, J. Mater. Chem. 9 (1999) 2037. [5] R. Williams, J. Phys. Chem. 39 (1963) 382.
[6] J. A. Castellano, American Scientist 94 (2006) 438.
[7] G. H. Heilmeier and L. A. Zanoni, Appl. Phys. Lett. 13 (1968) 91.
[8] G. H. Heilmeier, L. A. Zanoni and L. A. Barton, Proc. IEEE 56 (1968) 1162. [9] T. P. Brody, Information Display 13 (1997) 28.
[10] H. Kikuchi: Struct. Bonding 128 (2008)
[11] Z. Ge, S. Gauza, M. Jiao, H. Xianyu, and S. T. Wu: Appl. Phys. Lett. 94 (2009) 101104.F. C. Frank, Disc. Faraday Soc. 25 (1958) 19.
[12] S. Y. Lu and L. C. Chien: Opt. Lett. 35 (2010) 562.M. Miesowicz, Nature 17 (1935) 261
[13] H. Y. Liu, C. T. Wang, C. Y. Hsu, T. H. Lin, and J. H. Liu: Appl. Phys. Lett. 96 (2010) 121103.
[14] W. Cao, A. Munoz, P. Palffy-Muhoray, and B. Taheri: Nat. Mater. 1 (2002) 111. [15] Y. Hisakado, H. Kikuchi, T. Nagamura, and T. Kajiyama: Adv. Mater. 17 (2005)
96.
[16] H. Kikuchi, M. Yokota, Y. Hisakado, H. Yang, and T. Kajiyama: Nat. Mater. 1 (2002) 64.
[17] H. J. Coles and M. N. Pivnenko: Nature 436 (2005) 997.
[18] A. Yoshizawa, M. Sato, and J. Rokunohe: J. Mater. Chem. 15 (2005) 328. [19] A. Yoshizawa, Y. Kogawa, K. Kobayashi, Y. Takanishi, and J. Yamamoto: J.
Mater. Chem. 19 (2009) 5759.
[20] W. He, G. Pan, Z. Yang, D. Zhao, G. Niu, W. Huang, X. Yuan, J. Guo, H. Cao, and H. Yang: Adv. Mater. 21 (2009) 1.
Chapter 2
Physical Properties of Liquid Crystals
2.1. Introduction
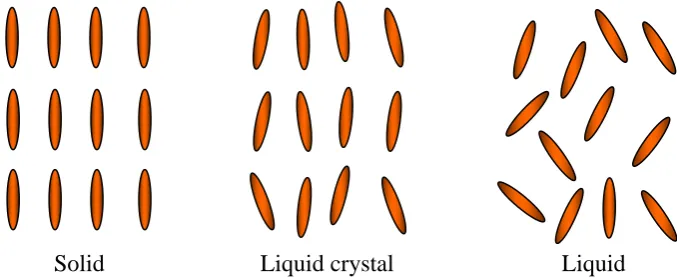
Most substances can exist in more than one phase. For example, water is a solid below 0°C, a liquid between 0°C and 100°C, and a gas over 100°C. These three phases are different from each other since the molecules are in each phase possesses different amount of order. In solids, the molecules are constrained to occupy only certain positions. This condition is described by saying that the solid phase possesses positional order. It is also possible for the solid phase to possess orientational order, where the molecules in the specific positions are constrained in the way they orient themselves with respect to one another. When a solid melts to a liquid, both types of order are completely lost. However, for some specific materials there exists an intermediate phase between the solid and the liquid phases, see Figure 2.1. This phase is called liquid crystal phase and is characterized by some degree of long-range order.
[image:19.595.136.475.445.584.2]Solid Liquid crystal Liquid
Figure 2.1. Molecular structure of solid, liquid crystal and liquid
between the traditional solid and liquid phases and this is the origin of the term mesogenic state, used synonymously with liquid crystal state. Figure 2.1 shows the average alignment of the molecules for each phase.
In the simplest liquid crystal phase, the nematic phase, the rod-like molecules posses a certain degree of oriental order. One example of material possessing the nematic liquid crystal phase is the low mass cyanobiphenyl 5CB (4-n-pentyl-4-cyanobiphenly) is shown in Figure 2.2.
C5H11 CN
K 22.5 ºC N 35.5 ºC I
C5H11 CN
K 22.5 ºC N 35.5 ºC I
Figure 2.2. Molecular structure of 5CB (4-n-pentyl-4-cyanobiphenly).
2.2. Thermotropic, Polymeric and Lyotropic Liquid Crystals
There are three distinct types of liquid crystals: thermotropic, polymeric and lyotropic. These materials exhibit liquid crystalline properties as a function of different parameters.
2.2.1. Thermotropic Liquid Crystals
In a thermotropic liquid crystals, as the temperature is increased, the solid will lose regularity in position but not in orientation. Thus it has some partial regular structure. Liquid crystals are characterized by regular orientations.
Melting Clearing
Solid Point Liquid Point Liquid
(Crystalline) Crystal (Amorphous)
Figure 2.3. Status change of a thermotropic liquid crystals.
[image:20.595.195.414.242.309.2] [image:20.595.113.510.574.635.2]some degree of spatial ordering and there is a layer structure. In cholesteric phase, the liquid crystal molecules are same as chiral nematic. The orientation is regular and the spatial position is random.
2.2.1.1. Nematic and Cholesteric Phases
The nematic phase type exists in two well-known structure types: the ordinary nematic structure of nonchiral compounds, and the cholesteric (twisted nematic) structure of substances with chiral molecules.
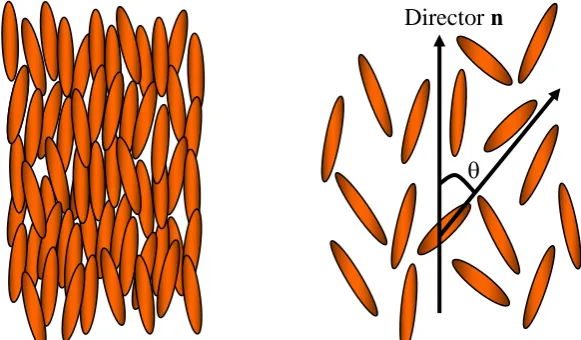
[image:21.595.156.447.556.726.2]In the most simple LC phase, one molecular axis tends to point along a preferred direction as the molecules undergo diffusion. This preferred direction is called the director and is denoted by the unit vector n [1, 2]. An orientational distribution function f(θ)dθ can be defined by either taking a snapshot of the molecules at any one time and noting how many axes make an angle θ and θ +dθ with the director or by following a single molecule, noting at specific times the angle θ between the molecular axis and the director. Since all directions perpendicular to the director are equivalent in the most simple LC phase, the orientational distribution function does not depend on the azimuthal angle φ. A snapshot of elongated molecules in such a phase is shown in Figure 2.4. To specify the amount of orientational order in such a LC phase, an order parameter is defined. This can be done in many ways, but the most useful formulation is to find the average of the second Legendre polynomial,
S = 〈3cos −1〉 2
1 2θ
(2.1)
where the brackets denotes an average over many molecules at the same time or the average over time for a single molecules.
Figure 2.4. Molecular order in a nematic liquid crystal.
θ
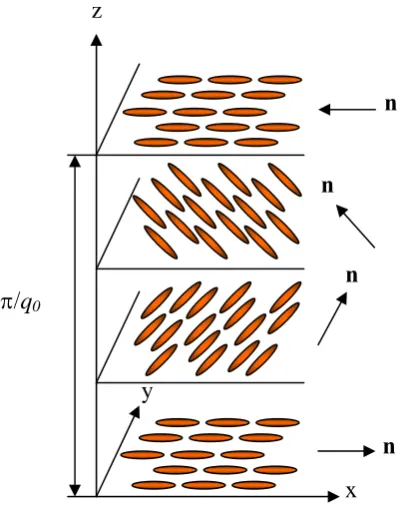
The ordinary nematic structure shows an optically positive uniaxial behavior. Chiral molecules cause a twist in the nematic structure, and the cholesteric structure (Figure. 2.5) appears. It consists of a set of quasi-nematic layers, whose individual directors are turned through a fixed angle on proceeding from one layer to the next. The
layers which are turned through an angle of 2π are equivalent; their distance defines the pitch p of the screw.
The nematic and the cholesteric phases are very similar in their basic structures. Due to the strong twisting, however, the optical properties of the nematic phase are radically altered. In a certain spectral range, cholesteric phases show a selective reflection of circularly polarized light. The maximum of this reflection lies at the
wavelength λmax:
λmax = p⋅n (2.2)
n is an average refractive index of one quasi-nematic layer.
The cholesteric medium exhibits a strong optical activity which shows a positive
as well as negative extreme, and which changes its sign at λmax. The selective reflection
as well as the optical activity remarkably influence the optical appearance (textures) of cholesteric phases, which show optically negative uniaxial behavior.
n
x z
y
π/q0
n
n
n
Figure 2.5. The arrangement of molecules in the cholesteric mesophase.
[image:22.595.173.377.411.665.2]2.2.1.2. Smetic A and Smetic C Phases
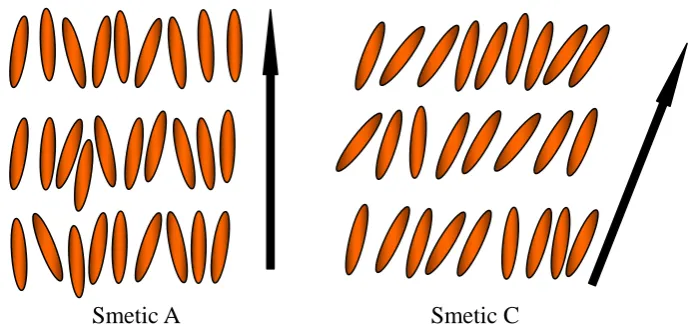
[image:23.595.135.481.239.405.2]In layered liquid crystal phases, there exists both orientational order and some degree of positional order. This layered structure can be observed in the smetic phases. These phases are liquids in two dimensions along the layers but solids in the third dimension. In the smetic A phase, the director is parallel to the layer normal, while in the smetic C phase, the director makes an angle to the normal. This is illustrated in Figure 2.6.
Smetic A Smetic C
Figure 2.6.The arrangement of molecules in the Smetic A and Smetic C phases
2.2.2. Polymer Liquid Crystals
Polymer liquid crystals (PLCs) are a class of materials that combine the properties of polymers with those of liquid crystals. These "hybrids" show the same mesophases characteristic of ordinary liquid crystals, yet retain many of the useful and versatile properties of polymers.
In order for normally flexible polymers to display liquid crystal characteristics, rod-like or disk-like elements (called mesogens) must be incorporated into their chains. The placement of the mesogens plays a large role in determining the type of PLC that is formed. Main-chain polymer liquid crystals or MC-PLCs are formed when the mesogens are themselves part of the main chain of a polymer. Conversely, side chain polymer liquid crystals or SC-PLCs are formed when the mesogens are connected as side chains to the polymer by a flexible "bridge" (called the spacer.). Figure 2.7. shows the main chain and side chain of polymeric liquid crystals.
(a)
(b)
Figure 2.7. Polymeric liquid crystals: (a) main chain; (b) side chain.
2.3. Properties of Liquid Crystals
2.3.1. Dielectric Constant
As a consequence of the orientational order, the nematic liquid crystals are uniaxially symmetric, with the symmetry axis parallel to the long axis of the molecules.
This symmetry will lead to different dielectric constants parallel (ε||) and perpendicular
ε⊥ to the director. The dielectric anisotropy is defined as
Δε = ε|| − ε⊥. (2.3)
The dielectric anisotropy can be both positive and negative and varies between
typical values from +25ε0 to -5ε0, where ε0 is the permittivity of free space. In
electro-optical applications of liquid crystals, an electric field is applied to control the orientation of the liquid crystal molecules. Liquid crystals with positive dielectric anisotropy tend to align parallel to the field while liquid crystals with positive dielectric anisotropy align perpendicular. Although liquid crystals with positive dielectric anisotropy are most commonly used, both types can be found in applications depending on the switching principle. If low switching voltage is desired, the liquid crystal used should have large absolute value of the dielectric anisotropy.
Most nematics (e.g., E7, 5CB, etc., ε|| > ε⊥) are said to possess positive
(dielectric) anisotropy. On the other hand, some nematics, such as MBBA, possess
[image:24.595.114.501.105.277.2]2.3.2. Refractive Index
The uniaxial symmetry also leads to an optical anisotropy (or birefringence) with two principal refractive indices. These two are the ordinary (no) and the extraordinary
(ne) index of refraction, for light with its polarization perpendicular and parallel to the
director, respectively. Similar to the dielectric anisotropy, the optical anisotropy is defined as
Δn = ne − no = n|| − n⊥. (2.4)
and is positive if no <ne, while it is said to be negative if no >ne,. Most liquid crystals
with rod-like molecular shape exhibit positive birefringence with typical values ranging from 0.06 up to 0.4.
2.3.3. Elastic Constants
The elastic constants of liquid crystals are the material parameters that determine the restoring torque that arises when the system is perturbed from its equilibrium configuration. When an electric field is applied to reorient the molecules to control the effective birefringence in an electo-optical device, it is the balance between the electric and elastic torque that determines the static deformation of the liquid crystal director. Any deformation can be devided into a combination of three basic deformations, splay, twist and bend. All illustrated is Figure 2.8.
Splay Twist Bend
Figure 2.8. The three basic types of deformation in the liquid crystals
According to the notation of the Oseen-Frank theory, the elastic energy density of a deformed nematic liquid crystal can be written [3,4].
(
)
2(
)
2(
2elas 11 22 0 33
1
div curl curl
2
f = ⎣⎡K n + K n⋅ n+q + K n × n
)
⎦⎤ (2.5) [image:25.595.142.447.457.604.2]p
q0 = 2π is the wave vector of a cholesteric.
The positive and negative values correspond to the right- and left-handed
helixes, respectively. In ordinary nematic phases, p is infinite, and therefore
vanishes in equation (2.5).
0
q
0
q
Equation (2.5) is the basis for the theoretical treatment of defects and textures of nematic and cholesteric phases. For a stable distortion, the solutions of equation (2.5) have to yield a relative minimum in the free energy. Distortions that do not correspond to minima of felas are unstable and should therefore not occur in stable textures.
The minimum voltage needed to reorient the liquid crystal molecules arranged in a parallel untwisted structure as shown in Figure 2.9is related to the elastic constants as well as to the dielectric anisotropy according to
11 c
0 K
V π
ε εΔ
= (2.6)
For voltages below the minimum voltage, the liquid crystals remain completely undeformed. Then at some threshold value of the voltage, the deformation begins and gets greater as the voltage increases. This transition from an undeformed to a deformed texture at a certain value is called the Freedericksz-transition [5]. It should be emphasized that strong anchoring to the boundaries prevails and that the director in the undeformed configuration is oriented perpendicular to the electric field.
V < Vc V > Vc
E E
[image:26.595.164.452.548.706.2]threshold.
2.3.4. Viscosity
In the nematic phase the three flow viscosities, ηa, ηb and ηc, also called
Miesowisz viscosities [6], can be identified as shown in Figure 2.10. By forcing the director to keep the orientations and moving the top plate, the different viscosities can
be measured. As expected, ηc >ηa >ηb, that is, that is, when the director is perpendicular
to the flow the viscosity is at its largest. If the director is not held in its place, it will be affected by a torque, creating a hydrodynamic torque and introducing two rotational
viscosities γ1 and γ2. In most LCDs, the director is reoriented by the application of an
electric field. Out of the discussed liquid crystal material parameters, it is mainly the rotational viscosity that defines the switching times.
[image:27.595.137.451.332.497.2]ηa ηb ηc
Figure 2.10. The force necessary to slide the top plate over the bottom plate with the liquid crystal in between depends on the orientation of the liquid crystal molecules. As a consequence, liquid crystals possess more than one viscosity constant
2
eff off
eff
d K γ
τ ∝ (2.7)
2
2 0
eff on
d
V γ τ
ε εΔ
∝ (2.8)
estimation of the relaxation time, the time it takes for the deformed liquid crystal structure to reach its equilibrium configuration after the electric field is switched off [7]. The corresponding response time, the time for the director to reorient in an applied electric field, is given by Equation (2.8). It contains no elastic terms since those can be
neglected if the applied voltage is well over the threshold voltage. In equations γeff is the
effective rotational viscosity and Keff is the effective elastic constant, depending on the
LC cell molecule configuration. Usually τoff is longer than τon since the electric torque is
References
[1] F. C. Frank, Liquid crystals: Proc. Int. Conf., Meeting Date December 3, 1979, (S. Chandrasekhar ed.), Heyden, London, England (1980) 1.
[2] P. J. Collings and M. Hird, “Introduction to Liquid Crystals: Chemistry and Physics”, Taylor and Francis, London (1995)
[3] C. W. Oseen, Trans. Faraday Soc. 29 (1933) 883. [4] F. C. Frank, Disc. Faraday Soc. 25 (1958) 19.
[5] V. Freedericksz and V. zolina, Trans. Faraday Soc. 29 (1933) 919
[6] M. Miesowicz, Nature 17 (1935) 261
Chapter 3
Optics of Liquid Crystals
3.1. Introduction
The optical properties of multilayered anisotropic media such as LC cells have been studied for a long time. Physical models for the optics of LCs have been developed from the beginning of the century. The optics of cholesteric materials was studied by several authors like Mauguin [1], Oseen [2], and de Vries [3]. In 1941, Jones [4]
published a 2 × 2 matrix method for calculating the optical properties of general multilayered anisotropic media at normal light incidence. 4 × 4 matrix methods were developed by Smith [5] and Berreman [6], which made the calculation at oblique
incidence possible. Jones 2 × 2 matrix method was further improved by Gharadjedaghi [7] and Yeh [8] to cope with oblique incidence. Later on, other 4 × 4 matrix methods were developed [9, 10]. These matrix methods allow the calculation of the optical properties of general birefringent multilayers with arbitrary orientation of the index ellipsoid in each layer. This flexibility made the matrix methods very attractive for the computation of LCD optics, since polarizers, retarders and of course the LC-layer itself with the arbitrary optic axis orientation can be treated in a systematic way.
3.2. Light Propagation in an Isotropic Medium
Maxwell’s equations in a medium
= B
t
∂
∇ × −
∂
E (3.1)
= D + t
∂ ∇ ×
∂
H j (3.2)
= ρ
∇ ⋅ D (3.3)
= 0
∇ ⋅ B (3.4)
Material equation (linear response is assumed)
0 s
= ε = ε ε
0 s
= μ = μ μ
B H H (3.6)
= σ
j E (3.7)
ε: dielectric constant
0
ε : dielectric constant of vacuum
s
ε : relative dielectric constant (specific inductive capacity)
μ: magnetic permeability
0
μ : magnetic permeability of vacuum
s
μ : relative magnetic permeability
σ: conductivity
From equations (3.1), (3.2), (3.3), (3.4),
2
0 s 0 s 0 s 2
( ) = =
t t
μ μ ∂ μ μ ⎛ε ε ∂ σ ⎞
∇ × ∇ × − ∇ × − ⎜ + ⎟
∂ ⎝ ∂ t ⎠
∂ ∂
E E
E H .
Using the identity ∇ × ∇ × ( E) = ∇ ∇ ⋅ ( E) − ∇2E , and assuming = 0ρ , we
obtain
2 2
0 s 0 s 0 s 2 = 0
t t
σμ μ ∂ ε ε μ μ ∂
∇ − −
∂ ∂
E E
E (3.8)
because ∇ ⋅ E = 0. In the same manner, we obtain
2 2
0 s 0 s 0 s 2 = 0
t t
σμ μ ∂ ε ε μ μ ∂
∇ − −
∂ ∂
H
H H (3.9)
Let us consider a monochromatic plane wave propagating along z direction. Putting
Ex = E0 exp i t z v
ω
⎧− ⎛ − ⎞⎫
⎨ ⎜ ⎟⎬
⎝ ⎠
⎩ ⎭ (3.10)
and substituting this equation into equation (2.50), we obtain
s
0 s 0 s s
2 2
0
1
= + i = +
v c
μ i
σ σ
μ μ ε ε ε
ω ωε
⎛ ⎞
⎛ ⎞
⎜
⎜ ⎟
where we use the relation ε μ0 0 = 1 c2(c: velocity of light in vacuum).
We define the complex refractive index n* as
1 2
*
s s
0
= c = + i n v σ μ ε ωε ⎧ ⎛ ⎞⎫ ⎪ ⎪ ⎨ ⎜ ⎟⎬ ⎪ ⎝ ⎠⎪
⎩ ⎭ . (3.12)
In n* = + n iκ , n is called refractive index and κ is called extinction coefficient.
n2− κ2 = μs sε , s 0
2nκ = σμ
ωε (3.13)
For nonmagnetic materials, we can put μs = 1. In this case, complex relative
dielectric constant εs* = ε1 + iε2 is given by
ε1 = n2− κ2, 2
0
= σ = 2n
ε κ
ωε . (3.14)
By using n*, equation (3.10) reduces to
Ex E0 exp i t nz exp z
c c ωκ ω ⎧ ⎛ ⎞⎫ ⎛ = ⎨− ⎜ − ⎟⎬ ⎜− ⎝ ⎠ ⎝ ⎩ ⎭ ⎞ ⎟
⎠. (3.15)
Equation (3.15) shows that the amplitude of electric field of the light propagating along z direction attenuates exponentially with attenuation coefficient ωκ c.
The absorption coefficient α is defined by
= d d I
I z
α − ⎜ ⎟⎛ ⎞
⎝ ⎠ (3.16)
where I is the light intensity. From equation (3.16), I = I0 exp
(
− αz)
. As I Ex2,2
0
1 = 2
c nc nc
ωκ ω σ
α ε
ε
= = . (3.17)
In general, the monochromatic plane wave propagating along the direction defined by unit vector a is expressed by
= 0 exp i t v ω ⎧− ⎛ − ⋅ ⎞⎫ ⎨ ⎜ ⎟⎬ ⎝ ⎠ ⎩ ⎭ a r
E E ,
= 0 exp i t v ω ⎧− ⎛ − ⋅ ⎫ ⎨ ⎜ ⎝ ⎠ ⎩ ⎭ a r
= 0 exp i t v ω ⎧− ⎛ − ⋅ ⎞⎫ ⎨ ⎜ ⎟⎬ ⎝ ⎠ ⎩ ⎭ a r
H H ,
= 0 exp i t
v ω ⎧− ⎛ − ⋅ ⎫ ⎨ ⎜ ⎝ ⎠ ⎩ ⎭ a r
B B ⎞⎟⎬. (3.18)
The phase τ of the plane wave is given by
*
= t n t
v c
ω
t
τ − ω ⎛⎜ − ⋅ ⎞⎟= ⋅ − ω = ⋅ −
⎝ ⎠
a r
a r k r ω (3.19)
where * n k c ω
= : (complex) wave number, ka = k: (complex) wave vector.
3.3.
Light propagation in an anisotropic medium
In this case, ε in equation (3.5) becomes tensor, and E and D are no longer parallel to each other in general.
D = εE (3.20)
or
x xx xy xz x
y yx yy yz
z zx zy zz
D E
D E
D E
ε ε ε
ε ε ε
ε ε ε
⎡ ⎤ ⎡ ⎤ ⎡ ⎢ ⎥ ⎢ ⎥ ⎢ = ⎢ ⎥ ⎢ ⎥ ⎢ ⎢ ⎥ ⎢ ⎥ ⎢ ⎣ ⎦ ⎣ ⎦ ⎣ y z ⎤ ⎥ ⎥ ⎥⎦
By using the principle of the conservative of energy, we can show that εij = εji, i.e., ε
is a symmetric tensor. Therefore, the coordinate system exists where ε can be
diagonalized as 1 2 3 0 0 0 0 0 0 ε ε ε ⎡ ⎤ ⎢ ⎥
ε = ⎢ ⎥
⎢ ⎥
⎣ ⎦
.
In an anisotropic medium, the phase velocity of light, and then, refractive index n depend on the propagation direction of the plane wave. We substitute
E = E0 exp
{
i(
k ⋅ r − ωt)
}
D= D0 exp
{
i(
k ⋅ r − ωt)
}
H = H0 exp
{
i(
k ⋅ r − ωt)
}
B= B0 exp
{
i(
k ⋅ r − ωt)
}
(3.21)into Maxwell’s equations (3.1), (3.2), (3.3) and (3.4) (we assume ρ= j = 0, μs = 1),
then, we obtain
k × E = ωμ0H, (3.22)
k × H = − ωD, (3.23) k ⋅ D = 0, (3.24) k ⋅ H = 0. (3.25) From equations (3.23), (3.24), and (3.25), it is easily seen that and H are perpendicular to each other. However, E is not necessarily perpendicular to k. From equation (3.22), it is seen that E is not perpendicular to H, i.e., it is in the plane made by
k and D. Then it is understood that the direction of the Poynting vector ,
k D
= ×
S E H does not coincide with the direction of k in general. In other words, the propagation direction of energy does not necessarily coincide with that of the phase in the case of light propagation in an anisotropic medium.
From equations (3.22) and (3.23), we obtain
(
)
{
(
)
2}
2 2
0 0
1 1 1
k
ω ω μ ω μ
= − × = − × × = − ⋅ −
D k H k k E k k E E
n
.
(3.26)
Substituting the relation (see equation (3.19) and n∗ = on the assumption of non-absorbing medium)
k=ωn
c a (3.27)
into equation (3.26), we obtain
(
)
{
}
{
(
)
}
2
2 0 2
0
n
n
c μ ε
= − ⋅ − = − ⋅ −
In the electric principal axes coordinate system, Ex =Dx ε1 , Ey =Dy ε2 , and
3
z z
E =D ε , then, equation (3.28) can be written as
(
)
2 0 1 1 1 x x D an ε ε
⎛ ⎞
− = − ⋅
⎜ ⎟
⎝ ⎠ a E ,
(
)
2 0 2 1 1 y y D an ε ε
⎛ ⎞
− = − ⋅
⎜ ⎟
⎝ ⎠ a E ,
(
2 0 3 1 1 z Dn ε ε
⎛ ⎞
)
z
a
− = − ⋅
⎜ ⎟
⎝ ⎠ a E . (3.29)
From equation (3.24), . Then, from equation (3.29),
we obtain
⋅ = a Dx x+a Dy y+a Dz z =0
a D
2
2 2
2 2 2
0 1 0 2 0 3
1 1 1 1 1 1
y
x a z
a a
n ε ε n ε ε n ε ε
0
+ +
− − −
= . (3.30)
If we put
0 1
1
1 0 0 0 s1
1 1 c
c ε
ε
ε μ ε μ
= = =
ε
0 2
2
2 0 0 0 s2
1 1 c
c ε
ε
ε μ ε μ
= = =
ε (3.31)
0 3
3
3 0 0 0 s3
1 1 c
c ε
ε
ε μ ε μ
= = = ε n c c n =
Equation (3.30) reduces to
2
2 2
2 2 2 2 2 2
1 2 3
y
x z
n n n
a
a a
c −c + c −c + c −c = 0. (3.32)
(
2 2)(
2 2)
2(
2 2)(
2 2)
2(
2 2)(
2 2)
22 3 3 1 1 2 0
n n x n n y n n z
c −c c −c a + c −c c −c a + c −c c −c a = . (3.33)
1, 2 and
c c c3 are called principal propagating velocities, and
1 1
n =c c = εs1,
2 2
n =c c = εs2 ,
3 3
n =c c = εs3 , (3.34)
are called principal refractive indices. Equation (3.32) or (3.33) is the Fresnel’s equation
of wave normal, which gives the phase velocity and the refractive index of the light
wave whose wave normal propagates along direction. Equation (3.33) is a quadratic
equation in . Thus to every direction there corresponds two phase velocities .
(The two values corresponding to any value of are counted as one, since the
negative value evidently belongs to the opposite direction of propagation .)
n
c
a
2
n
c a cn
n
c
± 2
n
c
− a