i
STUDY ON THERMAL MODEL FOR CALCULATING TRANSFORMER HOT SPOT TEMPERATURE
JAMAL ALI RAMADAN DOFAN
A thesis is submitted of the fulfillment of the requirements for the award of the degree of Master of Electrical & Electronic
Engineering
Faculty of Electrical & Electronic Engineering University Tun Hussein Onn Malaysia (UTHM)
ABSTRACT
A power transformer is a static piece of apparatus with two or more windings which, by electromagnetic induction, transforms a system of alternating voltage and current into another system of voltage and current usually of different values and at same frequency for the purpose of transmitting electrical power.
The hot spot temperature depends on instantaneous load and ambient temperature, winding design and also cooling model. There are two possible methods for hotspot temperature determination. The first method is to measure the hot spot temperature using a fiber optic, and other is to calculation the hotspot temperature using transformer thermal models. It was noticed that the hot spot temperature rise over top oil temperature due to load changes is a function depending on time as well as the transformer loading (overshoot time dependent function). It has also been noticed that the top oil temperature time constant is shorter than the time constant suggested by the present IEC loading guide, especially in cases where the oil is guided through the windings in a zigzag pattern for the ONAN and ONAF cooling modes. This results in winding hottest spot temperatures higher than those predicted by the loading guides during transient states after the load current increases, before the corresponding steady states have been reached.
This thesis presents more accurate temperature calculation methods taking into account the findings mentioned above. The models are based on heat transfer theory, application of the lumped capacitance method, the thermal-electrical analogy and definition of nonlinear thermal resistances at different locations within a power transformer. The methods presented in this thesis take into account all oil physical parameters change and loss variation with temperature. In addition, the proposed equations are used to estimate the equivalent thermal capacitances of the transformer oil for different transformer designs and winding-oil circulations. The models are validated using experimental results, which have been obtained from the normal heat run test performed by the transformer manufacturer at varying load current on a 250-MVA-ONAF-cooled unit, a 400-MVA-ONAF-250-MVA-ONAF-cooled unit and a 2500-KVA-ONAN-250-MVA-ONAF-cooled unit. The results are also compared with the IEC 60076-7:2005 loading guide method.
vi
ABSTRAK
Transformator daya adalah sebagai apparatus yang tidak bergerak dengan dua atau lebih gulungan
melalui aruhan electromagnetic mengubah viltan and arus yang ada dalam system kepada system yang
lain dengan frekuansinya sama dengan voltan dan arus yang biasanya nilai-nilai berbeza, dengan ini
bertujuan untuk penghantaran tenaga eletrik.
Suhu panas transfomator daya ini adalah bergantung pada beban sekitar dan suhu alam, reka
bentuk dan juga model pendindingan. Dua kaedah yang mungkin untuk menentukan suhu panasnya.
Kaedah pertama adalah mengukur suhu panasnya dengan menggunakan serat optic. Selain itu, mengira
suhu panasnya dengan menggunakan terma model transfomator. Didapati bahawa suhu panasnya akan
meningkat lebih daripada suhu minyak kerana perubahan beban merupakan fungsi yang bergantung pada
waktu apabila pembebanan transfor ( masa yang melebihi bergantung pada fungsi ). Didapati juga bahawa
masa malar yang diperlu oleh suhu minyak adalah lebih pendik daripada masa malar yang dicadangkan
oleh panduan IEC, terutamannya dalam kes di mana minyak yang dipandu melalui gulungan dalam pola
zigzag ONAN and ONAF mod pendindingan. Hal ini demikian bahawa suhu yang tertinggi kaji lilitan
tempat adalah tinggi daripada semua yang diramalkan dalam panduan tersebut, manakala keadaan
transiens selepas kenaikan bebean arus sebelum Negara-negara sepadan telah tercapai.
Tesis ini mengajikan cara pengiraan suhu yang lebih tepat dengan mempertimbang cara-cara yang
disebut di atas. Model tersebut berdasarkan pada teori penukaran haba, aplikasa kaedah lumped
capacitance, analogi terma-kuasa dan definisi pertahanan terma nonlinier di lokasi yang berbeza dalam
sebuah transfomator kuasa. Kedah yang dikaji dalam tesis juga mengambil kira semua perubahan fizikal
parameter miyak dan kehilangan veriasi dengan suhu. Selain itu, persamaan yanh dicadangkan diguna
untuk penganggaran capacitance terma serta untuk desain transformator yang lain dan peredaran berliku
minyak. Model diaktifkan menggunakan hasil eksperimen, yang telah diperolehi daripada uji coba panas
biasa dilakukan oleh pengeluar transformer di pelbagai arus beban pada unit 250-MVA-ONAF pendingin,
unit 400-MVA-ONAF-disejukkan dan 2500 -KVA-Onan-cooled unit. Hasilnya juga dibandingkan
dengan kaedah 60076-7:2005 panduan loading IEC.
CONTENTS
CHAPTER 2 LITERATURE REVIEW 7
2.1 Introduction 7
2.2 Transformer Thermal Diagram 8
2.3 Transformer Losses 9
2.4 Transformer Cooling System 10
2.4.1 Cooling Arrangement 11
TITLE i
DECLARATION ii
DEDICATION iii
ACKNOWLEDGEMENT iv
ABSTRACT v
ABSTRAK vi
CONTENTS vii
LIST OF TABLES LIST OF FIGURES
x xi LIST OF SYMBOLS AND ABBREVIATIONS
LIST OF APPENDIX
xiii xvii
CHAPTER 1 INTRODUCTION 1
1.1 Overview 1
1.2 Statement of the problem 3
1.3 Objectives of the research 4
1.4 Scope of the research 4
viii 2.4.1.1 Natural Cooling of Oil and Air (ONAN) 11 2.4.1.2 Natural cooling of oil and force air (ONAF) 13 2.4.1.3 Force Cooling of Oil and Force Air (OFAF) 15 2.4.1.4 Force and Directed Cooling of Oil and Force Air
(ODAF)
16
2.5 Transformer thermal models 18
2.5.1 Background 19
2.5.2 The non-linear thermal resistance 21
2.5.3 The top oil temperature model 25
2.5.4 The hot spot temperature model 27
CHAPTER 3 METHODOLOGY 30
3.1 Introduction 30
3.2 Methodology flowchart 31
3.3 Derive mathematical equation for transformer oil thermal characteristics
32
3.4 Derive mathematical equation for transformer thermal model
34
3.4.1 The top-oil temperature model 34
3.4.2 The hot spot temperature model 39
3.5 The simulation model 45
CHAPTER 4 RESULATS AND ANALASISY 47
4.1 Introduction 47
4.2 Transformers with external cooling 48
4.2.1 Three-phase 250/250/75-MVA ONAF -cooled transformer
48 4.2.2 Three-phase 400/400/125 MVA ONAF -cooled
transformer
50 4.3 Transformer without external cooling 52 4.3.1 2500 kVA ONAN-Cooled Transformer 52
CHAPTER 5 CONCLUSION AND RECOMMANDATION 56
5.1 Conclusion 56
5.2 Recommendation 58
REFERENCES 59
APPENDIX A-B 62-63-64
x
LIST OF TABLES
2.1 Thermal-electrical analogy 20
2.2 Empirical values for constants C and n 22 2.3 Thermal characteristics of transformer oil 23
3.1 Oil constants 33
LIST OF FIGURES
2.1 Transformer Thermal Diagram 8
2.2 Transformer Losses 9
2.3 ONAN cooling diagram 12
2.4 ONAF cooling diagram 14
2.5 OFAF cooling diagram 15
2.6 Cross section of a disc or helical winding showing heat flow paths 16
2.7 Oil flow in a directed flow winding 17
2.8 ODAF cooling diagram 18
2.9 An electrical RC circuit 20
2.10 The analogous thermal circuit 21
2.11 Oil viscosity variation with temperature 25
2.12 The top oil temperature model 26
2.13 The hot spot temperature model 28
3.1 The flow chart of this project 31
3.2 3.3 3.4 3.5
The top oil temperature model The hot spot temperature model Block diagram of top oil model
Simplified diagram of the thermal model
34 39 45 46
3.6 Block diagram of hot spot model 46
4.1 250 MVA transformer load 48
4.2 The hot-spot temperature of the 118 kV winding in the 250 MVA ONAF-cooled transformer
49 4.3 The top-oil temperature of the 250 MVA ONAF-cooled transformer 49
xii 4.5 The hot-spot temperature of the 410 kV winding in the 400 MVA
ONAF-cooled transformer
51
4.6 The top-oil temperature of the 400 MVA ONAF-cooled transformer 51
4.7 2500 kVA transformer load 52
4.8 The hot-spot temperature of the 20.5 kV winding in the 2500 kVA ONAN-cooled transformer
LIST OF APPENDIXES
APPENDIX TITLE PAGE
A The IEC 60076-7:2005 loading guide method 62
B Top oil time constant 63
xiii
List of symbols and abbreviations
A Area A1 A constant A2 A constant A3 A constant A4 A constant A5 A constant A6 A constant A7 A constant A8 A constant A9 A constant
Bp Overshoot factor (maximum of the function
C A constant
A constant
Specific heat capacity of oil
Rated average winding to average oil temperature gradient Grashof number
Normalized time variation of hot-spot temperature rise above top-oil H Heat transfer coefficient
H Hot spot factor
Per unit winding height to hot spot HV High Voltage
i Electrical current I Load current
IEC The International Electrotechnical Commission IEEE The Institute of Electrical and Electronics Engineers
K Load factor
L A characteristic dimension length, width or diameter LV Low voltage
MVA Megavoltampere
KVA Kilovoltampere
N A constant
Nu Nusselt number AN Air natural ON Oil natural
ONAN Oil natural and air natural ONAF Oil natural and air forced OFAN Oil forced and air natural OFAF Oil forced and air forced
DC losses per unit value
Eddy losses, per unit value
Load losses, per unit value
No-load los Stray losses, watts DC losses, watts
Winding losses, per unit value
Winding losses dependence on temperature
Eddy losses, watts Thermal power q Heat generation
Heat generated by no-load losses
Heat generated by rated no-load losses Heat generated by load losses
Heat generated by rated load losses Heat generated by the stray losses
xv
Heat generated by rated total losses Heat generated by winding losses
Heat generated by rated winding losses
R Ratio load losses at rated current to no-load losses Electrical resistance
Thermal resistance
Rated thermal resistance
Non-linear core to oil thermal resistance Non-linear winding to oil thermal resistance
Rated non-linear winding to oil thermal resistance
Non-linear thermal resistance of the oil Non-linear oil to air thermal resistance
Winding thermal resistance
Non-linear winding to oil thermal resistance
u Electrical voltage W Watt
Oil density
β Coefficient of thermal cubic expansion of the oil Oil viscosity
Oil viscosity per unit value
Oil viscosity rated value
Temperature Ambient temperature
Hot spot temperature
Low voltage winding hot spot temperature
High voltage winding hot spot temperature Temperature factor for the loss correction
Top oil temperature
Initial top oil temperature
Hot spot temperature rise over top-oil
Rated hot-spot temperature rise over top-oil
Top oil temperature rise over ambient Rated top oil temperature rise over ambient
Tested or rated hot-spot rise over ambient Tested or rated top-oil rise over ambient
Rated top-oil time constant
Rated winding time constant
CHAPTER 1
INTRODUCTION
1.1 Overview
Power transformers represent the largest portion of capital investment in transmission and distribution substations. In addition, power transformer outages have a considerable economic impact on the operation of an electrical network since the power transformers are one of the most expensive components in an electricity system (Susa, 2005).
Therefore knowing their condition is essential to meet the goals of maximizing return on investment and lowering the total cost associated with transformer operation. One of the most important parameters governing a transformer’s life expectancy is the hot-spot temperature value.
The transformer winding hot spot temperature is one of the most critical
the transformer to have a normal life expectancy. This is why there are many interests to know the hotspot temperature of transformer especially during actual operation
conditions in which the load and ambient temperature vary with time.
The classical approach has been to consider the hot-spot temperature as the sum of the ambient temperature, the top-oil temperature rise in tank, and the hot-spot-to-top-oil (in tank) temperature gradient. There are two possible methods for hotspot
temperature determination. The first method is to measure the hotspot temperature using a fiber optic temperature sensors positioned at the predicted hotspot of the windings. The thermal sensors, attached to the end optical fiber, are usually placed between the
insulated conductor and spacer, and their signals via optical fibre transmitted out of the tank. However due to the cost which may be difficult to justify in terms of cost for every new transformer. It is not practical for retro-fitting the existing transformers. The main difficulty with direct measurement technique is how to accurately locate the hotspot and possible the sensors.
Another method to identify the hotspot temperature is by using transformer thermal model or calculation method. The calculation of the internal transformer temperature (Hotspot temperature) is a very complicated and difficult task. However, engineers made simplifying assumptions in the generally accepted methods for calculating the temperature of power transformers as reported in the IEEE and IEC standards (IEEE Standard C57.19, 1995 and IEC Standard, 354: 1991). The thermal model of the power transformer is the more accurate methods to calculation the transformer hot spot temperature is using thermal electrical analogy based on heat transfer theory.
3
The commonly used models for hotspot temperature calculations are described in the international standards; IEC 354:1991 loading guide (IEC, 1991) and IEEE Std. C57.91-1995 loading guide (IEEE, C57.91-1995).
These models are in the form of simple mathematical equations and were developed by simplifying the fundamental heat transfer equations and combining them with simplified transformer loss calculations. According to the loading guides, the hot spot temperature is calculated as the sum of the ambient temperature, the top oil temperature rise in tank, and the hot spot to top oil (in tank) temperature gradient. One assumption has been made in developing these thermal models are the variation in the oil viscosity with temperature can be neglected.
However, when fiber optic probes were taken into use to record local hot spots in windings and oil ducts, it was noticed that the hot-spot temperature rise over top oil temperature due to load changes is a function depending on time as well as the
transformer loading (overshoot time dependent function). It has also been noticed that the top-oil temperature time constant is shorter than the time constant suggested by the present IEC loading guide, especially in cases where the oil is guided through the windings in a zigzag pattern for the ONAN and ONAF cooling modes. This results in winding hottest spot temperatures higher than those predicted by the loading guides during transient states after the load current increases, before the corresponding steady states have been reached. The foregoing thermal phenomena will directly cause the transient winding hottest spot temperatures to reach higher values than those predicted by the present IEC and IEEE loading guides for oil-immersed power transformers. Therefore it is important to have a thermal model to consider this transient state so that the hotspot temperature can be calculated with more accurate.
The main objectives of this research are listed as follows:
1. To study a transformer thermal model using thermal electric analogy method that improves the prediction of hotspot temperatures for the power transformer.
2. To introduce of all oil physical parameters change and loss variation with temperature.
3. To do a comparison between the derived thermal model and the international standard models.
1.4 Scope of the Research
The scope of the research work is to study the physical background for power transformer thermal model using thermal electrical analogy based on heat transfer theory, to allow capacity monitoring using data obtained from the normal heat run test performed by the transformer manufacturer. The mathematical model was developed using the MATLAB software package.
5
The remainder of this is organized as follows:
.
Chapter 2: literature reviewIn this chapter, an intensive literature review thermal model of the power transformer using thermal electrical analogy based on heat transfer theory. This chapter also presents the simple thermal diagram used to describe the thermal performance of a transformer and the hotspot temperature of winding where the severest ageing process would occur and also presents transformer losses. Different cooling modes available in are also discussed.
.
Chapter 3: MethodologyIn this chapter the mathematical equation derivation for transformer oil thermal
characteristics and also for transformer thermal model using thermal-electric analogy are explained. The last part of this chapter the derived thermal model is established in Simulink/Matlab software.
.
Chapter 4: Results and AnalysisIn this chapter the hot spot temperature and top oil temperature have been simulated using SIMULINK model which consider all oil physical parameters change and loss variation with temperature, The simulations are done for three different transformer units and two different tank types (i.e., tanks with and without external cooling) during different load tests. The comparison of hot spot temperature and top oil temperature between the derived thermal model and the IEC thermal model are done in this chapter.
CHAPTER 2
LITRATURE REVIEW
2.1 Introduction
The hotspot temperature represents the most important factor in determining the life of transformer insulation, since the highest ageing rate occurs at the hottest point which experiences the maximum temperature. The hotspot temperature has to be below the allowable limit value in order for the transformer to have a normal life expectancy. This is why there are many interests to know the hotspot temperature of transformer
especially during actual operation conditions in which the load and ambient temperature vary with time.
The hotspot temperature depends on instantaneous load and ambient
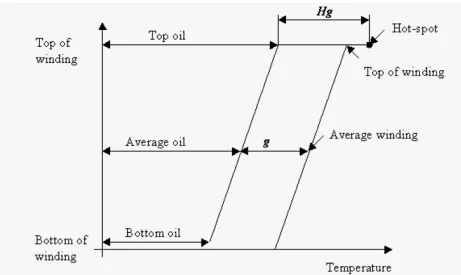
2.2 Transformer Thermal Diagram
A basic thermal model for power transformers is given in Figure 2.1, where it is assumed that the change in the oil temperature inside and along the winding is linearly increasing from bottom to top. The increase in the winding temperature from bottom to top is linear with a constant temperature difference (g). At the winding top the hot spot temperature is higher than the average temperature (g) rise of the winding. The
[image:22.612.115.576.344.619.2]difference in the temperature between the hot spot and the oil at the top of the winding is defined as (H.g), where H is a hot spot factor. It may be varied from 1.1 to 1.5, depending on short circuit impedance, winding design and transformer size. (Ahmed, 2009).
9
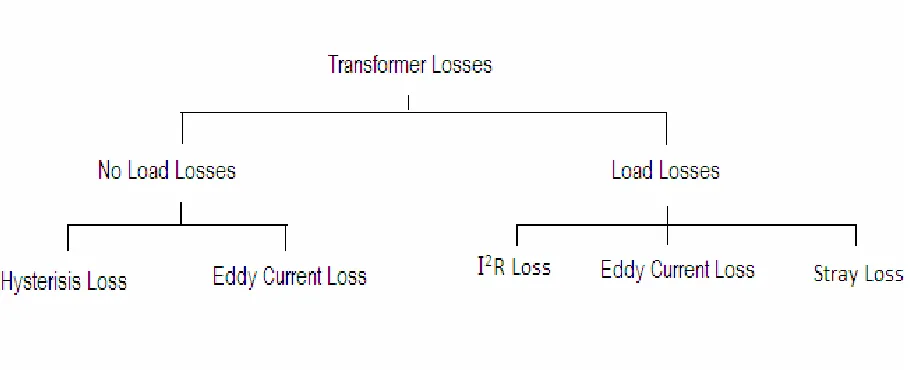
2.3 Transformer Losses
[image:23.612.114.569.196.381.2]During transformer operation losses are generated and these losses can be categorized into no load losses and load losses as shown in Figure 2.2.
Figure 2.2: Transformer Losses (Kulkani, 2004)
The no load losses, sometimes referred as core loss or iron, are the losses that are caused by the variation of variation flux in core steel materials. This is related to contain two main components, hysteresis loss and eddy current loss. This is related to the magnetic induction and hence the applied voltage. No-load losses are roughly constant and exist whenever the transformer is energized.
alternating leakage flux impinging on the conductors. These losses are related to the current and hence they are roughly proportional to the load square.
All these losses cause heating in the corresponding parts of transformer and this heat must be taken away to avoid high temperature which will cause deterioration of insulation. The winding made of copper can hold their mechanical strength up to several hundred degrees Celsius without deterioration and the transformer oil dose not
significantly degrade blow 140Co (Heathcote, 1998), however this is not case foe the paper insulation. The paper insulation deterioration rapidly if its temperature is more than 90 Co (Heathcote, 1998). Therefore we can say that one of the most important components determining the transformer life is the paper.
Since the temperature distribution is not uniform in a transformer , the part that is operating at the highest temperature will usually be considered in estimating
transformer insulation life since it will undergo the greatest deterioration . This temperature is referred as hotspot temperature adds it depends on the ambient
temperature, loading condition, transformer winding design and also cooling system.
2 .4 Transformer cooling system
The heat produced in a transformer must be dissipated to an external cooling medium in order to keep the temperature in a specified limit. If transformer insulation is
experienced higher temperature than the allowed value for a long time, it will cause rapid degradation of insulation and hence severely affect the transformer life.
11
convection and radiation (Kulkani, 2004). The conduction process involves the heat transfer between the solid parts, whereas the convection process involves the heat transfer between a solid surface to a liquid or vice versa. The heat transfer by radiation is between solid or liquid to the surrounding ambient temperature.
The most important heat transfer mechanism in an oil immersed transformer is through the convection. The convection process occurs between transformer winding and oil. It is always neglected in thermal calculation because of low surface temperature and small area available on a transformer for radiation process to occur. Four common types of cooling arrangement have been used in the industry and they will be explained in more details.
2.4.1 Cooling Arrangement
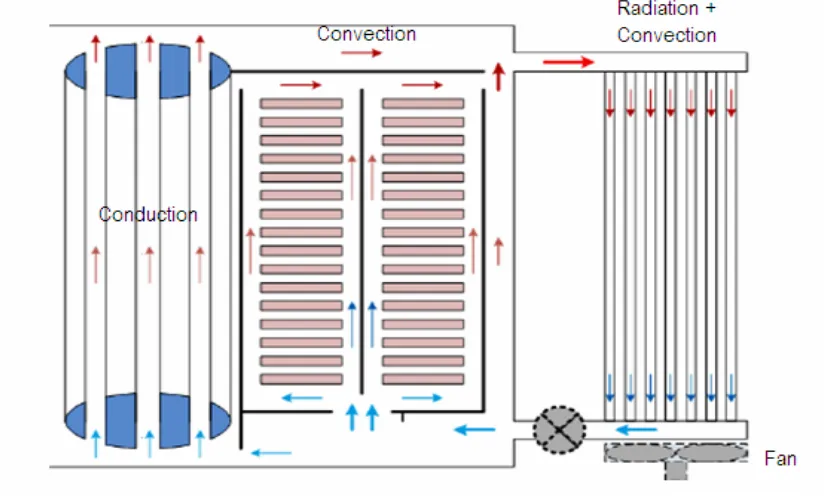
2.4.1.1 Natural Cooling of Oil and Air (ONAN)
The simple and most common cooling type used in the practice is ONAN. ONAN refers to Oil Natural Air Natural. The ONAN cooling is achieved when the oil flow through the transformer winding is driven by pressure difference between the tank oil and the cooler oil. This pressure difference is due to a temperature difference between the oil temperature in the tank and the oil temperature in the radiators. This natural circulation of oil sometimes has been referred as a “thermo siphon” effect. The ONAN design is shown in Figure 2.3.and arrows in the figure show the oil flow direction in the transformer.
density of the oil is inversely proportional to the temperature and is proportional to the pressure and height. As the oil temperature increases, its density reduces. The oil becomes light and due to buoyancy effect it moves upwards towards the top of the tank. Its place is taken by the cool oil from bottom which has a higher density. As the oil enters the cooler, the heat is dissipated along colder surfaces of the cooler, at the same time oil increases its density. The oil then flows downwards through the cooler and enters the bottom of transformer tank from the inlet thus the continuous oil circulation occurs.
The oil velocity in this natural circulation is relatively slow throughout the transformer and radiators. For this reason, ONAN transformers have large temperature difference between top oil and the bottom oil. They also have relatively large
temperature difference between the winding temperature and the oil temperature.
13
This ONAN cooling mode is normally used for smaller rating transformer (distribution transformer). The ONAN cooling mode has a few advantages. They are (Kulkani, 2004):
- It requires less maintenance and more reliable as no cooler controls are involved.
- It is useful when low noise transformers are needed. The low noise level is easier achieve when the transformer are without the fans.
- No cooler loss due to malfunction of the fans and pumps.
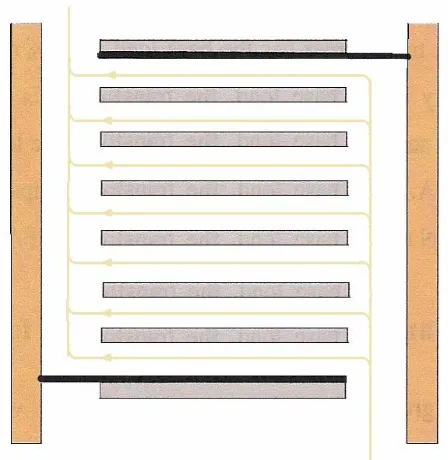
2.4.1.2 Natural cooling of oil and force air (ONAF)
One way to increase the oil circulation rate is by improving the efficiency of the
Figure 2.4: ONAF cooling diagram (Heathcote, 1998) and (Kulkani, 2004)
In the ONAF cooling mode the oil circulates through the core and winding as the same as in the ONAN cooling mode. The flow rate inside the winding under ONAN and ONAF cooling arrangement is controlled by the themosiphon effect. Normally this flow rate is relatively low. Because of this, the heat dissipating of oil is low. The heat
capacity can be expressed as
) ( out in
P T T
mC
Q= − (2.1)
Where Q is heat flow in W, m is mass flow rate in Kg/s, Cp is specific heat in J/ (Kg CO), and temperature Tout (top oil temperature) and Tin (bottom oil temperature)
15
2.4.1.3 Force Cooling of Oil and Force Air (OFAF)
[image:29.612.117.529.297.545.2]One way to improve the heat dissipation capability is to increase the value of mass flow rate; m and this can be done by using a pump to circulate the oil. Moreover to increase heat transfer rate, fans have to be always operating at the radiators. This improves the heat transfer to the radiators (cooling) and reduces considerably the temperature difference between the top and bottom of the radiators hence lower the oil temperature rise in the top parts of the transformer. This type of cooling is called OFAF (Oil Forced and Air Forced) as shown in Figure 2.5.
Figure 2.5: OFAF cooling diagram (Heathcote, 1998) and (Kulkani, 2004)
space between the winding barriers and to the tank. Therefore the oil temperature rise at the top of the winding may be higher than the measured top oil temperature rise.
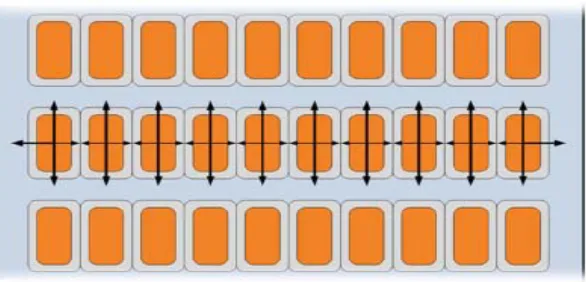
[image:30.612.122.415.356.497.2]2.4.1.4 Force and Directed Cooling of Oil and Force Air (ODAF)
Figure 2.6. Shows a group of conductors surrounded by vertical and horizontal cooling ducts. The heat generated in each conductor must be transferred to the oil to keep the temperature within the limits. The heat flow in the horizontal direction from a central conductor is limited by the similar temperature conductors on either side of it. Therefore the heat can transferred via vertical directions.
Figure 2.6: Cross section of a disc or helical winding showing heat flow paths (AREVA, 2008)
17
[image:31.612.108.332.141.371.2]achieving effective heat transfers from the conductors. The oil flow between the discs for a typical directed oil design is shown in Figure 2.7.
Figure 2.7: Oil flow in a directed flow winding (Heathcote, 1998)
The transformer with directed forced cooling is called ODAF (Oil Directed Air Forced). Atypical arrangement is detailed in Figure 2.8. Where the pumps are used to move the oil into the transformer and block washer are used to direct the oil flows inside the winding. The OD design will result in lower winding gradients than the ON and OF. It also reduces the top oil temperature rise of the winding and therefore the hotspot rise is much reduced compared to the ON and OF cooling mode.
Figure 2.8: ODAF cooling diagram (Heathcote, 1998) and (Kulkani, 2004)
2.5 Transformer thermal models
A thermal model of a power transformer in the form of an equivalent circuit based on the fundamentals of heat transfer theory has been suggested by Swift in (Swift, 2001). The proposed thermal model was established to determine the hot spot temperature. The top oil temperature was calculated from the air-to-oil model. The top oil temperature becomes the ambient temperature for the winding to oil model.
19
2.5.1 Background
In order to analyses the temperature conditions inside a transformer, the analogy between thermal and electrical processes is briefly reviewed below, (Susa, 2004) and (Swift, 2001).
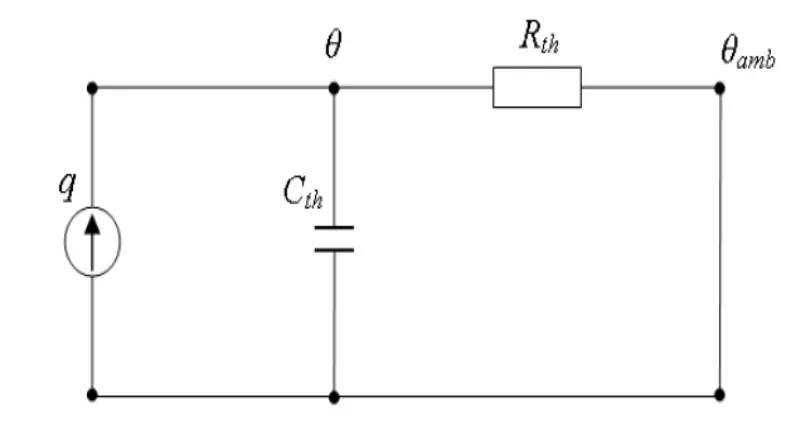
A thermal process can be defined by the energy balance equation:
dt R d C dt q th amb th × − + × =
× θ θ θ (2-2)
where:
q is the heat generation, Cth is the thermal capacitance,
θ is temperature,
Rth is the thermal resistance,
θamb is the ambient temperature.
The equation may be rewritten as follows:
(2-3) th amb th R dt d C
q= × θ +θ −θ
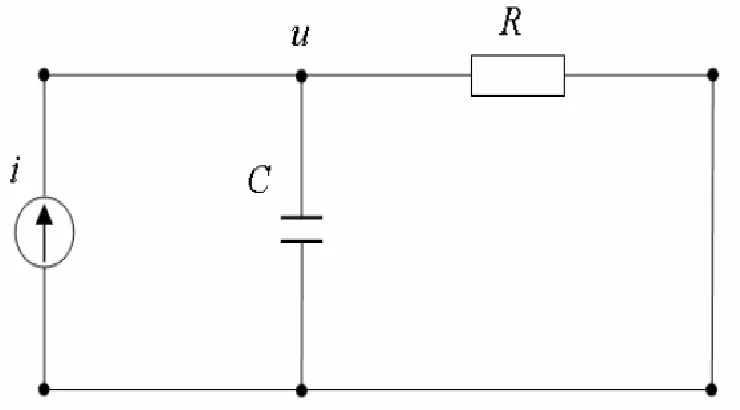
Now, if we define a simple electrical RC circuit, as given by Figure.2.10, we can write a similar equation based on both the first Kirchoff’s law and Ohm’s law:
(2.4) el el R u dt du C
i= × +
Figure 2.9: An electrical RC circuit
Simply, by comparing equations (2.3) and (2.4) we obtain the analogy between electrical and thermal processes, Table 2.1.
Table 2.1: Thermal-electrical analogy
Thermal Electrical
Generated heat q Current i
Temperature θ Voltage u
Resistance Resistance Capacitance Capacitance
[image:34.612.119.398.429.550.2]21
Figure 2.10: The analogous thermal circuit
2.5.2 The non-linear thermal resistance
The nonlinear oil thermal resistance, ( K)/W, according to heat transfer theory [(Incropera, 1996) - (King, 1932)], [(Rice, 1923) - (Rice, 1931)] and [(Susa, 2004) - (Swift, 2001)] is given in the following equation:
(2.5)
where:
is the heat transfer coefficient,
A is the area,
is the oil temperature gradient,
Hence, the nonlinear thermal resistance is inversely proportional to the heat transfer coefficient, whose dependence on temperature is explained in the text to follow. Based on heat transfer theory, the natural convection oil flow around vertical, inclined and horizontal plates and cylinders can be described by the following empirical correlation,[( Incropera, 1996) - (King, 1932)], [(Rice, 1923) - (Rice, 1931)]:
(2.6)
where C and n are empirical constants dependent on whether the oil circulation is laminar or turbulent. The basic values are given in Table 2.2, (Incropera, 1996).
Table2.2: Empirical values for constants C and n
The oil circulation C N
laminar 0.59 0.25
turbulent 0.10 0.33
The Nusselt number ( ) Prandtle number ( ) and Grashof number ( ) are described in the following equations, [(Incropera, 1996) - (King, 1932)], [(Rice, 1923) - (Rice, 1931)]:
= (2.7)
(2.8)
(2.9)
where:
23
k is the oil thermal conductivity, is the oil density,
is the oil thermal expansion coefficient, is the specific heat of oil,
is the oil viscosity,
is the oil temperature gradient, (K).
[image:37.612.111.562.332.701.2]The transformer oil has thermal characteristics strongly dependent on temperature as presented in Table 2.3, where oil viscosity dependency on temperature is most pronounced, (Grubb, 1981) and (Pierce, 1992).
Table 2.3: Thermal characteristics of transformer oil
Temperature Density
ρ, kg/m3
Specific heat Ws/(kg ) Thermal conductivity k, W/(m C0efficient thermal cubic expansion β,1/ Viscosity
μ, kg/(ms)
-15 896.885 1900 0.1262 8.6ҳ10-4 0.0694
-5 890.295 1940 0.1247 8.6ҳ10-4 0.0463
5 883.705 1980 0.1232 8.6ҳ10-4 0.0318
By substituting (2.7), (2.8) and (2.9) in (2.6) the following expression is obtained:
=C
(2.10)
The variation of viscosity with temperature is much higher than the variation of other transformer oil physical parameters, Table 2.3, (Blume, 1951) ,(Blume, 1938) ,(Grubb, 1981),(Karsai, 1987) and (Pierce, 1992) Therefore, all oil physical parameters except the viscosity in (2.10) will be replaced by a constant and (2.10) will be solved for the heat transfer coefficient, h, as follows:
(2.11)
where is assumed to be a constant, expressed as:
(2.12)
and is the viscosity, kg(ms) The viscosity dependence on temperature is given by the following equation, :
(2.13)
59
RFFRERENCES
Ahmed Al-Nadabi and Hisham Al-Riyami (2009) “Design A Simulation Model to Estimate the Hot Spot Temperature in Power Transformers” Sixth IEEE International Multi-conference on systems, signals & devices (SSD-09) March 23-26, 2009.
Blume L. F., Boyajian A., Camilli G., Lennox T. C., Minneci S., and Montsinger V. M.,(1951) "Transformer Engineering – 1st edition", John Wiley & Sons, Inc., New York, 1938.
Blume L. F., Boyajian A., Camilli G., Lennox T. C., Minneci S., and Montsinger V. M., (1938)"Transformer Engineering – 2nd edition", John Wiley & Sons, Inc., New York, 1951.
Grubb R.L., Hudis M., and Traut A. R., (1981)"A Transformer Thermal Duct Study of Various Insulating Fluids", Power Apparatus and Systems, IEEE Transactions on, Vol. PAS-100 , No. 2 , February 1981, pp. 466 - 473.
IEC (1991)"IEC354-1991 loading Guide for Oil-immersed Power Transformers"
IEC (1994)"IEC 72-2 Power Transformers; Part 2: Temperature rise", 1994-04 second edition
IEEE (1995)"IEEE Std C57.91-1995 IEEE guide for loading mineral-oil immersed transformers"
Incropera F. P., and DeWitt D. P., (1996) "Fundamentals of Heat and Mass Transfer", 4th ed., John Wiley & Sons, 1996, pp. 886.
King W.J., (1932)"The basic Laws and Data of Heat Transmission", Mechanical Engineering, March-August, 1932, pp.191.
Montsinger V. M., (1916) "Effect of Barometric Pressure on Temperature Rise of Self-Cooled Stationary Induction Apparatus", A.I.E.E. Trans., 1916.
Montsinger V. M., and W.H. Cooney, (1924)"Temperature Rise of Stationary Electrical apparaturs as Influenced by Radiation, Convection, and Altitude", A.I.E.E. Trans., Vol.43, 1924, p. 803.
Montsinger V. M., and Ketchum M.P., (1942) "Emergency Overloading of Air-Cooled Transformers by Hot-Spot Temperature", Supplemental Issue Elec. Eng, Decembar 1942.
M.J. Heathcote, J&P Transformer Book (1998). 12th ed. London, Reed Education and Professional Publishing Ltd, 1998.
Nordman H., and Lahtinen M., (2003) "Thermal overload tests on a 400-MVA power transformer with a special 2.5-p.u. Short time loading capability", IEEE Transactions on Power Delivery, Vol. 18 , Iss. 1, Jan 2003, pp.107 – 112.
Nordman H., Rafsback N., and Susa, D., (2003) "Temperature responses to step changes in the load current of power transformers", IEEE Transactions on Power Delivery, Vol. 18, Iss. 4 , Oct. 2003, pp.1110 – 1117.
Pierce L.W., (1992) "An investigation of the thermal performance of an oil filled transformer winding", IEEE Transactions on Power Delivery, Vol. 7, Iss. 3, July 1992, pp.1347-1358.
61
Rice W. Chester, (1923)" Free and Forced Convection of Heat in Gases and Liquides-II", Physical Review, Vol. 21, April, 1923and A.I.E.E. Trans., 1923, p. 1288.
Rice W. Chester, (1931)" Free and Forced Convection of Heat in Gases andn Liquides-II", A.I.E.E. Trans., February 1924, pp. 131.
Räfsbäck N. T., (2001) “Short-time emergency overloading of power transformers, Bachelor thesis”, Power transformer company, ABB, Vaasa, 2001.
Susa D., Lehtonen M., and Nordman H., (2004)"Dynamic Thermal Modelling of Distribution Transformers", the paper has been approved for publication in the Transactions on Power
Delivery
Susa D., Lehtonen M., and Nordman H., (2005)" Dynamic Thermal Modelling of Power Transformers", IEEE Transactions on Power Delivery, Vol. 20, Iss. 1, January 2005, pp. 197 – 204.
Swift G., Molinski T.S., and Lehn W., (2001) "A fundamental approach to transformer thermal modelling- I. Theory and equivalent circuit", IEEE Transactions on Power Delivery, Vol. 16, Iss. 2, April 2001, pp. 171 – 175.