5th International Scientific and Business Conference—Future Engineering 2019 ISBN: 978-1-60595-632-9
Influence of the Surface Roughness of
Ti6Al7Nb Alloy on Its Behavior in
Biotribological Systems
Katarzyna Piotrowska
1, Monika Madej
1, Emil Spišák
2and Dariusz Ozimina
1ABSTRACT
The paper presents the results of studies of Ti6Al7Nb alloy properties used in biotribological systems. The following physicochemical treatments of the alloy were compared: polishing, sandblasting, etching as well as sandblasting and etching. Element identification was performed using a scanning electron microscope equipped with an EDS microanalyser. Scanning and confocal microscopy was used to observe surface morphology and topography. Frictional tests were carried out using a ball-disk coupling in reciprocating motion in technically dry friction and friction with lubrication with Ringer’s solution. An optical tensiometer was used to determine the contact angle. As a result of the applied physicochemical treatments, surfaces of different morphology and geometric surface structure were obtained. The polished and etched sample had the most homogeneous surface. It was found that surface roughness significantly influences tribological properties. For the samples characterized by micro roughness of the surface, the best characteristics were obtained under conditions of technically dry friction. However, under the conditions of lubrication with Ringer's solution, the properties were the best for the samples characterized by nanoroughness. Ringer's solution reduced resistance to motion by approximately 20%. A negative influence of surface development on wetting was also found.
Keywords: Titanium alloys, SEM/EDS, Biomaterials, Friction, Abrasive Wear, Contact angle, Useful properties
________________
1
Kielce University of Technology, Faculty of Mechatronics and Mechanical Engineering, 7 al. Tysiąclecia Państwa Polskiego Street, 25-314 Kielce, Poland
2Technical University of Košice, Faculty of Mechanical Engineering, 9 Letná Street,
INTRODUCTION
The surface texture of the outer layer determines the basic properties of materials used for producing medical implants. The first contact of the organism with the biomaterial occurs through the surface layer. The interaction between the surface of the implant and the biological environment in vitro or in vivo is related to the properties of the outer layer of the material, the most important of which are the following: chemical composition, topography, surface energy, and wetting [1-2].
The leading group of materials used for implants are metallic biomaterials. They are used for orthopaedic, dental, cardiac, and endovascular implants. Because they are in direct contact with tissues and bodily fluids, they have to meet strict requirements. The most important feature they should have is biocompatibility, i.e. the material's ability to behave properly in contact with tissue. The biocompatibility of implants depends on the physical structure of the material and its physicochemical properties in terms of the interaction with the biological system [3-5].
The most commonly used material in medical engineering is titanium and titanium alloys. It results from its functional properties, i.e. biocompatibility and good mechanical parameters (high strength and relatively low modulus of elasticity) [6-8]. The most popular is the α+β Ti6Al4V alloy. However, clinical observations on the biotolerance of this material indicate that vanadium ions are harmful. It has been proven to cause cytotoxic reactions and neurogenic disorders [9]. Therefore, a group of alloys of the second generation has been created, which include the Ti6Al7Nb alloy, among others. Vanadium is replaced by neutral niobium in this alloy. Chemical compositions of the oxide layer in both alloys are similar; however, Nb2O5 niobium oxides show greater biocompatibility and are less likely to dissolve in the environment of bodily fluids [10]. As a result of use, the oxide layer may be damaged and consequently lead to the release of metal ions, which are transported with blood and may enter into distant tissues [11]. Therefore, it is important that degradation products do not cause harmful reactions to the human body. In order to eliminate such hazards and improve the properties of titanium alloys, physicochemical treatments are applied. The surface can be modified using different methods depending on the planned effect. Medical implants, according to the development of their surface, can be divided into three groups: macro-, micro- and nanorough. Materials are described as micro-rough if the arithmetic mean deviation of the surface roughness Sa is
between a few millimetres and a few tenths of micrometres. This type of topography allows only for mechanical anchoring of the implant in the bone, whereas large irregularities may hinder cell growth [12]. For the Sa parameter
In case of orthopaedic and dental implants, an appropriate degree of surface roughness is desirable. Research on biomaterials has shown that osteoblasts develop better on surfaces with high surface development, but their division is faster than in the case of smooth surfaces [14]. Moreover, the developed topography of the surface of the implant increases the potential of biomechanical contact at the implant-bone tissue boundary, and it also influences the rate of protein adsorption and the healing process [15]. According to Wennerberg, implants with a medium roughness Sa>1-2μm cause faster bone tissue response
compared to implants with a smooth Sa<0.5 μm or more developed surface Sa>2
μm [13]. The situation is completely different in the case of implants that come into direct contact with blood (e.g., stents). This type of implants requires the smallest possible development of surface texture, as blood cells quickly fill in microcavities on the surface of the implant [16]. The results of in vivo studies presented in [17] showing the reaction of the organism of farm animals to the development of the surface texture of the stent are noteworthy. It was shown that the topography of the surface of the implanted material affects the early and late reactions of the vessels with stents. In the case of unpolished surfaces, thrombosis occurred and the restenosis phenomenon, i.e. the recurrence of stenosis of the treated artery was more frequent. It was found that ensuring a smooth surface of stents is a basic stage in shaping their functional properties. Moreover, smooth surfaces promote colonization by fibroblasts, while surfaces with moderately developed surface topography cause the colonization and growth of osteoblasts by stimulating implant healing into bone tissue [15].
The article presents the use of various physicochemical surface treatments. As a result of polishing, sandblasting, etching, as well as sandblasting and etching, the samples of different morphology and surface texture were obtained. The applied treatments will be used to create surfaces in various implantological systems. As already noted, in the case of bone replacement implants, a faster osteointegration process will take place on surfaces with a moderate roughness. In the case of implants used in cardiac surgery, nanorough surfaces will be more useful.
MATERIAL AND METHODOLOGY
The materials used in the research were titanium discs with a diameter of 22 mm and a height of 6 mm with the mechanical properties presented in Table I.
TABLE I. MECHANICAL PROPERTIES OF TI6AL7NB ALLOY.
Material
Young's modulus E
[GPa]
Tensile strength Rm
[MPa] Compressive strength [MPa] Hardness [Vickers] Density [g/cm3]
The material that constituted a countersample in the tribological tests were balls made of aluminium oxide (III)—Al2O3, with diameters equal to 6 mm and a
surface roughness Sa equal to 0.37 µm which was loaded with a normal force
equal to 5 N. The most important mechanical properties of Al2O3 are shown in
Table II.
TABLE II. MECHANICAL PROPERTIES OF ALUMINIUM(III) OXIDE.
Material
Young's modulus E
[GPa]
Tensile strength Rm
[MPa] Compressive strength [MPa] Hardness [Vickers] Density [g/cm3]
Al2O3 393 206-300 2070-2620 1365 3.987
The faces of the discs were mechanically sanded with Buehler's Automet 250 grinder-polisher. SiC sandpapers with increasing grain gradations ranging from 120 to 2500 were used. The surfaces of the discs were then polished using polishing cloths and diamond pastes with grain sizes of 6 μm, 1 μm, and 0.05 μm. The aim of the treatment was to even out the surface before performing physicochemical treatments (sandblasting, etching, and sandblasting and etching). It was assumed that the polished surface was a reference sample. Sanding was carried out with a Wasserman sandblaster using Cobra Al2O3 abrasive with a
gradation of 125 μm. After abrasive blasting, the discs are washed in distilled water and then in ethanol in an ultrasonic cleaner for 5 minutes each time. The surfaces of the discs were then dried using compressed air. The next step was to etch both polished and sandblasted samples. The aim of etching was to reveal the microstructure of the sample, i.e. the shape and size of grains. The etching time pick was 2 minutes. The process took place in a solution consisting of 20 mL HF, 10 mL HNO3, and 20 mL glycerine. In the final phase, the discs were subjected to
the following tests: surface morphology, surface texture, tribological tests, and the determination of the contact angle.
TABLE III. TECHNICAL AND ENVIRONMENTAL PARAMETERS OF TEST.
Friction pair Unit Tribometer TRB
3
Al2O3 ball Φ6mm – disc Ti6Al7Nb Φ22mm
Load N 5
Sliding velocity m/s 0.0159
Cycle - 5000
Frequency Hz 1
Humidity % 40 ± 5
Temperature ˚C 23±1
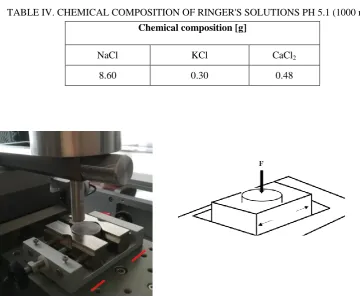
TABLE IV. CHEMICAL COMPOSITION OF RINGER'S SOLUTIONS PH 5.1 (1000 mL).
Chemical composition [g]
NaCl KCl CaCl2
8.60 0.30 0.48
Contact angle measurements were performed using an Attension Theta tensiometer. The static contact angle was determined during the tests, consisting in precise placement of drops of selected measuring liquids with a volume of approx. 4 µL on the tested surface and immediate measurement. Distilled water (pH 7) and Ringer's solution (pH 5.1) were used in the tests. The photograph of drops was taken with a digital camera after 2 seconds from the moment when it was placed on the surface of the sample. The drops were applied to each disc in a different part of the sample each time. The measurement was repeated 6 times. The contact angle was determined using OneAttension software on the basis of
[image:5.612.104.465.227.527.2]the measurement of the geometry of a drop of a measuring liquid applied to a given surface.
RESULT AND DISCUSSION
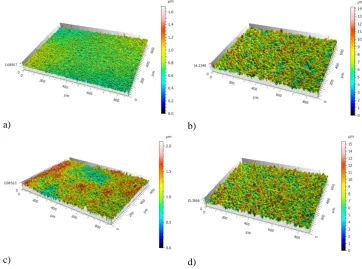
The aim of the research conducted using scanning electron microscopy (SEM) was a three-dimensional analysis of the surface morphology of the tested samples (Figure 2) and quantitative analysis of the chemical composition in microscale (Table V).
The surface morphology analysis showed that the polished sample has the most homogeneous surface. As a result of sandblasting, the surface of the titanium alloy had typical features for abrasive blasting, i.e. matte, heterogeneous, and developed, with high surface roughness. Visible pores with a diameter of about 1.02 µm were observed on the samples subjected to etching. The surface of a titanium alloy sandblasted with aluminium oxide and then etched also had a homogeneous surface with less roughness than that of a sample which was only sandblasted.
a)
c)
[image:7.612.106.467.78.380.2]d)
Figure 2. SEM images and exemplary spectrum analyses of the chemical composition Ti6Al7Nb alloy: a) polished, b) sandblasted, c) etched, d) sandblasted and etched.
TABLE V. CHEMICAL COMPOSITION OF TITANIUM ALLOY AFTER PHYSICOCHEMICAL TREATMENTS.
Weight [%] Ti O Al Nb Si C
Polished 65.8 7.6 4.4 6.8 1.6 13.2
Sandblasted 64.1 14.4 7.1 5.7 0.2 9.0
Etched 65.7 13.7 4.2 10.9 - 5.4
Sandblasted
[image:7.612.117.480.475.679.2]Table V presents the elemental composition of the tested samples obtained from the EDS analysis. This is the average of 10 measurements. The values are given as weighted percentages. All test samples consist predominantly of titanium. There is also a relatively large amount of oxygen in the form of an oxide layer formed spontaneously on the surface of titanium as a result of contact with atmospheric air. The presence of aluminium was observed in all tested samples. This element is both part of the alloy and the powder used in the sandblasting process.The etching process caused the exposure of niobium grains. The content of niobium in the etched sample is approximately 50% higher than in the other tested discs.
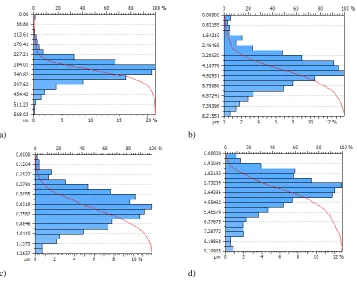
The next stage of the research was the assessment of the surface texture after polishing, sandblasting, and etching. Figures 3 and 4 show isometric images and distributions of the ordinates of surfaces with Abbott-Firestone curves. Additional information on the shape of the surface was obtained from amplitude parameters (Table VI).
The three-dimensional images made it possible to analyse and understand the geometric structure of the samples after polishing, sandblasting, and etching. Knowledge of the geometry of a surface is very useful when assessing its functional properties. The results of the tests revealed that, after sandblasting, and sandblasting and etching, the disc had the most developed surface texture.
a) b)
[image:8.612.110.473.379.648.2]c) d)
a) b)
[image:9.612.100.458.99.383.2]c) d)
Figure 4. Ordinate distribution and Abbott—Firestone curve: a) polished, b) sandblasted,
c) etched, d) sandblasted and etched.
TABLE VI. PARAMETERS OF THE SURFACE TEXTURE.
Parameter Specification Polished Sandblasted Etched Sandblasted and etched
Sa [µm]
Arithmetical mean
height of surface 0.0667 1.2369 0.2342 1.4266
Sp [µm]
Maximum surface
peak height 0.9610 7.4563 1.0517 8.0566
Sv [µm]
Maximum depth of
surface 0.7280 6.7784 1.0335 7.3099
Sz [µm]
Maximum height of
surface 1.6890 14.2348 2.0852 15.366
Ssk Skewness of surface 0.6972 0.1218 0.0940 0.0366
[image:9.612.97.471.463.642.2]Additional information about the state of the outer layer can be read from the amplitude parameters: skewness (Ssk) and kurtosis (Sku). The coefficient of
asymmetry Ssk, called skewness, characterizes the symmetry of the distribution of
ordinates of roughness height in relation to the mean plane. This parameter is sensitive to any changes in the shape of the surface. A positive value of this coefficient indicates a surface with elevations in a sharpened shape. Table 6 indicates that, in all cases, Ssk takes positive values. Kurtosis, or the coefficient of
concentration, is a measure of the smoothness of the distribution curve of profile ordinates. The Sku value of 3 indicates that the ordinate curve of the roughness
profile is close to normal distribution [18]. Table 6 shows that, in three out of four analysed samples, the Sku value takes a value close to 3. However, when
analysing the ordinate distributions, it was noticed that only on the sandblasted surface are the distribution of the ordinates of the roughness profile close to normal distribution.
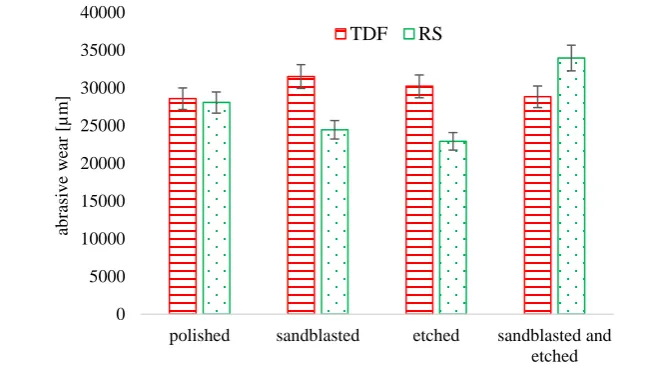
In the next stage, tribological tests were performed. Figure 5 shows the average friction coefficients and abrasive wear recorded during the tests in the technically dry friction conditions and in the conditions of friction with lubrication using the Ringer's solution.
a)
0.52
0.45 0.46 0.45
0.37 0.37 0.37 0.36
0 0.1 0.2 0.3 0.4 0.5 0.6 0.7 0.8 0.9 1
polished sandblasted etched sandblasted
and etched
co
ef
ficien
t
o
f
fr
ictio
n
b)
Figure 5. Coefficient of friction (a), abrasive wear (b).
The results of tribological tests revealed that the nature of the outer layer has little influence on the value of the coefficient of friction (µ). The values of the coefficients of friction were comparable for all tested samples. The value of µ parameter oscillated between 0.45-0.52 for technically dry friction and 0.36-0.37 for friction using a lubricant. The lowest coefficients of friction in all tests were obtained for sandblasted and etched specimens. The lubricant used reduced the resistance to motion in all the tested cases.
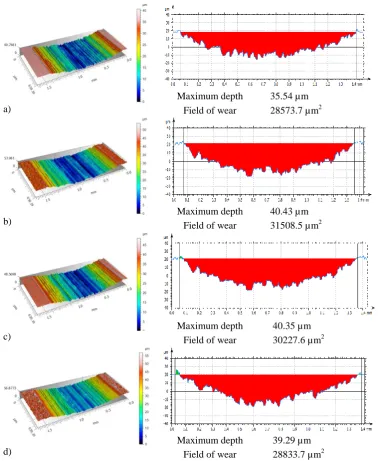
After the tribological tests were finished, the traces of wear were measured on the samples. The measure of consumption was the maximum depth and the surface area of the wear on the cross-section. Figures 6-7 show the isometric images and the wear profiles of the tested samples.
Tests performed with an optical profilometer revealed that both technically dry friction and friction using Ringer's solution as lubrication resulted in even wear of the surface layer. Analysis of the geometric structure after tribological tests carried out under technically dry friction conditions indicates that the material with the least wear in the friction pair with the aluminium oxide ball was polished titanium. The area of wear was about 10% smaller than the other discs. Tests using Ringer's solution have shown a reduction in wear in most cases. The best characteristics were obtained for the etched sample. The exception was the sandblasted and etched sample. For this sample, the lowest friction coefficients and a 15% increase in wear were recorded in comparison with technically dry friction. On the basis of friction tests, it was found that the best tribological characteristics were obtained for nanorough samples.
0 5000 10000 15000 20000 25000 30000 35000 40000
polished sandblasted etched sandblasted and
etched
ab
ra
siv
e
w
ea
r
[µm
]
a)
Maximum depth 35.54 µm
Field of wear 28573.7 µm2
b)
Maximum depth 40.43 µm Field of wear 31508.5 µm2
c)
Maximum depth 40.35 µm
Field of wear 30227.6 µm2
d)
Maximum depth 39.29 µm
[image:12.612.96.475.82.544.2]Field of wear 28833.7 µm2
a)
Maximum depth 41.39 µm
Field of wear 28055.0 µm2
b)
Maximum depth 37.00 µm
Field of wear 24447.1 µm2
c)
Maximum depth 35.71 µm
Field of wear 22928.3 µm2
d)
[image:13.612.97.471.82.545.2]Maximum depth 46.91 µm Field of wear 33960.8 µm2
Figure 7. The isometric image of the trace of wear and the wear profile in a cross-section on the conditions lubrication the Ringer's solution: a) polished, b) sandblasted, c) etched,
d) sandblasted and etched.
a) b)
[image:14.612.97.459.80.324.2]c) d)
Figure 8. The photo of the Ringer's solutions: a) polished, b) sandblasted, c) etched,
d) sandblasted and etched.
Figure 9. Medium contact angle of Ti6Al7Nb surfaces. 68.9
89.1
82.7
113.7
82.5 84.3
96.1
128.9
0 10 20 30 40 50 60 70 80 90 100 110 120 130 140 150
polished sandblasted etched sandblasted
and etched
co
n
tact
an
g
le
Measurements of surface wetting are extremely important when assessing the adhesion of cells to the implant surface. It is a well-known fact that the adhesion of cells decreases on hydrophobic surfaces and increases on hydrophilic surfaces [19-20]. The osseointegration mechanism starts when the implant gets in contact with the blood. To increase the implant surface area for human osteoblast adhesion, it is necessary to increase the surface wettability. Measurements of the contact angle confirmed the development of the geometric structure affecting wetting. The contact angle values presented in Figure 9 show that two of the four analysed samples are hydrophilic. The lowest contact angle values for all analysed liquids were observed on polished surfaces; they were about 20% lower in comparison with the remaining samples. In the case of surfaces after sandblasting and etching (with a very developed surface texture), the highest contact angle values were recorded for all applied measuring liquids. Therefore, the titanium alloy subjected to sandblasting and etching is characterized by the worst wetting.
CONCLUSIONS
REFERENCES
1. Kneć-Liber, A. and S. Łagan. 2014. “The Use of Contact Angle and the Surface Free Energy as the surface characteristics of the Polymers used in medicine”, Polim. Med, 1(44):29-37.
2. Bartolomeu, F., M.M. Costa, J.R. Gomes, N. Alves, C.S. Abreu, F.S. Silva, and G. Miranda. 2019. “Implant surface design for improved implant stability—A study on Ti6Al4V dense and cellular structures produced by Selective Laser Melting”, Tribology
International, 129:272-283.
3. Przybyszewska-Doroś, I., W. Okrój, and B. Walkowiak. 2005. “Surface modifications of metallic implants”, Engineering of Biomaterials, 43-44:52-62.
4. Madej, M. 2013. Properties of tribological systems with diamond-like carbon coatings. Kielce: Ed. TU.
5. Ozimina, D. and A. Ryniewicz. 2013. Exploitation of tribological systems. M48, tome I. Kielce: Wyd. PŚk.
6. Pawelec, K., M. Madej, P. Baranowicz, and J. Wysokińska-Miszczuk. 2018. “Influence of pH on the tribological properties of DLC- coated Ti-6Al-4V titanium alloy”, AIP
Conference Proceedings, 2017:020021.
7. Łukaszewska, M., P. Gajdus, W. Hędzelek, and R. Zagalak. 2009. “Development of titanium implants surface. Review”, Implantoprosthetics, X, 3:24-29.
8. Ganesh, B.K.C., N. Ramanaiah, and P.V. Chandrasekhar Rao. 2012. “Effect of Surface Treatment on Tribological Behavior of Ti-6Al-4V Implant Alloy”, Journal of Minerals
and Materials Characterization and Engineering”, 11:735-743.
9. Zasińska, K. 2017. “The influence of ion implantation on the selected utility properties of the Ti-13Nb-13Zr alloy in aspect of application on a friction elements in a hip joint endoprostheses”. PhD thesis, Gdańsk University of Technology.
10. Dąbrowski, R., J. Pacyna, and J. Kochańczyk. 2016. “The formation of microstructure and fracture toughness of Ti6Al7Nb alloy for biomedical applications“, Acta Bio-Optica
et Informatica Medica. Inżynieria Biomedyczna, 22(3):130-137.
11. Blumenthal, N.C, V. Cosma. 1989. “Inhibition of apatite formation by titanium and vanadium ions”, J Biomed Mater Res, 23:13-22.
12. Vandrovcová, M. and L. Bačáková. 2011. “Adhesion, Growth and Differentiation of Osteoblasts on Surface-Modified Materials Developed for Bone Implants”, Physiol Res, 60:403-417.
13. Łukaszewska-Kuska, M. 2013. “Evaluation of osteoblasts potential in the osseointegration process on variously modified titanium surfaces. In vitro studies”. PhD thesis, Poznań.
14. Nowacka, M. 2012. “Biomaterials for tissue engineering and regenerative medicine”,
Wiadomości Chemiczne, 66:911-933.
15. Piotrowska, K., M. Madej, P. Baranowicz, J. Wysokińska-Miszczuk, and M. Skóra. 2019. “The tribological properties of the Ti6Al4V alloy by nitrogen ions”, Bimonthly
Tribologia, 1:37-49.
16. Martini, D., M. Fini, M. Franchi, V.D. Pasquale, B. Bacchelli, M. Gamberini, A. Tinti, P. Taddei, G. Giavaresi, V. Ottani, M. Raspanti, S. Guizzardi, and A. Ruggeri. 2003. “Detachment of titanium and fluorohydroxyapatite particles in unloaded endosseous implants”, Biomaterials, 24:1309-1316.
17. Paszenda, Z. 1997. Shaping physicochemical properties of Co-Ni-Mo coronary stents for
applications in surgical cardiology. Gliwice: Silesian University of Technology.
18. Milewski, K., M. Madej, M. Niemczewska-Wójcik, and D. Ozimina. 2017. “Evaluation of the properties of diamond-like carboncoatings lubricated with ionic liquids”,
19. Roach, P., D. Eglin, K. Ronde, C.C. Perry, and J. Mater. 2007. “Modern biomaterials: a review—bulk properties and implications of surface modifications”, Sci.: Mater. Med., 18(7):1263-1277.