2019 International Conference on Computer Science, Communications and Big Data (CSCBD 2019) ISBN: 978-1-60595-626-8
Detection for Liquidus Temperature by Embedded System with
Data-density Algorithm
Lei WU
School of Information, North China Univ. of Tech., 100144. Beijing. China
Keywords: Embedded System, Data-density Algorithm, Liquidus Temperature, Complex Impurities System, Multi-component System, Low Molecular Ratio, Step-cooling Derivatives Method.
Abstract. Liquidus temperature (TL) of molten aluminum electrolyte accurately and reliably
identified is very difficult on-site when under such the cases: 1: molten aluminum electrolyte is a complex impurities system and multi-component system; 2: low molecular ratio of NaF/AlF3 (CR);
which implies there is small or no inflection point on the temperature curve and is very difficult and nearly impossible to identify the TL of molten aluminum electrolyte by both the step-cooling first
derivatives and step-cooling second derivatives methods with conventional equipment. To solve this challenging issue, we developed a concrete and feasibility measurement equipment with embedded system and a novel data-density algorithm to direct detection TL of molten aluminum electrolyte
on-site, which is total different from conventional off-line method with samples was measured indirect. A various of strictly experiments and tested in four big famous enterprises of China with six years over a wide range of furnaces with a varied of complex impurities system and multi-component system and derivation molecular ratios are carried out and the results some extent exhibit better performances than off-line setups in the respect of fast evaluation and determine the true TL.
Literature Review
In terms of data processing, regression analysis of statistical, differential thermal analysis (DTA) and step-cooling analysis are the main methods to identify TL. By published literature, the research
on TL of aluminum electrolyte is not too much. The measurement method to TL of aluminum
electrolyte can be divided into two types of off-line and on-line methods.
DTA has two types of on-line and off-line. DTA records the temperature difference between samples and neutral reference in the same temperature field at concurrent. The temperature difference is caused by phase transformation or other thermal effects and temperature of primary crystallization could be found and calculated by the difference of thermal events from the differential thermal curve. In 2011, Mr. Wang Xiangwen et al. of ALCOA developed and widely used STARprobeTM equipment in their company to directly measured and determined the TL on-line.
From literature, Mr. Wang Zhaowen et al. of Northeastern University in China in 2015 developed a device with DTA directly measured and determined the TL on-line.
Statics Method or Off-line Measuring
Regression Method on the Statistics. On the basis of analyzed carefully some core chemical compositions of aluminum electrolyte and a lot of data such as concentration, fractional weights, and occupied percent of some key compounds of aluminum electrolyte, and make use of regression method to establish empirical formula, TL is identified by the building empirical formula. Though
this kind of methods has been continuously appeared on literatures, the basic form of formulas is the same only have some slightly different. The empirical equations constructed by regression analysis method are essentially derived from statistical laws, rather than relying on causal laws. In other words, it is not possible to find strict cause-and-effect dependence, only statistical causality.
aluminum cell environment. As laboratory simulation furnaces can provide ample time to cooling down at the cooling rate below 0.5 °C/min, the temperature curve of aluminum electrolyte normally presents distinctive inflection point or plateau, which can be observed in the time-temperature trace with traditional step-cooling algorithm. However, its results could not be as authoritative datum but as provide theoretical guidance.
On-line Measuring Belongs to Dynamics Method and Main Includes:
Distance Measuring by Optical Pyrometer and Infra-red Radiation Instrument. Optical pyrometer and infra-red radiation temperature measurement instrument are all belong to non-contact measurement. As smelting aluminum electrolysis is a time-varying dynamic process that is affected by bath temperature, AlF3 concentration, and Al2O3 concentration et al, which make
it impossible to capture clearly and distinctly fixed TL by the mentioned instruments and these
instruments can only serve for research purposes and is inadequate for extensive industrial use at now.
Cry-O-Therm Superheat Sensor. Heraeus Electro-Nite provides the potline with instantaneous reading of TL with traditional step-cooling algorithm. Take into account the identify TL is a routine
and regulate task; the amount of sensors demanded is great. So, from commercial view that the sensor is high expenditure with disposable, which is the major obstacles and directly inference their setup employed and difficult to expanded to many aluminum smelt; and also difficult to meet the requirement of modern mass production. Another reason is, not all result of TL identified is desired
by step-cooling algorithm with Heraeus Electro-Nite.
Why Measure Liquidus Temperature Is So Difficulty?
The TL is one of the key parameters in the production of primary aluminum in the Hall-Héroult bath
and is also necessary and often unavailable or difficult on-line to determine from the molten aluminum electrolyte.
Strong Corrosion and High Temperature Make It Difficult to Obtain On-line Temperature Signal
Due to strong corrosion and high temperature around 900℃ of molten aluminum electrolyte, the crucible (such as stainless steel cup) of sensor nearly ruin as soon as the crucible insert into the cell to measurement temperature signal, which is one of the major obstacles or the main reason to pick up the temperature data at potroom. That means, correctly and accurately obtain temperature data before molten aluminium electrolyte immediately solidification during stainless steel crucible drawn off from the pot and hung over the hole of pot is a difficulty issue. So, under industrial conditions, it is urgent and important to capture data from the cell of molten aluminum electrolyte with strong corrosion and high temperature as quickly as possible by dynamic and on-line. At the moment, there are not availability and readily about the perfect and adequate crucible and processor.
Complex Impurities, Multi-component System and Low Molecular Ratio Reduce Small or No Inflection Point on the Temperature Curve of Molten Aluminum Electrolyte
Another major obstacles or main reason is the complex impurities, multi-component system and low molecular ratio of NaF/AlF3 (CR) of molten aluminium electrolyte composition, which directly
reduce inflection point small or no on the temperature curve of molten aluminium electrolyte. At this situation, it is very difficult and nearly impossible to identify the TL of molten aluminium
electrolyte by the conventional step-cooling first derivatives and step-cooling second derivatives methods.
Phenomenon of Undercooling
present on the temperature curve. In principle, TL is a point or platform where molten aluminium
electrolyte begins to gradate solidify from molten state into solid state or undergoes isothermal phase transformation, which corresponding to release latent heat. When the cooling rate is increased, the driving force for phase transformation is quickly and the release speed of internal energy or latent heat and exothermic reactions can’t catch up the cooling rate, that means the aluminum electrolyte does not released enough heat to compensate the quickly lost heat, the incubation period of saddle-point or plateau of temperature curve is shortened largely and sometimes even disappearance. Cooling rate is bigger than the maximum of crystallization rate or cooling is overshoot (undercooling) those generally suppress saddle-point or inflection point (even no platform and plateau) appearing on the temperature curve of aluminum electrolyte. Cooling process that is faster than the critical cooling rate may not provide a good estimate of behavior of saddle-point or plateau of aluminum electrolyte.
On the contrary, when the cooling rate of the aluminum electrolysis is slowly and crystalizing with a great of heat releasing, a platform or plateau (an obvious change in temperature), inflection point or a turning point (a distinct change in temperature) will appear on the temperature curve of molten aluminium electrolyte.
In words, the TL on the temperature curve is distinctive associated with the cooling rate and
undercooling heavily hinder the TL of aluminum electrolyte to be obtained directly on-line at
potroom.
Embedded System for Identify TL of Molten Aluminum Electrolyte
System Architecture with Embedded System. Our system consists of a temperature data acquisition system as front end, embedded system as human-computer interaction system, which employing the architecture of ARM + FPGA, tightly coupled with battery board to supply power to the other module, and various input/output interfaces. The FPGA is the type of XC3S250E from
Xilinx company and the powerful ARM processor is the type of EP9315 by CIRRCE company. The block diagram of system architecture is shown in Figure 1.
As we know, the faster the collect and process data, the power to distinguish the difference of temperature data at different area. Under normal condition, one data to be sampled interval is 10 ms and the whole sample time is about five minutes. That means the rate of sampling is 100 samples/second, in the course of measurement time, the total data can be counted by the follow equation: SDATA = 100*60*5 = 300 000. That is, all the measured data are transferred to the
signal conditioning module A/D converter battery valtage conditioning module DC/DC module p o w e r s u p p ly power supply interface measure workplace temperature FPGA FIFO FIFO Logic function
pick-up & A/D board battery board communicati on module LCD module Nand Flash key panel interface ARM core board audio module CF interface E P 9 3 1 5 b a c k m o d u le charge & discharge safeguard module input thermocouple signal battery ADS 1274 EP9315 relay LED indicator ADS1274 control module
EP9315 logic signal control
data_store
[image:4.595.78.523.73.270.2]EP9315 logic control FIFO FIFO clk_5m clk_25m sync drdy dout1 cpu_a(15:0) drv_cpu_d(15:0) cpu_int1 cpu_int2 cpu_nrd cpu_nwr cpu_ncs1 cpu_ncs2 gain_swith
Figure 1. System architecture. Figure 2. ARM communicates with FPGA through SPI bus.
FPGA Architecture and Functions. In the accompanying block diagram of Figure 2 shows the overall functional structure of FPGA circuit. FPGA responds to receive control signals from ARM, sends logic control signals to peripheral interfaces and sends interrupt request signal to ARM for transmit received data, from A/D module, hold them in FPGA buffer area. ARM as the main controller manages FPGA and peripheral expansion interface. The use of FPGA to build the interconnection module not only offers low cost and simple architecture, but also provides many more advantages. First, interconnections can be changed dynamically through internal logic modification and physical-assignment to the FPGA. Second, as FPGA is connected with most pins from the embedded processor, it is feasible to detect interconnection problems due to design or physical fabricate fault in the minimal system with BST (Boundary-Scan Test). Third, it is possible to route the FPGA internal signals and data to the FPGA's I/O pins for quick and easy access without affecting the whole system design and performance. It is even possible to implement an embedded logical analyzer into the FPGA to smooth the progress of the hardware verification and software development.
Data Density and Data Processing
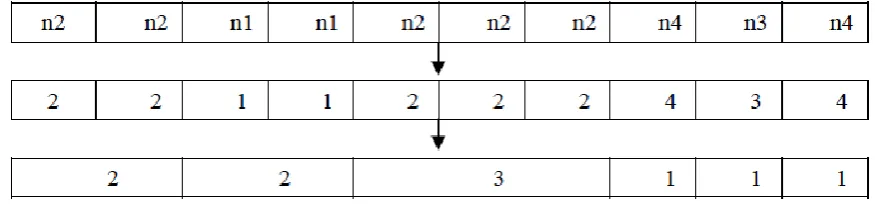
[image:4.595.78.516.629.733.2]In order to understand the concept of data-density, firstly we bring a simple example to introduction. For example: there exist ten raw datum, such as: 2.1, 2.3, 1.2, 0.8, 2.4, 1.9, 2.4, 3.5, 3.3 and 4.2. Rounded to decimal places to deal with the raw datum of ten data, the dataset will cover new data of 2, 2, 1, 1, 2, 2, 2, 4, 3 and 4 respectively. After rounding, the identical data distributed at different area will be rearranged at different group, only the identical data near to each others can be rearranged at the same group, that means the data density of the above dataset is three about 2 at the fifth position, but not five about 2 at the first position, the flow chart is shown at figure 3.
Figure 3. The flow chart about data grouped into identical set.
aluminum electrolyte. According to the concept of data-density, when we investigate and watch at carefully the temperature curve of aluminum electrolyte, it turned out to identify difference in data-density at temperature curve, even the temperature curve is smooth.
Liquids Identified by Data-density at Potroom
Extensive and varied strictly experiments and tests over a wide range of aluminum production cells are carried out in order to validate the performance of accuracy and reproducibility of our setups and data-density algorithm for identified TL during production process in four big famous
enterprises of China with six years, and the results some extent exhibit better performances than off-line apparatus and step-cooling algorithm in the respect of fast evaluation and determine the true
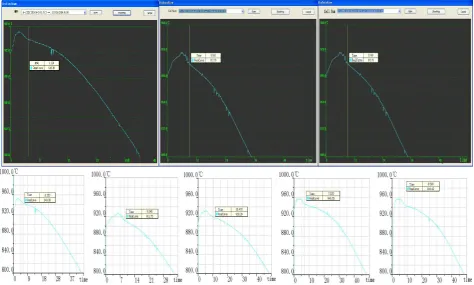
TL. TL identified by data-density algorithm and temperature-time trace in the real on-site production
[image:5.595.60.535.255.540.2]cells at Hall-Héroult cells with 160KA at top and 300KA with another version at bottom of Figure 4 to are respectively shown.
Figure 4. liquids identified at two different types of production cells.
Conclusions
After verification experiments and test on-site that demonstrate the embedded system with data-density algorithm to identify TL is applicable to aluminum electrolyte production daily.
Experimental results indicated that the accurate level of the proposed data-density method can achieve to deviate ±2℃ to detection of TL. In addition, data-density algorithm can make up for the
defect of conventional step-cooling discrete algorithms, thus improving the prediction accuracy. In a word, data-density algorithm is a much quicker and more concise algorithm with respect to the conventional step-cooling algorithm can then be identified precisely.
Acknowledgments
References
[1] Di Yuezhong, et al., Liquidus Temperatures of Na3AlF6-AlF3-CaF2-KF-LiF-Al203, MELTS,
Light Metals 2013, 681-684.
[2] Dong Shi, et al., Liquidus Temperature of Electrolytes for Aluminum Reduction Cells, MELTS, Light Metals 2013, 701-704.
[3] Apisarov, et al., Liquidus Temperatures of Cryolite Melts with Low Cryolite Ratio, Metall. Mater. Trans B, 2011, 42B, 236-242.
[4] B.L. Gao, et al., Liquidus Temperatures of Na3AlF6-AlF3-CaF2-KF-LiF-Al203, Melts, J. Chem.
Eng. Data, 2010, 55, 5214-5215.
[5] Xiangwen Wang, Bob Hosler, Gary Tarcy, Alcoa STARprobe, Light Metals 2011, TMS2011, 483-489.
[6] Xiangwen Wang, Gary Tarcy, Eliezer Batista, Geff Wood., Active pot control using alcoa starprobe, Light Metals 2011, TMS2011, 491-496.
[7] Wang Jiawei, et al. Temperature of primary crystallization in party of system Na3AlF6-K3AlF6-
AlF3 [C].Light Metals 2008.p513
[8] A. Sterten and O. Skar. Some binary Na3AlF6-MxOy phase diagrams. Aluminum, 1988,
64(10):1051-1054.
[9] Rolseth S. Verstreken P. Kobbeltvedt O., Liquidus temperature determination in the molten salts [C].Warrendale: Minerals, Metals & Materials Soc, 1998.
[10] Kan Hongmin.et al. Liquidus temperature, density and electrical conductivity of low temperature electrolyte for aluminum electrolysis [C].Light Metals 2007, p. 531.
[11] A.Rostm,et al. Phase Diagram Data in System Na3AlF6-Li3AlF6-AlF3-Al2O3 Part I : Liquidus
Temperatures for Primary Cryolite Crystallization. Light Metals, 1990:311-316.
[12] A. Solheim, Å. Sterten et al., Liquidus Temperature and Alumina Solubility in the System Na3AlF6 - AlF3 - LIF-CaF2-MgF2, Light Metals 1995, 451 - 460, eq.4
[13] W. Haupin, The Liquidus Enigma, Light Metals 1992, 477-480.
[14] P. Verstreken and S. Benninghoff, Bath and Liquidus Temperature Sensor for Molten Salts, Light Metals 1996, 437-444.
[15] O. Kobbeltweld, S. Rolseth and P. Verstreken, Liquidus Probe for Hall-Héroult Baths, Ninth International Symposium on Light Metals Production 1997, 157-167.
[16] P. Verstreken, Employing a New Bath and Liquidus-Temperature Sensor for Molten Salts, JOM, Volume 49, Number 11, 1997, 4346.