Quantitative Evaluation of Human Body
Surface Modeling Methodology
Matthew P. Reed
Byoung-Keon Park
Biosciences Group
University of Michigan Transportation Research Institute
February 2017
Quantitative Evaluation of Human Body Surface Modeling Methodology
Final Report
UMTRI-2017-5
by
Matthew P. Reed Byoung-Keon Park
REPORT DOCUMENTATION PAGE
OMB No. 0704-0188 Form ApprovedPublic reporting burden for this collection of information is estimated to average 1 hour per response, including the time for reviewing instructions, searching existing data sources, gathering and maintaining the data needed, and completing and reviewing this collection of information. Send comments regarding this burden estimate or any other aspect of this collection of information, including suggestions for reducing this burden to Department of Defense, Washington Headquarters Services, Directorate for Information Operations and Reports (0704-0188), 1215 Jefferson Davis Highway, Suite 1204, Arlington, VA 22202-4302. Respondents should be aware that notwithstanding any other provision of law, no person shall be subject to any penalty for failing to comply with a collection of information if it does not display a currently valid OMB control number. PLEASE DO NOT RETURN YOUR FORM TO THE ABOVE ADDRESS.
1. REPORT DATE (DD-MM-YYYY)
February 2017 2. REPORT TYPEFinal Report 3. DATES COVERED (From - To)
4. TITLE AND SUBTITLE 5a. CONTRACT NUMBER
W56HZV-04-2-0001 P00038 Quantitative Evaluation of Human Body Surface Modeling
Methodology
5b. GRANT NUMBER
5c. PROGRAM ELEMENT NUMBER
6. AUTHOR(S) 5d. PROJECT NUMBER
Reed, M. P. and Park, B-K 5e. TASK NUMBER
5f. WORK UNIT NUMBER
7. PERFORMING ORGANIZATION NAME(S) AND ADDRESS(ES)
AND ADDRESS(ES)
8. PERFORMING ORGANIZATION REPORT
NUMBER
University of Michigan
Transportation Research Institute UMTRI-2017-5
9. SPONSORING / MONITORING AGENCY NAME(S) AND ADDRESS(ES) 10. SPONSOR/MONITOR’S ACRONYM(S)
US Army Natick Soldier Research Center
Natick, MA 11. SPONSOR/MONITOR’S REPORT
NUMBER(S)
Issued Upon Submission 12. DISTRIBUTION / AVAILABILITY STATEMENT
13. SUPPLEMENTARY NOTES
14. ABSTRACT
This project addressed a range of issues relating to the measurement and modeling of three-dimensional body shape. Two metrics were devised for comparing two body shapes represented by surface meshes. The distance from the nodes of one mesh to the polygonal surface of another was defined as mesh error. Six torso dimensions computed between mesh nodes that are analogous to standard anthropometric measures were compared to compute mesh error. Analyses were performed using three datasets: 236 male Soldiers, 200 Air Crew, and 73 civilian women. Statistical body shape models (SBSM) were developed using methods developed and adapted in previous UMTRI research. A standardized template was fit to each scan to enable the analysis. Mesh error was found to diminish smoothly with the number of PCs used for
reconstruction, with minimal improvement after 100 PCs. When conducting regression predictions, retaining more than 80 PCs provided minimal improvement in mesh or dimension error metrics. A simulation study demonstrated that improvements in
regression model performance when using more than 50 subjects were small. Errors in predicting Air Crew torso mesh dimensions using 10 standard anthropometric
variables averaged less than 10 mm. A novel method was developed to predict seated body shape from standing body shape, and a new inscribed fitting method enabled generation of accurate avatars from scans of individuals wearing clothing and gear. A pilot test demonstrated the potential for scanning prone individuals using a transparent table to obtain good coverage.
15. SUBJECT TERMS
Anthropometry, Body Shape
16. SECURITY CLASSIFICATION OF: 17. LIMITATION OF ABSTRACT
18. NUMBER OF PAGES
19a. NAME OF RESPONSIBLE PERSON M.P. Reed
ACKNOWLEDGMENTS
CONTENTS
EXECUTIVE SUMMARY 6
INTRODUCTION 8
METHODS 9
RESULTS 13
DISCUSSION 41
EXECUTIVE SUMMARY
This project addressed a range of issues relating to the measurement and modeling of three-dimensional body shape. Two metrics were devised for comparing two body shapes represented by surface meshes. The distance from the nodes of one mesh to the polygonal surface of another was defined as mesh error. Six torso dimensions computed between mesh nodes that are analogous to standard anthropometric measures were compared to compute mesh error. Analyses were performed using three datasets: 236 male Soldiers, 200 Air Crew, and 73 civilian women. Statistical body shape models (SBSM) were developed using methods developed and adapted in previous UMTRI research. A standardized template was fit to each scan to enable the analysis.
Using the Soldier data, an evaluation of reconstruction error showed only minor
improvements in mesh error when using more than 100 PCs, with a smooth trend toward reductions in mesh error statistics as more PCs were included. In contrast, the reduction in variance in torso dimension discrepancies with increasing numbers of PCs retained was not smooth, with occasional increases as more PCs were added. This finding reflects the fact that each PC affects each mesh vertex in a different way. However,
approximately 90% of reconstruction dimension errors were less than 10 mm when using 80 or more PCs.
Regression was used to predict body shape as a function of stature, body mass index, and the ratio of sitting height to stature, or with these three variables plus 7 additional body segment lengths and circumferences. With three variables, mean mesh errors were approximately 6 mm regardless of the number of PCs used from 50 to 200. Adding 7 additional predictors reduced the mean and 95th-percentile mesh errors by only a few mm, indicating that most of the variance in body shape was accounted for by three predictors. Importantly, the mesh error for body shapes predicted by regression was not significantly related to any standard anthropometric variables.
A novel method was developed to predict body shape in one posture from an SBSM developed for another posture. Data from women measured in both postures of interest were analyzed to generate separate SBSMs. The principal component scores from the standing posture were used to predict principal component scores for a seated posture using linear regression. The resulting reconstructions showed excellent predictive ability within the population used to generate the model, with the remaining discrepancies due to posture differences across individuals in the seated posture. This method has considerable potential for generalizing scan datasets that have only a few postures using relationships learned from richer datasets.
In many environments, gather body shape data from individuals in a minimally clad condition is not practical. Moreover, both the individuals’ body shapes and the space taken up by their clothing and gear is of interest. A new method termed inscribed fitting was developed to fit an SBSM within the shell created by scanning an
individual wearing clothing, body armor, or other gear. The method is capable both of generating a reasonably accurate avatar of the scanned individual as well as a map of the spatial margin of the clothing and gear. This method has considerable utility for building subject-specific avatars of individuals participating in human factors evaluations and for building functional models of clothing and gear that can be applied to other avatars.
INTRODUCTION
Advances in three-dimensional (3D) surface measurement technology have revolutionized anthropometry and enabled a new generation of body shape
modeling tools. Applications of these tools have included the design and evaluation of protective equipment (Hsaio et al. 2003), seats and chairs (Parkinson and Reed 2008), and vehicles (Reed and Ebert 2013). Most body shape modeling has the goal of generating realistic human forms from a small number of input parameters, typically overall descriptors such as sex, stature, and body weight. The input data is usually a set of surface scans obtained from laser scanners, although measurement technologies now include a range of scanning methods (Park et al. 2014). The first statistical whole-body shape model in the digital human modeling literature was published in 2004, drawing on data from the US CAESAR project (Allen et al. 2003, Allen et al. 2004). Since then, several different research groups have published models based on a variety of analysis methodologies (Loper et al. 2015, Pishchulin et al. 2015). However, some basic questions concerning the performance of these models and the choices made in their development have remained unanswered.
The goal of the current work is to explore a range of questions related to statistical body shape model development for both minimally clad and clothed figures, including those wearing protective equipment and gear. The specific objectives were:
1. Develop a set of valid, practical, and effective accuracy and precision metrics for human body shape modeling.
2. Quantify the advantages and disadvantages of alternative modeling
approaches using the newly defined metrics.
3. Develop and evaluate methods for assessing the accuracy of extending a
body shape model to a new population.
4. Develop and validate methods for predicting seated body shape from
METHODS
Data Sources
Male Soldiers
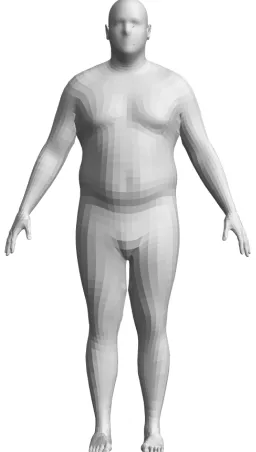
[image:9.595.235.363.225.451.2]The data used for the current analysis were gathered in the Seated Soldier Study (Reed and Ebert 2013a). Laser scans obtained in a standing pose were used for the current analysis (Figure 1). A total of 236 scans from men with a wide range of body size were used.
Figure 1. Standing pose used for scans with male Soldiers and Air Crew. Polygons of the template mesh are visible in the image.
Male Air Crew
Figure 2. Weight by stature for male Soldiers (o) and Air Crew (+). Lines indicate 5th, 50th, and 95th percentiles for Soldiers (—) and Air Crew (+).
Table 1
Summary Statistics for Anthropometric Measures of Male Soldier and Air Crew Samples
Measure Mean SD 5th%ile 50th%ile 95th%ile
Soldier (N=236)
Stature (mm) 1754 67 1652 1755 1866
Weight (kg) 82.9 13.6 63.5 82.5 107.7
BMI (kg/m2) 26.9 3.9 21.1 26.9 34.1
Sitting Height (mm) 917 34 862 919 977
SH/S* 0.523 0.015 0.497 0.523 0.546
[image:10.595.80.518.411.642.2]weighted toward older adults (Reed and Ebert 2013b). Table 2 shows the distribution of selected anthropometric variables for this population.
Table 2
Summary Statistics for Anthropometric Measures of Female Civilian Sample
Measure Mean SD 5th%ile 50th%ile 95th%ile
Stature (mm) 1600 70.2 1470 1595 1725
Weight (kg) 68.3 13.6 49.3 65.9 99.9
BMI (kg/m2) 26.7 4.9 19.2 26 34.3
Sitting Height (mm) 840 41.2 769 838 906
SH/S* 0.524 0.016 0.504 0.526 0.552
Age (yr) 61.9 17.4033 23.2 66.7 84.8
* Sitting height/stature.
Scan Data Processing
Scans were cleaned to remove extraneous data points, such as those on the standing surface, and surface landmarks were digitized using Meshlab v1.3.1 (Cignoni et al. 2009). Meshlab was also used to fill holes, using Poisson surface reconstruction (filter settings: OctDepth=8, SolverDivide=6, SamplesPerNode=1,Offset=1) and to decimate to 75k vertices.
Template Fitting
To enable statistical analysis, a standardized template was fit to each processed scan using methods developed in previous UMTRI research. The process, which is
described in detail in Park and Reed (2015), is as follows:
1. Scans are aligned to a common reference point on the ground plane on the midline of the body.
2. The template is approximately scaled and aligned to the body. This step is
facilitated by using a previously generated body shape model and the “PC fitting” methodology described in Results section 5.
3. The mesh is morphed to align a set of surface landmarks with the scan using a three-dimensional interpolation method based on radial basis functions (RBF).
Scans from Soldiers and Air Crew were fit using the same template. This mesh, developed at UMTRI, is symmetrical and has a resolution optimized for fitting
whole-body data. The scans used for the standing-to-seated prediction were fit prior to the development of the symmetrical template using earlier versions that are asymmetrical and lack details for hands and feet.
PCA and Regression (PCAR)
The body shape analysis methods followed procedures used in many previous body shape studies at UMTRI and elsewhere (Reed and Parkinson 2008, Park and Reed 2015, Park et al. 2016).
1. A geometry vector was obtained for each subject by concatenating standard
anthropometric variables, the coordinates of body surface landmarks, and the coordinates of the surface mesh vertices.
2. PCA was conducted on the geometry matrix. For the current work, a method
from Turk and Pentland (1991) that computes a number of PCs equivalent to the number of subjects was used. The PCs and PC scores therefore contain sufficient information to exactly reconstruct the original data.
3. Regression analyses were conducted to predict PC scores using two sets of
predictors. The full set, selected in previous work to provide a parsimonious description of body shape (Reed et al. 2014), is stature, BMI, erect sitting height/stature, knee height sitting, head circumference, chest circumference, waist circumference at omphalion, maximum hip circumference, and age. For some analyses, the first three variables were used to predict the
RESULTS
The sections below present the methods and results specific to addressing each project objective.
1. ERROR METRICS
Body shape models are used to assess fit, clearance, and other spatial factors relating to human accommodation and performance. Consequently, the most important measures of model performance relate to spatial accuracy and precision. Any particular analysis may use a different aspect of the model. For example, an analysis of body armor might focus on the torso shape, while face shape would be more important for the design of protective masks. For the current analyses, we chose two types of measures:
1. Surface correspondence – The distance between the nodes of a predicted shape from the symmetric template fit to the scan data were computed. The closest point on the mesh is obtained, whether within a polygon or on an edge. The mean, standard deviation, and several quantiles of the unsigned distances between the meshes were computed. The calculation was
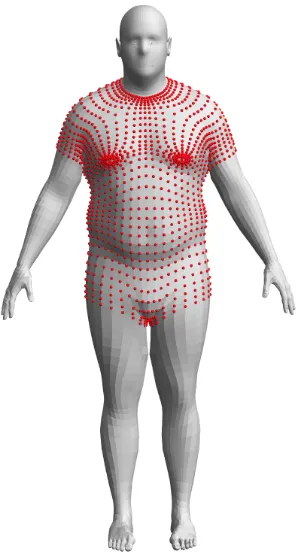
performed only for 1940 node points on or near the torso (see Figure 3) to reduce the effects of posture variability in the extremities on accuracy
assessment. Prior to assessing the correspondence, the predicted torso nodes were aligned to the comparison mesh using a two-step process. The mean node location was aligned, and then the predicted mesh was rotated so that the 3 principal components of the node coordinates from the two meshes were identical. This focuses the comparison on the size and shape of the torso independent of discrepancies of location or orientation.
2. Dimension analysis – Many analyses using SBSM are focused on particular dimensions that can be extracted from the predicted body shapes.
Performance on linear dimensions may be more important for these analyses than the overall surface correspondence. Hence, several linear dimensions intended to be surrogates for this type of measure were defined and used for performance evaluation. Specifically, the torso breadth and depth
(horizontal) were computed at approximately the heights of the
Figure 3. Torso points used for surface correspondence evaluations.
2. ALTERNATIVE MODELING APPROACHES
Effects of Number of PCs Used for Reconstruction
Figure 4. Fraction of variance accounted for by PCs in the Soldier PCA.
To examine this factor, the reconstruction error, quantified as the distance between the reconstructed and original mesh, was calculated across all 236 Soldiers for number of PCs ranging from 20 to 200. Figure 5 shows quantiles of the unsigned distance metrics. The median error is below 4 mm for all subjects with 50 PCs and below 2 mm with 80 PCs. Figure 6 shows the 95th percentile error within subject. At
50 and 80 PCs the median 95th-percentile errors are below 12 and 8 mm,
respectively.
[image:15.595.88.475.414.619.2]Figure 6. Effects of number of retained PCs on quantiles (across subjects) of 95th percentile
(within subject) mesh reconstruction error. Quantiles 0.05, 0.1, 0.25, 0.5, 0.75, 0.9, and 0.95 are shown.
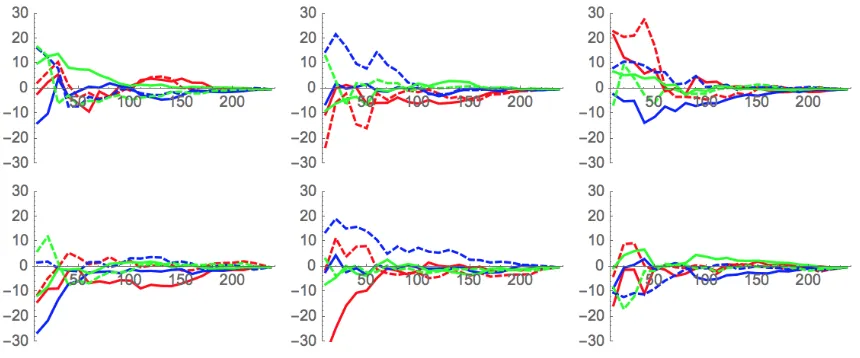
[image:16.595.102.484.447.664.2]Figure 8 shows the difference in dimensions between the reconstructed and original meshes with the number of PCs retained between 20 and 220 for six subjects.
Figure 9 shows the aggregate of all 236 subjects. The dimensions do not vary smoothly with the number of PCs used for reconstruction, and the pattern of
reconstruction error across dimensions varies across subjects. At all numbers of PCs retained, the mean error is zero across the population. Table 3 lists the error
standard deviations for each variable across a range of the number of PCs used. Approximately 90% of errors are less than 10 mm for these dimensions when 80 or more PCs are used for reconstruction.
Figure 9. Aggregate dimension errors (mm) by the number of PCs used for reconstruction. Lines show 5th and 95th percentiles (red), 10th and 90th percentiles (green) and 25th and 75th percentiles across subjects.
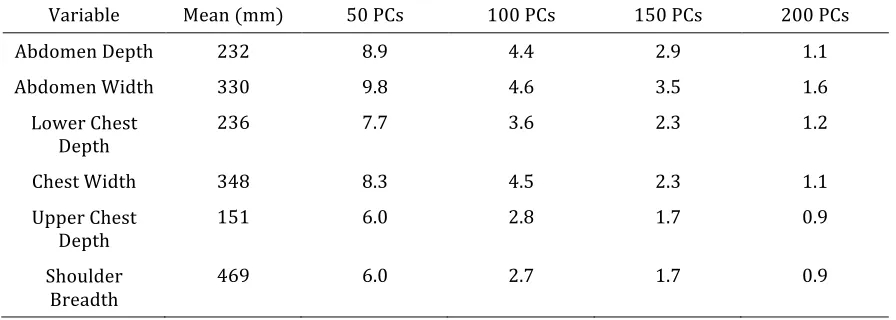
Table 3
Dimension Residual Errors for Reconstruction (SD in mm)
Variable Mean (mm) 50 PCs 100 PCs 150 PCs 200 PCs
Abdomen Depth 232 8.9 4.4 2.9 1.1
Abdomen Width 330 9.8 4.6 3.5 1.6
Lower Chest Depth
236 7.7 3.6 2.3 1.2
Chest Width 348 8.3 4.5 2.3 1.1
Upper Chest Depth
151 6.0 2.8 1.7 0.9
Shoulder Breadth
[image:18.595.75.523.389.549.2]assess regression model performance, such as significance tests on parameter estimates and analysis of residuals, are not very useful for this application because the dependent measure for each regression is a PC score, rather than an outcome of direct interest. Moreover, the goal is not to test whether particular variables have “significant” effects on the outcome, but rather to make predictions. The residuals of interest are the discrepancies between the predicted and measured body shapes.
Table 4 shows the distribution of mesh error across all subjects for prediction of body shape from three variables: stature, BMI, and ratio of sitting height to stature (SH/S). The predicted body shape was reconstructed using from 50 to 236 (all) PCs. Surprisingly, the errors increase slightly when more PCs are used for
[image:19.595.101.496.345.449.2]reconstruction. This is thought to be due to idiosyncrasies in the mesh that are related to other body dimensions that are introduced when including more PCs. However, the increase in errors is small from 50 to 150 PCs and is stable when more PCs are added.
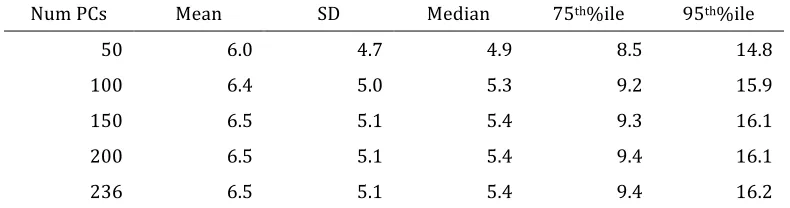
Table 4
Mesh Errors (mm) for 3-Variable Regression by the Number of PCs Used for Reconstruction (mean across all subjects)
Num PCs Mean SD Median 75th%ile 95th%ile
50 6.0 4.7 4.9 8.5 14.8
100 6.4 5.0 5.3 9.2 15.9
150 6.5 5.1 5.4 9.3 16.1
200 6.5 5.1 5.4 9.4 16.1
236 6.5 5.1 5.4 9.4 16.2
Effects of the Number of Anthropometric Predictors
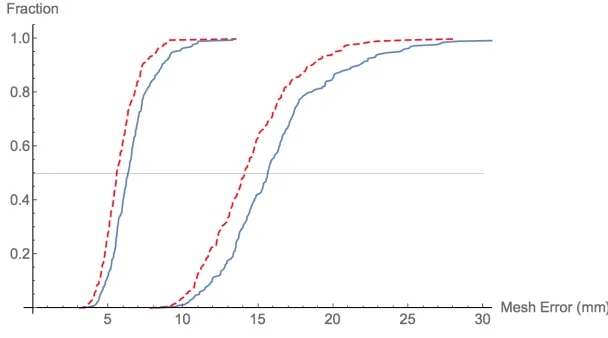
Using more variables can be expected to improve prediction. Figure 10 shows the cumulative (across subjects) mean and 95th-percentile mesh error for the full
regression with 10 predictors and the reduced regression with three predictors. Using additional predictors reduces the error only slightly relative to the
distribution across subjects. The median 95th-percentile error with 10 predictors is
Figure 10. Distribution of mean (left curve) and 95th-percentile (right curves) mesh error across subjects for regressions with three variables (solid lines) and 10 variables (dashed lines).
[image:20.595.151.445.346.501.2]The regression errors are not strongly related to any anthropometric variables. Figure 11 shows the mean error for the three-variable regression as a function of BMI, which showed the strongest trend.
Figure 11. Mean mesh error for the three-variable regression as a function of body mass index.
variance in node locations, the regression prediction precision is not meaningfully affected by using 50 rather than 236 PCs. This is particularly true for the three-variable regression, where the RMSE values are identical to three significant figures.
Table 5
Dimension Residual Errors from Regression (SD in mm) using All or 50 PCs for Reconstruction
Variable Three Variables Ten Variables
RMSE (All PCs) RMSE (50 PCs) R2 Adjusted* RMSE (All PCs) RMSE (50 PCs) R2 Adjusted*
Abdomen Depth 15.2 15.2 0.77 10.7 10.8 0.88
Abdomen Width 15.9 15.9 0.79 9.1 9.9 0.93
Lower Chest Depth
14.8 14.8 0.77 11.7 11.9 0.85
Chest Width 14.8 14.8 0.80 10.6 10.7 0.89
Upper Chest
Depth 8.4 8.4 0.63 7.7 7.8 0.67
Shoulder Breadth
18.8 18.8 0.40 13.0 13.1 0.70
* Obtained from linear model predicting dimensions directly; equivalent to all-PC calculation.
Effects of Number of Subjects
One consideration in the development of body shape models is how many subjects are needed to achieve a desired level of prediction performance. To address this issue, the Soldier and Air Crew data were combined to form a single population of 436 men. Sets of 50 PCAR models were created using N = 50, 100, 150, or 200 subjects sampled randomly. The performance with respect to mesh error was evaluated for each model by comparing assessing predictions for 20 subjects not included in the models. Predictions were based on 10 anthropometric variables. Table 6 shows the results for each level of N across models and subjects.
The values are slightly larger than the reconstruction error alone within the Soldier model. Only small improvements in mesh error are seen with increasing numbers of subjects. For example, the average 95th%ile mesh error is reduced from 16.9 to
Table 6
Mesh Errors (mm) for 10-Variable Regression Evaluated for 20 Subjects Not Included in the Model (average of 50 models at each number of PCs)
Num PCs Mean* SD 50th%ile 75th%ile 95th%ile 50 6.8 (1.6) 5.3 (1.2) 5.6 (1.5) 9.7 (2.4) 16.9 (4.1) 100 6.3 (1.5) 4.9 (1.1) 5.3 (1.4) 9.1 (2.2) 15.8 (3.7) 150 6.1 (1.4) 4.8 (1.0 5.0 (1.4) 8.7 (2.1) 15.2 (3.3) 200 6.0 (1.3) 4.7 (1.1) 5.0 (1.2) 8.5 (1.9) 14.9(3.3) * Values in parentheses are SDs across 50 models.
A similar analysis can be conducted using torso dimensions as the dependent measures. Model performance for predicting the six torso dimensions used above was evaluated using 100 subjects randomly selected from among those not used for the model construction. This procedure was repeated 50 times for each value of N, for a total of 200 PCAR models. In each case, all PCs (N) were retained. The
regression was performed using all 10 anthropometric variables.
Table 7 lists the means and standard deviations of dimension errors across 50 models for each variable and value of N. On average, the models were unbiased, as expected. The SD of the mean (bias) was generally under 2 mm even with only 50 subjects. The residual error standard deviation was only slightly improved by going from 50 to 200 subjects. Within each set of 50 models, the SD of the SD was
Table 7
Effects of the Number of Subjects (N) on Model Prediction of Torso Dimensions Across 50 Models at each Level of N (mm)
N Dimension* Mean SD of Mean Mean SD SD of SD
50 1 0.3 2.6 13.4 1.2
2 -0.3 1.9 10.8 0.9
3 0.3 1.9 13.5 1.2
4 0.2 1.9 12.9 1.1
5 -0.1 1.9 9.9 0.8
6 -0.1 2.6 13.6 1.5
100 1 0.1 1.3 12.3 0.8
2 0.1 1.6 10.0 0.8
3 0.2 1.7 12.5 0.7
4 0.0 1.9 12.0 0.9
5 0.1 1.5 9.5 0.7
6 0.2 1.5 12.9 1.1
150 1 0.2 1.6 12.1 0.7
2 -0.3 1.2 9.9 0.8
3 -0.3 1.5 12.2 0.8
4 -0.1 1.1 11.8 0.7
5 -0.3 1.1 9.1 0.6
6 0.1 1.5 12.6 0.8
200 1 0.1 1.3 11.8 0.8
2 -0.2 1.2 9.7 0.6
3 0.1 1.5 12.3 0.8
4 -0.1 1.5 11.6 0.7
5 0.1 1.1 9.1 0.5
6 0.1 1.5 12.6 0.7
3. EXTENDING PREDICTIONS TO NEW POPULATIONS
A body shape model will usually be used to predict body shapes for individuals who are not in the original dataset. To assess this aspect performance, the Soldier model was used to predict body shapes in the Air Crew dataset. The three- and ten-variable regression models were used to predict body shapes and the dimension variables were analyzed.
[image:24.595.77.523.407.682.2]The three-variable model showed bias (mean difference in predicted vs. observed dimensions) similar to the mean difference in dimensions between the populations, although this is believed to be coincidental (see below). The residual SDs are similar to those observed in the Soldier dataset, indicating that the precision for predicting dimensions in the Air Crew dataset is similar to the precision in the dataset used to create the model. In all cases the mean errors are less than one standard deviation of the residual. As was the case within the Soldier dataset, dimension prediction errors were essentially unaffected by reconstructing with all rather than 50 PCs, but using 10 rather than 3 predictive variables improved performance, reducing both bias and residual variance.
Table 8
Dimension Residual Errors* (mm) using Soldier Regression to Predict Air Crew Dimensions using All or 50 PCs for Reconstruction
Variable Mean Difference
Between Populations
(AC-Soldier)
Three Variables Ten Variables Mean Error (All PCs) SD (All PCs) Mean Error (50 PCs) SD (50 PCs) Mean Error (All PCs) SD (All PCs) Mean Error (50 PCs) SD (50 PCs) Abdomen Depth
11.3 12.2 15.6 12.1 15.7 6.3 11.7 7.2 11.9
Abdomen Width
3.7 2.9 15.7 2.8 15.7 3.7 10.0 1.5 10.2
The regression model based on Soldier data consistently predicted torso dimensions that were larger, on average, than those measured on the Air Crew scan fits, even when using 10 variables. This bias observed in the model predictions appears to be due to the fact that the relationships between standard anthropometric measures and mesh dimensions are different in the two datasets. Figure 12 shows that the mesh abdomen depth measure is larger in the Air Crew dataset than in the Soldier dataset as a function of BMI. This would be consistent with an older Air Crew population with greater abdominal adiposity. The inclusion of torso circumference measures in the regression is intended to compensate for differences of this sort. However, the relationships between abdomen depth and waist circumference, and between chest width and chest circumference, show a consistent pattern of the mesh measures for Air Crew being larger as a function of the associated standard anthropometric dimension. For example, for a chest circumference of 1000 mm, the node-to-node chest breadth is about 20 mm larger for the Air Crew than for the Soldiers.
Figure 12. Differences in relationship between standard anthropometric variables for Soldiers (blue) and Air Crew (red) and node-to-node dimensions measured on the mesh.
4. PREDICTING SEATED BODY SHAPE FROM STANDING
[An earlier version of this section appeared as Reed et al. (2016)]
anthropometric dimensions, but this approach leverages the large amount of functionality in these commercial human modeling tools (Reed et al. 2014).
An alternative is the development of statistical body shape models based on the scan data rather than extracted dimensions. Many such models have been reported (e.g., Allen et al. 2004; Reed and Parkinson 2008; Hasler et al. 2009). Recent examples include Loper et al. (2015) and Reed and Park (2015). Reed et al. (2014) developed a statistical body shape model based on the surface mesh of a widely used DHM tool, enabling rapid implementation. However, the statistical model did not include the effects of body shape change with posture change away from the scan posture.
Among the statistical body shape models, only a relatively small number are capable of representing posture change. The most sophisticated of these provide a smooth transformation across a wide range of postures (e.g., Loper et al. 2015). However, these methods have not found widespread use for ergonomics analysis because of the challenges of implementing the models in ergonomics software. In particular, the implementation of the surface blending functions that simulate the effects of posture change are linked to particular kinematic models. When implemented with different kinematic models (for example, different joint angle definitions and
different joint locations relative to the surface) the blending functions are no longer accurate.
This section presents a statistical method of generalizing postures without the requirement for a kinematic linkage and joint blending functions. We use a dataset with multiple postures to learn the within-subject relationships in body shape in multiple postures and demonstrate that it is effective in predicting automotive-like seated postures from standing scan data.
Materials and Methods
Data Source
The data for this analysis were drawn from a study of 100 men and 100 women with a wide range of body size and age (Reed and Ebert 2013). Approximately 30% had a body mass index >30 kg/m2. Unusual for a body scan study, about half of the study
population was over age 60 years.
Figure 13. Standing and seated postures used for the current analysis.
The scan data were processed through a pipeline that included hole-filling and decimation to approximately 80k vertices from ~200k vertices in the original scans. Mesh templates were fit to the scans using procedures described in Park and Reed (2015). The templates for the standing and seated scans were different, including different numbers of vertices and polygons, and no homologous mapping was established between the two templates.
Analysis
Figure 14 shows the overall analysis process. Principal component analyses (PCA) were conducted separately for the standing and seated data, using methods
described in Reed and Parkinson (2008). For the current purposes, 60 PCs
representing more than 99% of the variance in the vertex coordinates were retained for each model.
In typical applications, body shapes are predicted from overall anthropometric measures such as stature and body weight (Parkinson and Reed 2008; Park and Reed 2015). We construct statistical body shape models by conducting regression analysis to predict principal component (PC) scores and reconstruct a body shape from the PC scores.
Figure 14. Schematic of analysis method.
Results
Figure 15 shows some examples of the results of the seated predictions. Each illustration shows the standing template fit, the seated template fit, and the
predicted seated body shape generated from applying the regression model to the PC scores from the standing fit.
5. AUTOMATIC EXTRACTION OF GEAR DATA FROM SCANS: INSCRIBED FITTING
[An earlier version of this section appeared as Park and Reed (2016)]
Only a few studies have attempted to estimate body shapes under clothing. Balan and Black (2008) presented a model-based body shape estimate system, which infers nude body shape from a number of multiple images by finding a maximal silhouette-consistent shape. Hasler et al. (2009) took a similar fitting approach, but the method used a single laser range scan to estimate the body shape. Guan et al. (2012) presented a method focusing on 2-dimensional models for modeling clothing deformations on the body. These studies all require high computational resources to solve expensive optimization problems.
This paper presents a fast fitting method to estimate the body shape under clothing or equipment. The complementary result is that a model of the clothing and gear relative to the body is also obtained. The method is based on a rapid PC-based fitting method (Park et al. 2013) utilizing a statistical body shape model (SBSM). SBSMs used with this method are developed based on laser scans using statistical methods including principal component analysis and multivariate regression (Park and Reed 2014). Because all body shapes generated are within the space of possible body shapes, we leveraged this characteristic to estimate body shapes in scans of clothed subjects using an inscribed-fitting method.
Methods
Statistical Body Shape Model
The current study used a statistical body shape model (SBSM) based on statistical analysis of scan data obtained from 213 men with wide range of body size. Using the process described in Park and Reed (2015), data from each scan was fitted using a template mesh obtained from the Jack manikin. As a first step in this process, 92 landmarks were estimated and then were used as targets for a non-rigid registration using radial-basis-function interpolation. An implicit surface method was used to complete the template fitting process. Principal component (PC) analysis was conducted on measured landmarks, estimated joint centers, and surface mesh nodes. A total of 200 PC scores were retained from the analysis, which accounts for over 99% of the data variance.
(PPE), and encumbered with gear level (ENC). The scan data were processed through a pipeline that included hole-filling and decimation to approximately 80k vertices form 170k vertices.
Figure 16. Four different levels of clothing of an individual: (a) minimally clad level (MC), (b) advanced combat uniform level (ACU), (c) personal protective equipment level (PPE), and (d) encumbered with gear level (ENC)
PC-based Fitting Method
Figure 17. Schematic of PC-based fitting process to fit 3D data in the body shape space of the model
Inscribed Fitting Method
The inscribed fitting method described in this paper was motivated by the fact that the body shape should lie inside the surface of a clothed body, and at the same time, some parts like face, ankles, and hands of the scan should be close to the actual body shape. This yielded an assumption that an actual body shape is the maximum body volume within the scan surface that is available in the body shape space of the model. Conceptually, this is similar to finding an inscribed circle in a polygon.
The inscribed fitting method consists of the following steps:
1. Compute an initial PC score vector p0 by fitting the SBSM to a target scan
using the PC-sensitivity matrix.
2. Find vertices of the model outside the target scan surface.
3. Build a sub-sensitivity matrix by keeping the columns only related to the outside vertices from the PC-sensitivity matrix.
4. Compute direction vectors from the outside vertices to the closest points of the scan using a kd-tree.
5. Compute a PC vector pi by multiplying by a pseudo-inverse of the sub-sensitivity matrix by the direction vectors to move the outside vertices to the scan surface.
6. Update the PC score vector p0= p0+ pi and apply pi to the model.
7. Go to step 2 until a criterion is met.
sub-these vertices, and the inverse of the matrix allows for estimating the increments of PC scores to move the vertices to certain target points. Thus, we multiplied a pseudoinverse of the matrix by the direction vectors to get the PC score increments to move the outside vertices onto the target scan surface. Since the pseudoinverse provides a least-square solution, a few iterations are needed to get the most of the outside vertices inside the measured surface mesh.
Figure 19 shows the results of each inscribed fitting process for a sampled PPE scan. While the initial fitting gives overall body shape and well-matched posture this is still a larger body shape than the actual one due to the clothing (Figure 19(a)). By iterating the process of pushing the outside vertices onto the target surface, we can get the maximum body shape that lies inside the scan surface. Experimentally, about 3 to 15 iterations result in good estimation of the body shape, depending on the level of clothing. For example, for ENC scans, the highest level of gear, about 10-12 iterations were performed to estimate the underlying body shapes.
Figure 19. Effect of iterations on fitting results of a SBSM (white) to a sample scan (blue)
Results
The SBSM was inscribed-fitted to 300 scans of ACU, PPE, and ENC levels of 100 male soldiers. Figure 20 shows examples of the fitted results at each level. Each row shows the target scan (white) and the estimated body shape (yellow) using the inscribed fitting method. Figure 20(d) shows a quantitative comparison between the estimated body shape and the minimally-clad scan of the same soldier. The mean absolute distances between the two surfaces were computed at each vertex and coded with the color in red (50 mm) to blue (0 mm). Due to differences in extremity postures between the scans, only the torso area was evaluated quantitatively.
In Figure 21, the mean errors at each vertex across all the scans were color-coded
on a mean body shape. For the ACU scans, the mean error was 11.1 mm, 95th %tile
error was 17.1 mm, and the root-mean-square-error (RMSE) was 11.7 mm. For the
Figure 21. Mean error distribution color-coded on a mean body shape. The fitting time was under two seconds per scan on average on a typical laptop computer (I7 3.4GHz CPU with 16 GB RAM). Experimentally, the number of iterations required was 3 ~ 6 for ACUs scans, 8 ~ 10 for PPEs, and 10~12 for ENCs.
[image:37.595.200.400.73.243.2]Figure 22. Demonstration of extracting and applying gear and equipment geometries. (a) Inscribed fit, (b) predicted gear, (c) measured gear scan, (d) and (e) overlay, (f) comparison
6. PILOT DATA COLLECTION IN PRONE POSTURES
Soldiers are called upon to perform in a wide range of postures. One common category of postures is prone. This posture is of particular interest because of the potential for gear worn on the front of the body to interfere with activities. As part of a broader effort to develop appropriate measurement methods for this posture, a small-scale pilot study of prone postures was conducted at UMTRI using civilians in military gear.
DISCUSSION
Error Metrics
The analysis of body shape prediction in the current work used two error metrics. First, the difference between two meshes was computed by calculating the distance from the nodes of one mesh to the polygonal surface defined by the other. For these standing whole-body meshes, 1940 nodes in the torso area were used for
comparison. Summary statistics for this vector of distances were computed and used in evaluations of various modeling and prediction methods. This method provides a holistic comparison of the two surfaces and gives an overall indication of the similarity. The consequences of a mean distance difference are somewhat difficult to interpret however, particular when comparing small differences (say, mean differences of 3 or 6 mm). Nonetheless, this metric is useful for evaluating trends in whole body prediction as various model parameters are changed.
Second, a set of dimensions intended to be approximately analogous to standard anthropometric dimensions were computed. For computational simplicity, these torso depths and breadths were defined as the fore-aft and lateral distances
between pairs of nodes on the template mesh. These measures are not equivalent to the standard anthropometric variables that have similar names, due to differences in definition and measurement methodology. Nonetheless, they are more readily interpreted than the overall mesh error with respect to potential applications in clothing and equipment sizing.
In general, the findings in this report with respect to model performance must always be considered in the context of a particular application or analysis. For example, the model performance suitable for developing a sizing system for body armor intended to cover the thorax might be different from the performance needed for vehicle interior design. As is always the case with anthropometric models, the relative importance of accuracy in representing body size and shape is dependent on the contributions of posture and preference unrelated to body attributes in determining the outcomes of interest. For example, clothing margins will routinely vary more than the differences resulting from choosing to retain 50 or 200 PCs.
Alternative Modeling Approaches
Effects of Number of PCs Used for Reconstruction
Unlike the mesh errors, the trends in linear torso dimensions were unexpectedly variable as the number of PCs increases. This phenomenon results from the differential effects of PCs on the particular nodes used for these dimensions. This will generally be the case with dimensions measured on the mesh, whether based on measurement planes or node-to-node points, as in the current analysis. Importantly, the mean measurement is unbiased regardless of the number of PCs used. Instead, the variance in reconstruction error increases or decreases as PCs are added, though generally trending downward. This observation suggests that the choice of the number of PCs to retain should be made, when possible, with reference to specific aspects of the mesh that are of importance for a particular analysis. Moreover, every dimension, template mesh, and PCA with a different dataset will have different trends in variability, though all will tend to zero reconstruction error with large numbers of PCs retained.
A reasonable question is why all PCs can’t be retained, and indeed all PCs were retained for many of the analyses in the report. The advantages of using fewer PCs are (1) smaller storage and increased computational speed of the PCA model, and (2) smoother predictions. Overall, the results in this report do not show important advantages of using more than 100 PCs and in some cases the improvements from using more than 50 PCs appear to be minimal.
Mesh Error Using Regression
When regression is used to predict body shape, the mesh errors can be expected to be due to both the residual variance that is not predicted by the selected variables and to the number of PCs retained. Surprisingly, a small increase in mean mesh error across subjects observed when predicting with three variables and increasing the number of PCs from 50 to 150 (the mean 95th%ile error across subjects
increased by less than 2 mm). Discounting this small effect, mesh errors resulting from a regression prediction using three overall body dimensions (stature, BMI, and SH/S) are essentially identical with 50 or more PCs.
Effects of the Number of Anthropometric Predictors
error decreasing from 16 mm to 14 mm. Importantly, the residual mesh errors were not significantly related to any of the predictors variables. For example, the
discrepancies are not greater for individuals with higher BMI or smaller stature. This is an important finding, because it suggests that the normal assumption of homoscedasticity applies to this use of regression.
When examining dimensions defined by differences in node coordinates, the analysis can be more directly interpreted, because, when all PCs are retained, the regression predictions are numerically identical to performing the regression directly on the dimensions measured for each subject. This enables the use of the conventional R2 measure to assess the fraction of variance accounted for by the
predictors. Table 8 demonstrates two important findings from this analysis. First, when using a regression model, retaining more than 50 PCs does not meaningfully improve the prediction of dimensions measured between mesh nodes. Second, as expected, using 10 predictors rather than 3 reduces the residual variance (RMSE) and improves the fraction of variance accounted for (R2). Importantly, the amount of
improvement depends on the relationships between the predictors and dimensions. For example, 30% more of the variance in shoulder breadth was accounted for when using 10 rather than 3 variables.
These results demonstrate that although the overall mesh error metrics did not improve substantially when using 10 rather than 3 predictors, the improvement in the prediction of individual dimensions varied substantially. Overall, the selected dimensions were fairly well predicted, but other dimensions may not have been. Consequently, it is not possible to state categorically how well a model with a set of predictors will perform for an analysis that depends on a particular set of
dimensions; the model performance must be assessed for that particular case.
Effects of the Number of Subjects
Anthropometric surveys are time-consuming and expensive. In the past 15 years, 3D scanning has typically been added on to surveys conducted using conventional methods, although some surveys have supplemented standard dimensions with measures extracted from scans using either manual or automated methods. An important question is how many scans are needed from a population to create a body shape model achieving some desired level of fidelity.
The availability of a large number of scans fitted with a homologous template enabled a resampling simulation approach to address this question. Using the
combined population of Soldiers and Air Crew (N=436). Sample populations of 50 to 200 subjects were randomly selected for building models, which were then
model performance across instances of randomly generated 50- or 100-PC models was similar. Similar findings were observed in the analysis of dimensions predicted using randomly sampled subsets. Using more than 100 subjects had almost no effect on the accuracy and precision of dimension predictions.
These findings are readily understood by considering the structure of the models. The PCA rotates the data to obtain orthogonal components, but even with 50 PCs nearly all of the underlying variance is retained. Although the regressions are performed on PCs individually, the results are numerically identical to performing the regressions directly on mesh node coordinates when all PCs are retained.
Consequently, experience with ordinary linear regression with scalar dependent measures provides good intuition into the performance of these PCA+regression models. Specifically, little improvement in the model performance (for example,
RMSE or R2) is expected when adding additional subjects randomly sampled from
the domain of independent variables after 50 or 100 samples.
This finding provides useful guidance for gathering data to represent new
populations, or for selecting data to use for model construction. When the accuracy and precision needed for the application are reasonably represented by the metrics used here, these results indicate that having scan data from 100 randomly sampled individuals within each subgroup of interest will generally be sufficient if predictive models are constructed using the techniques in this report.
The efficiency of the sample can be improved further by selectively sampling individuals with body dimensions relatively far from the mean. These individuals will exert greater leverage on the regressions than those close to the mean and provide greater stability of the slope estimates than the same number of randomly sampled subjects.
Extending Predictions to New Populations
reduced when adding additional variables, including torso circumferences, suggests a different source. As demonstrated by Figure 12, the relationships between the standard chest and waist circumference measures and the node-to-node dimensions measured on the scans show consistent offsets between the Soldier and Air Crew datasets. For example, at the equivalent chest breadth dimension (node-to-node) the Air Crew dimensions are about 30 mm smaller. Hence, when the Air Crew dimensions are entered into the Soldier regression, the resulting body shape is larger than would be expected based on the Soldier data.
These findings suggest caution in using a model from one population to represent individuals from another population. The mean dimension errors in this example are small in absolute terms (maximum of 9 mm, for chest width, using 10
predictors) but could be important for some applications. Importantly, differences in measurement methods can reduce the utility of the regression models for adjusting for differences in body dimensions.
Predicting Seated Body Shape from Standing
To our knowledge, this is the first published description of using PC scores from one posture to predict those in another. However, the approach is sufficiently
straightforward that other researchers may have used it in the past. Nonetheless, the method is quite powerful, because it can be applied broadly and in a variety of contexts. For example, Hu et al. (2013) presented a method for assessing automobile seatback shape using seated body shapes. Using the current methods, these shapes can be generated from a dataset containing standing postures but lacking supported seated postures, such as CAESAR (Reed et al. 2008). The method can also be used to predict difficult-to-measure supported seated postures from standing postures that can be easily recorded using low-cost depth cameras (Park and Reed (2014).
The method is limited in that a relatively large amount of high quality body scan data is needed in each of the postures for which predictions are desired. Moreover, template fits must be performed in each posture so that a PCA can be conducted. In principal, the prediction could be performed directly on the vertex coordinates with no loss of fidelity, but in practice it is more efficient to predict a much smaller
number of PC scores.
The number of scans from the target population that are needed is fairly small. Paralleling results from the earlier sections of this report, using more than 120 scans did not meaningfully improve the model performance, even in the tails of the anthropometric distribution, because the models are inherently linear.
Consequently, there is also no risk of overfitting.
and appears to perform well for a wide range of body types, but more work is
needed to assess the quality of the predictions for markedly different populations. It would not be expected to work well for a population with different origin from the source data, such as East Asian or African.
A second limitation is that the predictions of alternative postures are not based on a specific kinematic linkage, and hence the only postures that can be generated by this procedure are those with available scan data. However, if the target posture is close to the posture that is desired for a particular ergonomic analysis, this limitation becomes a strength, because it is not necessary for the model to have blending functions enabling such a large posture change. This might be valuable for
initializing new baseline body shapes for different seated conditions. Moreover, we have previously demonstrated methods for driving posture change for seated body shapes using surface landmark configurations (Reed 2013), which are available from posture-prediction models, such as Park et al. (2015).
Automatic Extraction of Gear Data from Scans: Inscribed Fitting
Efforts to achieve the nominal goal of gear extracted unexpectedly yielded a methodology with considerably broader utility. The inscribed fitting method developed in this work can be used to rapidly estimate body shape and body dimensions under clothing and gear. The method showed fast performance and convergence, regardless of what level of clothing and gear might be, without solving expensive optimization problems. The vertex error values were fairly small, but relatively larger errors were observed in the chest, abdomen, and buttocks, reflecting the fact that the success of the method is affected by the amount of the true body form that is accessible from the scan.
be used. However, work is underway on a fully-posable body shape model that will enhance this method to estimate arbitrary postures. Other researchers have
previously demonstrated models encoding both pose and shape (Loper et al. 2015, Pischulin et al. 2015).
The accuracy of the method can be improved in certain circumstances by learning the offsets associated with a particular gear ensemble and incorporating them into the fitting. If an individual is scanned minimally clad and with the clothing/gear ensemble, the offset between the two can be incorporated into the fitting for subsequent individuals wearing the same ensemble, thereby improving the accuracy.
Overall Discussion, Limitations, and Future Work
This project addressed a range of issues relating to body shape modeling that have not previously received extensive attention. Overall, the results demonstrate that the PCA+regression (PCAR) methodology used in this study is remarkably robust to a variety of assumptions and constraints. Due to the linearity of the model, little improvement in model performance is seen when data from more than 100 subjects randomly selected from a population are used. This has substantial implications for the design of studies. In general, sampling perhaps 150 individuals from any
particular cohort or subpopulation of interest is likely to be sufficient if the data are to be used to create a PCAR model.
REFERENCES
Allen, B., Curless, B., & Popović, Z. (2003). The space of human body shapes: reconstruction and parameterization from range scans. In ACM Transactions on Graphics, 22, 587-594.
Choi, H., Coate, A., Selby, M., Hudson, J., Whitehead, C., Zehner, G., & Fleming, S. (2014). Aircrew Sizing Survey 2011. Oak Ridge Institute for Science and Education.
Curless, B., & Popovic, Z. (2004). Exploring the space of human body shapes: Data-driven synthesis under anthropometric control. In Proceedings of Conference on Digital Human Modeling for Design and Engineering. SAE International.
Bălan, A. O., & Black, M. J. (2008). The Naked Truth: Estimating Body Shape Under Clothing. In Computer Vision – ECCV 2008. 5303:15–29.
Cignoni, P., Callieri, M., Corsini, M., Dellepiane, M., Ganovelli, F., Ranzuglia, G. (2008).
Proceedings of the 2008 Eurographics Italian Chapter Conference, 129-136.
Gordon, C.C., Blackwell, C.L., Bradtmiller, B., Parham, J.L., Barrientos, P., Pacquette, S.P., Corner, B.D., Carson, J.M., Venezia, J.Z., Rockwell, B.M., Mucher, M., and
Kristensen, S. (2015). 2012 Anthropometric Survey of U.S. Army Personnel: Methods and Summary Statistics. Technical Report NATICK/TR-15/007. U.S. Army Natick Soldier Research, Development and Engineering Center Natick, Massachusetts.
Guan, P., Freifeld, O., & Black, M. J. (2010). A 2D human body model dressed in eigen clothing. Computer Vision–ECCV2010.
Hasler, N., Rosenhahn, B., Hasler, N., Thormählen, T., Stoll, C., Stoll, C., et al. (2009a). Estimating body shape of dressed humans. Computers & Graphics, 33(3), 211–216.
Hasler, N., Stoll, C., Sunkel, M., Rosenhahn, B., & Seidel, H. P. (2009b). A statistical
model of human pose and body shape. In Computer Graphics Forum, 28(2): 337-346.
Mochimaru, M. and Kouchi, M. (2000). Statistics for 3D human body forms. In
Proceedings of the Human Factors and Ergonomics Society Annual Meeting, 44(38):852-855
Park, B-K. and Reed, M.P. (2014). Rapid generation of custom avatars using depth cameras. Proc. 3rd International Digital Human Modeling Conference. Tokyo, Japan.
Park, B-K, Lumeng, J.C., Lumeng, C.N., Ebert, S.M., and Reed, M.P. (2014). Child body shape measurement using depth cameras and a statistical body shape model.
Ergonomics, 58(2):301-309. 10.1080/00140139.2014.965754
Park, B-K and Reed, M.P. (2015). Parametric body shape model of standing children ages 3 to 11 years. Ergonomics, 58(10):1714-1725.
10.1080/00140139.2015.1033480
Park, B-K D., Ebert, S., and Reed, M.P. (2016). A parametric model of child body shape in seated postures. Traffic Injury Prevention.
10.1080/15389588.2016.1269173
Park, B-K.D., Corner, B.D., Kearney, M., and Reed, M.P. (2016). Estimating human body characteristics under clothing using a statistical body shape model. Proc. 4th
International Digital Human Modeling Conference. Montreal, Canada.
Park, J., Reed, M.P., and Hallman, J.J. (2016). Statistical models for predicting
automobile driving postures for men and women including effects of age. Human
Factors.
Pishchulin, L., Wuhrer, S., Helten, T., Theobalt, C., and Schiele, B. (2015). Building statistical shape spaces for 3D human modeling. arXiv:1503.05860.
Reed, M.P. and Parkinson, M.B. (2008). Modeling variability in torso shape for chair
and seat design. DETC2008-49483. Proceedings of the ASME Design Engineering
Technical Conferences. ASME, New York
Reed, M.P. (2013). Modeling body shape from surface landmark configurations.
Human Modeling and Applications in Health, Safety, Ergonomics, and Risk Management, 8026:376-383
Reed, M.P. and Ebert, S.M. (2013a). The Seated Soldier Study: Posture and Body Shape in Vehicle Seats. Technical Report 2013-13. University of Michigan Transportation Research Institute, Ann Arbor, MI.
Reed, M.P., Byoung-Keon, P., Kim, K.H., and Raschke, U. (2014). Creating custom
avatars for ergonomic analysis using depth cameras. Proceedings of the 2014 Human
Factors and Ergonomics Society Annual Meeting. HFES, Santa Monica, CA
Reed, M.P., Park, B-K., Kim, K.H., and Jones, M.L.H. (2015). Statistical prediction of body landmark locations on surface scans. Proceedings of the 19th Triennial Congress of the International Ergonomics Association, Melbourne, Australia.
Reed, M.P., Park, B-K. D., and Corner, B.D. (2016). Predicting seated body shape from standing body shape. Proc. 4th International Digital Human Modeling Conference.
Montreal, Canada.
Stančić, I., Musić, J., and Zanchi, V. (2013). Improved structured light 3D scanner with application to anthropometric parameter estimation. Measurement, 46(1), 716-726.
Turk, M. and Pentland, A. (1991). Eigenfaces for recognition. Journal of Cognitive Neuroscience, 3(1):71-86.