2018 3rd International Conference on Computational Modeling, Simulation and Applied Mathematics (CMSAM 2018) ISBN: 978-1-60595-035-8
A Model to Detect Faked Link in Software Defined Network
Dong LI
*, Xing WANG and Yong-pu GU
HuaZhong University of Science and Technology, Wuhan, Hubei, China
*Corresponding author
Keywords: SDN, Network security, Faked link.
Abstract. This paper establishes a SDN-based network traffic anomaly detection model based on decision tree. Firstly, five statistical indexes are presented to describe the behavior of network traffic, then normal and abnormal traffic data to train the machine learning model to detect traffic anomaly. Four machine learning algorithms, decision tree, k-nearest neighbor, support vector machine and naive Bayes, are used to predict the detection rate, false alarm rate and other indicators. Experiments shows that decision tree algorithm is suitable for detecting traffic anomaly in SDN network.
Introduction
Software Defined Network(SDN) is a new networking paradigm which separates the data plane and control plane of network. It provides a logically centralized visibility of the entire network to the controller. To establish the global visibility, a controller is required to discover the topology of the entire SDN network. It is utmost important and a prerequisite for network management, such as resource management, network monitoring and network problem trouble shooting[1].
Since SDN topology discovery holds the key for SDN operation, it has attracted many researcher in the past few years. Discovering the network topology is challenging due to some barriers[2]: the first is the frequent migration of network devices, such as virtual machines in the data centers; the second is lack of authentication mechanisms; the third is scarcity of the SDN standards; and the last is lack of security consideration.
In real SDN network, the topology discovery mechanism is a built-in model of the controller, but in SDN network the controller is a single point of failure. For discovering topology, the security of controller is the first challenge to address, some issues include controller vulnerabilities, performance and capability of mitigating Denial-of-service attack[3]. the threat to the security of the SDN architecture is miscellaneous, such as Man-In-The-Middle attack[4], Identity spoofing, repudiation etc.
There are various proposals for SDN topology discovery, but these methods can not make topology discovery in SDN truly secure and scalable. this paper aims to establish a model to detect the faked link in SDN network which is compromised by hostile attackers.
Topology Discovery Mechanism of SDN
The discovery entities of SDN network includes three parts: hosts, switches and inter-connected switch links. The discovery of inter-connected switches is far more important to the controller to shape the topology of the entire nework. In most of the times, the OFDP (OpenFlow Discovery Protocol) is used to discover the inter-connected links between the OF switches[5].
switches does not send, receive, and process the LLDP messages itself but rather created by the controller. The operation of the LLDP packet in the SDN is briefly explained below.
OFDP leverages the packet format of LLDP, but otherwise operates quite differently. Given its quite narrow API and limited match-action functionality, an OpenFlow switch cannot by itself send, receive and process LLDP messages. This needs to be initiated and executed entirely by the controller.
(1) First, the SDN controller creates an individual LLDP packet for each port on each switch. in Figure 1, the controller will create three packets. Each of these three LLDP packets has the Chassis ID and Port ID TLVs initialised accordingly.
(2) Then The controller sends each of these three LLDP packets to switch S1 via Packet-Out message.
(3) Each switch will forward the received LLDP packets encapsulated in packet_out message to the direct-connected nodes.
(4) All switches have a pre-installed rule in their flow table to forward any LLDP packet received from any port except the CONTROLLER port to the controller, which is finished via an Packet-In message.
(5) The entire discovery process is performed periodically, with a new discovery round or cycle initiated in fixed intervals, which typical default interval size is 5s.
S1
SDN Controller
S2
Packet_out With LLDP pkt
Packet_out
With LLDP pkt With LLDP pktWith LLDP pktPacket_inPacket_in
LLDP pkt (Chassis ID=S1,
Port ID=P1)
LLDP pkt (Chassis ID=S1,
Port ID=P1)
P1
P1 P1P1
P2
P2
P3
P3 LLDP pkt (Chassis ID=S1,
Port ID=P3)
LLDP pkt (Chassis ID=S1,
[image:2.595.175.423.324.457.2]Port ID=P3)
Figure 1. Scenario of SDN topology discovery.
If you follow the “checklist” your paper will conform to the requirements of the publisher and facilitate a problem-free publication process.
Vulnerability IN SDN Topology Discovery
This section will present the vulnerabilities of SDN topology discovery protocol OFDP, The main vulnerability of OFDP is that controller cannot judge if LLDP control messages are faked by hostile entity. If the faked LLDP packets are accepted by the controller, it will be used to update the network topology view[9]. So it is easy for an attacker to break down the entire network, thereby corrupting the topology information of the controller. Here is an example shown in Figure 2. Suppose that host H1 has been compromised by an attacker and wants to create a fake link between S1 and S2.The attack can be carried out by the following steps:
1) H1 receives an LLDP packet which is advertised by switch S1 if S1 receives the packet-out message sent by controller to collect topology information. The received packet follows the structure shown in Figure 2, then H1 fakes an LLDP packet with the Chassis ID TLV set to S3, and the Port ID set to P1.
2) S1 receives the LLDP packet from H1 and forwards it to the controller with Packet-In message. S1 adds information to the Packet-In message that includes its own Chassis ID and the Port ID, in this scenario the value is (S1, P1).
3) The controller receives the Packet-In message sent by S1 and will conclude that there exists a link between (S3, P1) and (S1, P1) based on the topology discovery mechanism.
attacker can use the vulnerability exists in OFDP to send out faked packets to pollute the topology of the SDN network.
Controller
S1
S3
S2
H1 H2
P1 P1
Figure 2. Scenario of faked link attack in SDN.
Faked Link Detection
To solve the security problem of network topology discovery, there are mainly three ways. The first is to update the existing network topology discovery protocol to take security into consideration[5] the second is to design a new SDN application to protect the topology view[7]; the third is to develop a new protocol with security features to discover the network topology[8]. This paper we want to build a faked link detection model based on packet loss rate and link utilization rate, while reduce the false positives due to congested and jittered links.
Before reviewing the comparisons in network packet loss rate for a benign and some other kinds of links, we should try to collect data to measure the packet loss rate of the links. In SDN, controller can send read-state OpenFlow messages which are used to collect statistics from the switches flow-tables, ports, and the individual flow entries, for example, ofp_port_stats_reply can be used to get the packet rate and link speed to measure the link quality.
[image:3.595.194.403.101.225.2]Figure 3 illustrates the difference of four types of network links. Compared to benign link, congested link and jittered link, the packet loss rate of faked link is significantly larger. Based on this reasonable hypothesis, we establish a model to detect the faked links in SDN network.
Figure 3. Packet loss rate Comparisons of benign, congested, jittered and faked links.
Based on the above analysis, we want to establish a model based on packet loss rate and link utilization rate to detect the faked link in SDN network. Some notations are described as table 1.
Table 1. Notations.
Symbol Descriptions
ℒi⟶j(t) Packet loss rate of the link directed from switch i to switch j in time window t ℒij(t) Packet loss rate of the link between switch i and switch j
Siout(n, t) The egress traffic of port number n in switch i in time window t Siin(n, t) The ingress traffic of port number n in swtich i in time window t
∁iji⟶j(t) Link utilization rate of the link directed from switch i to switch j in time window t
∁ij(t) Link utilization rate of the link between switch i and switch j
[image:3.595.140.457.475.596.2]Siout(n, t),S i
in(n, t) and B
i(n, t) can be obtained by the controller to send ofp_port_stats_reply to
SDN switch to lookup. Suppose the connected ports between switch i and switch j are m and n, then
ℒi⟶j(t) can be calculated as:
ℒiji⟶j(t) =Siout(m,t)−Siin(n,t)
Siout(m,t) (1)
∁iji⟶j(t) =Siin(m,t)
Bi(m,t) (2)
ℒij(t) and ∁ij(t)can be calculated as:
ℒij(t) = max (ℒiji⟶j(t), ℒijj⟶i(t)) (3)
∁ij(t) = max (∁iji⟶j(t), ∁ijj⟶i(t)) (4)
ℒij(t) can describe the packet loss rate of network links, and ∁ij(t) can describe the utilization rate
of link bandwidth. If the packet loss rate of an idle link is remarkably high, the probability that this link is faked will be much larger. For differentiating the faked link from benign links, we should
describe the distribution of ℒij(t) and ∁ij(t).
According to the statistical theory and our experience, we assume that ℒij(t) of the benign link
follows cumulative distribution, and the distribution function is:
F(x) = {1 − e1 x ≥ 1 −λx 0 < 𝑥 < 1
0 x < 0
(5)
Where the value of is large enough. Then the probability that link ij is benign can be defined as:
Pij(t) = F(maxtℒij(t))- F(mintℒij(t)) (6)
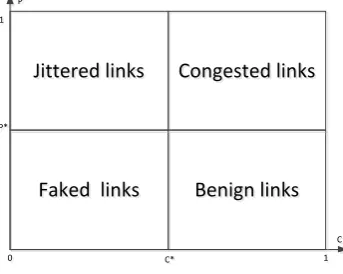
Then using Pij(t) and ∁ij(t), we can built a separating model to divide the four kinds of links
clearly as shown in Figure 4.
Faked links
Faked links Benign linksBenign links Jittered links
Jittered links Congested linksCongested links
0
0 11
1
1
C
C
C*
C*
P
P
P*
[image:4.595.209.381.517.654.2]P*
Figure 4. The region of links in P-C graph.
For faked link detection in our model, according to the above analysis, what we need to do is to
figure out the threshold value (P*, C* of a given SDN network.
Experiment and Evaluation
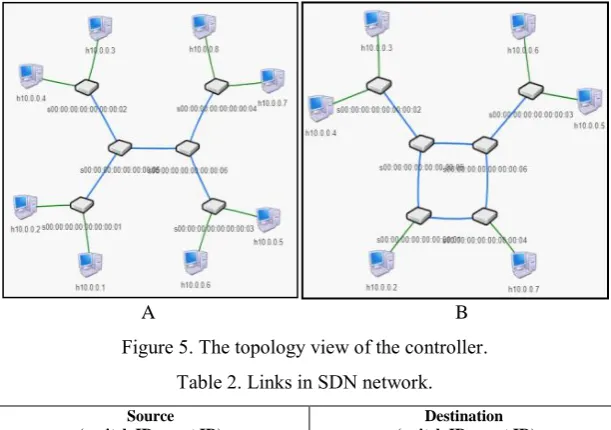
Firstly, For validating the existence of OFDP vulnerability, we simulate an attack as follows: in the
network described in Figure 5(A), the ports that are connected with host H1 and H8 are (S1, Port1)
and (S4, Port2), when H1 received LLDP packets advertised by S1 that is used by the controller to discovery the network topology, it will forward the them to H8 in secret. When the controller receives
the packet-in messages sent by (S4, Port2) with the Chassis ID and Port ID of LLDP is (S1, Port1)
that is faked by H8, it will update the network topology view that there is a link between (S1, Port1)
and (S4, Port2). The polluted topology is shown as Figure 5(B). From table 2 obtained from the controller we can see that ("00:00:00:00:00:00:00:01":"1 ") and ("00:00:00:00:00:00:00:04":"2") are regarded as being connected, but in fact H1 and H8 are connected with them.
[image:5.595.145.451.204.419.2]A B
Figure 5. The topology view of the controller. Table 2. Links in SDN network.
Source ( switch ID : port ID)
Destination (switch ID : port ID)
"00:00:00:00:00:00:00:01": "3 " "00:00:00:00:00:00:00:05": "2 " "00:00:00:00:00:00:00:02": "3 " "00:00:00:00:00:00:00:05": "1 " "00:00:00:00:00:00:00:03": "3 " "00:00:00:00:00:00:00:06": "2 " "00:00:00:00:00:00:00:04": "3 " "00:00:00:00:00:00:00:06": "1 " "00:00:00:00:00:00:00:05": "3 " "00:00:00:00:00:00:00:06": "3 "
"00:00:00:00:00:00:00:01": "1 " "00:00:00:00:00:00:00:04": "2"
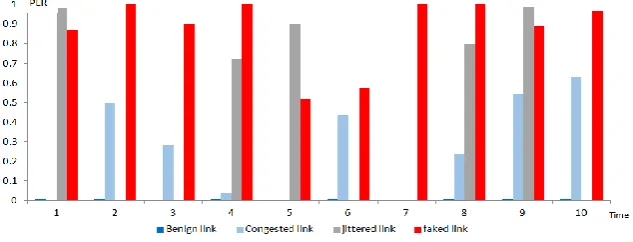
For testing the capability of faked link detection, we make use of the traffic generator D-ITG produce traffic periodically to simulate network activity, In every period, hosts in network will establish connections randomly. Under background traffic, we fake some links, congest some links and make some links jitter by reducing the quality of the link. In data analyzing by formula (5), we set
λ = 1000, then the value of (P, C) is distributed in coordinate system as Figure 6. From Figure 6 we can see that FL(Faked link), Benign link, Jittered link and Congested link can be divided by our
[image:5.595.156.442.594.766.2]model clearly. The thresholds of (P, C) and be given as: *=0.25, C*= 0.1.
Summary
This paper proposes a new way to detect the faked link in SDN network. Compared to precious research work, such as in [6], the link latency is used to detect link fabrication attack. This model is built on packet loss rate. In SDN, the packet loss rate can be calculated via querying the flow entry and switch port, while the link latency must be computed by some network measurement methods. So this model will not aggravate the overhead of switch and controller, what's more, it can detect the faked link in real time.
In the future, we will do much more supplementary work to optimize the model. First, faked hosts and switches detection also should be taken into consideration to enhance the security of SDN network topology discovery; second, we will use our algorithm in real SDN network to protect the network topology.
Acknowledgement
This work was supported by National Key R&D Program of China (2017YFB0801703).
References
[1] Dacier M C, König H, Cwalinski R, et al. Security challenges and opportunities of software-defined networking[J]. IEEE Security & Privacy, 2017, 15(2): 96-100.
[2] Khan S, Gani A, Wahab A W A, et al. Topology discovery in software defined networks: Threats, taxonomy, and state-of-the-art. IEEE Communications Surveys & Tutorials, 2017, 19(1): 303-324.
[3] Dhawan M, Poddar R, Mahajan K, et al. SPHINX: Detecting Security Attacks in Software-Defined Networks Network and Distributed System Security Symposium. 2015.
[4] T. Alharbi, M. Portmann, and F. Pakzad, “The (in) security of topology discovery in software defined networks,” in Proc. IEEE 40th Conf. Local Comput. Netw. (LCN), Clearwater Beach, FL, USA, 2015, pp. 502–505.
[5] Azzouni A, Boutaba R, Trang N T M, et al. sOFTDP: Secure and Efficient Topology Discovery Protocol for SDN[J]. arXiv preprint arXiv:1705.04527, 2017.
[6] Smyth D, McSweeney S, O'Shea D, et al. Detecting Link Fabrication Attacks in Software-Defined Networks. Computer Communication and Networks (ICCCN), 2017 26th International Conference on. IEEE, 2017: 1-8.
[7] Kaur N, Singh A K, Kumar N, et al. Performance impact of topology poisoning attack in SDN and its countermeasure. Proceedings of the 10th International Conference on Security of Information and Networks. ACM, 2017: 179-184.
[8] Hong S, Xu L, Wang H, et al. Poisoning Network Visibility in Software-Defined Networks: New Attacks and Countermeasures. Network and Distributed System Security Symposium. 2015.