Nijmegen
The following full text is a publisher's version.
For additional information about this publication click this link.
http://hdl.handle.net/2066/205525
Please be advised that this information was generated on 2019-09-12 and may be subject to
change.
Reducing inter-observer variability and
interaction time of MR liver volumetry by
combining automatic CNN-based liver
segmentation and manual corrections
Grzegorz ChlebusID1,2*, Hans MeineID1,3, Smita Thoduka4, Nasreddin Abolmaali4,
Bram van Ginneken1,2, Horst Karl Hahn1,5, Andrea Schenk
ID1
1 Fraunhofer Institute for Digital Medicine MEVIS, Bremen, Germany, 2 Diagnostic Image Analysis Group, Department of Radiology and Nuclear Medicine, Radboud University Medical Center, Nijmegen, The Netherlands, 3 University of Bremen, Medical Image Computing Group, Bremen, Germany, 4 Department of Radiology, Sta¨dtisches Klinikum Dresden, Dresden, Germany, 5 Jacobs University, Bremen, Germany *[email protected]
Abstract
Purpose
To compare manual corrections of liver masks produced by a fully automatic segmentation method based on convolutional neural networks (CNN) with manual routine segmentations in MR images in terms of inter-observer variability and interaction time.
Methods
For testing, patient’s precise reference segmentations that fulfill the quality requirements for liver surgery were manually created. One radiologist and two radiology residents were asked to provide manual routine segmentations. We used our automatic segmentation method Liver-Net to produce liver masks for the test cases and asked a radiologist assistant and one further resident to correct the automatic results. All observers were asked to mea-sure their interaction time. Both manual routine and corrected segmentations were com-pared with the reference annotations.
Results
The manual routine segmentations achieved a mean Dice index of 0.95 and a mean relative error (RVE) of 4.7%. The quality of liver masks produced by the Liver-Net was on average 0.95 Dice and 4.5% RVE. Liver masks resulting from manual corrections of automatically generated segmentations compared to routine results led to a significantly lower inter-observer variability (mean per case absolute RVE difference across inter-observers 0.69%) when compared to manual routine ones (2.75%). The mean interaction time was 2 min for manual corrections and 10 min for manual routine segmentations.
a1111111111 a1111111111 a1111111111 a1111111111 a1111111111 OPEN ACCESS
Citation: Chlebus G, Meine H, Thoduka S,
Abolmaali N, van Ginneken B, Hahn HK, et al. (2019) Reducing inter-observer variability and interaction time of MR liver volumetry by combining automatic CNN-based liver
segmentation and manual corrections. PLoS ONE 14(5): e0217228.https://doi.org/10.1371/journal. pone.0217228
Editor: Kumaradevan Punithakumar, University of
Alberta, CANADA
Received: December 14, 2018 Accepted: May 7, 2019 Published: May 20, 2019
Copyright:©2019 Chlebus et al. This is an open access article distributed under the terms of the
Creative Commons Attribution License, which permits unrestricted use, distribution, and reproduction in any medium, provided the original author and source are credited.
Data Availability Statement: Evaluation results
can be found within the manuscript and on Figshare at the following link:https://doi.org/10. 6084/m9.figshare.7466645.v1Image data used in this paper cannot be shared publicly due to legal reasons (it would compromise patient
confidentiality). Queries for image data access can be filed to the ethics board of the Sa¨chsiche Landesa¨rztekammer (https://www.slaek.de/de/06/ kontakt.php).
Conclusions
The quality of automatic liver segmentations is on par with those from manual routines. Using automatic liver masks in the clinical workflow could lead to a reduction of segmenta-tion time and a more consistent liver volume estimasegmenta-tion across different observers.
Introduction
Total liver volume plays an essential role in planning liver interventions such as liver surgery or radioembolization and in therapy response assessment [1,2]. Manual liver segmentation is a tedious and time-consuming task, which also is prone to inter-observer variability, in partic-ular for MRI data. Automation of the liver contouring process allows for shorter segmentation times and reduction of measurement subjectivity [3].
Recently, several approaches for automatic liver segmentation in MRI have been proposed. A 3D liver model guided by a precomputed probability map was used by Bereciartua et al. [4], which achieved a mean Dice of 0.90 for patients with healthy livers. Le et al. used a histogram-based liver segmentation with a subsequent geodesic active contour refinement step and reported a mean Dice of 0.91 [5]. Huyhn et al. proposed a method based on watershed trans-formation and active contours, which achieved a mean Dice of 0.91 [6]. Christ et al. trained a fully convolutional neural network for this problem, which produced liver masks with a mean Dice of 0.87 [7].
A related problem of automatic liver segmentation in CT images has received more atten-tion recently compared to segmentaatten-tion in MRI data thanks to the Liver Tumor Segmentaatten-tion Challenge (LiTS) organized in 2017 [8]. Top-ranking submissions used deep learning based segmentation approaches including hierarchical models for coarse-to-fine segmentation [9], 3D networks combining original image data with features derived from 2D models [10] and orthogonal 2D networks [11]. Other well-established algorithms for CT liver segmentation employ statistical shape models to describe plausible shape variations [12,13].
Whereas automatic methods produce liver segmentations of a quality close to that of experts, they can still fail in some cases, thus requiring manual corrections. As reported in [6], major segmentation errors are caused by leakage into neighboring organs (heart, colon, stom-ach, or kidneys) or by lesions located near the organ’s boundary. None of the recently pub-lished MRI segmentation methods was evaluated with respect to the required time to correct such major errors, which should be considered when assessing the overall utility of an auto-matic method.
The contribution of this paper is twofold. First, we provide a validation of our automatic method in MRI based on convolutional neural networks dubbed Liver-Net by comparing its results with manual routine segmentations performed by clinicians. Second, we report on seg-mentation errors of Liver-Net and required correction time by clinical users. Additionally, we investigate the influence of automatic liver proposals on the inter-observer variability with respect to the estimated total liver volume.
Materials and methods
Data
For our study, we used DCE-MRI data of 83 patients with primary liver cancer and/or liver metastases that were scheduled for selective internal radiation therapy (SIRT). Image data was Funding: The work was funded by the
Fraunhofer-Gesellschaft. The funders had no role in study design, data collection and analysis, decision to publish, or preparation of the manuscript.
Competing interests: The authors have declared
acquired at Sta¨dtisches Klinikum Dresden, Germany, on a 3T MRI scanner (Discovery, GE Healthcare Systems, USA). The image in-plane resolution ranged from 0.74 to 1.76 mm and the slice thickness from 2 to 5 mm. Segmentations were performed on the late hepatocellular phase acquired 15 min after intravenous injection of the contrast agent (Gd-EOB-DTPA, Bayer, Germany). We randomly selected 62 cases for training and optimization of our auto-matic method. The remaining 21 cases were left out for evaluation.
For all patients, reference segmentations were performed by two radiologist assistants with over ten years of experience in a precise segmentation according to liver-surgery planning requirements. The contours were drawn using a semi-automatic tool [14] and reviewed by a radiologist.
Imaging data for this study was evaluated at Sta¨dtisches Klinikum Dresden after approval by the ethics committee of Sa¨chsiche Landesa¨rztekammer (EK-BR-79/16-1 / 118834). All patients gave written informed consent. The study did not include minors.
Automatic segmentation method
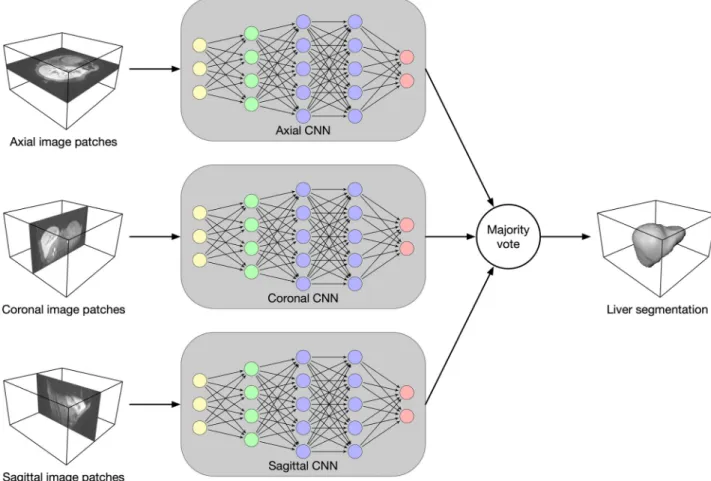
Architecture. Our segmentation method Liver-Net employs three orthogonal 2D CNN
models trained with axial, coronal and sagittal image patches (seeFig 1) [15]. Each of the CNN models is of a U-net-like [16] architecture working on four resolution levels and has a recep-tive field of 93×93, which was empirically found to provide enough context information for
Fig 1. Overview of the Liver-Net method. Three 2D U-net-like models analyze axial, coronal and sagittal image patches. The final segmentation mask is obtained by a majority vote.
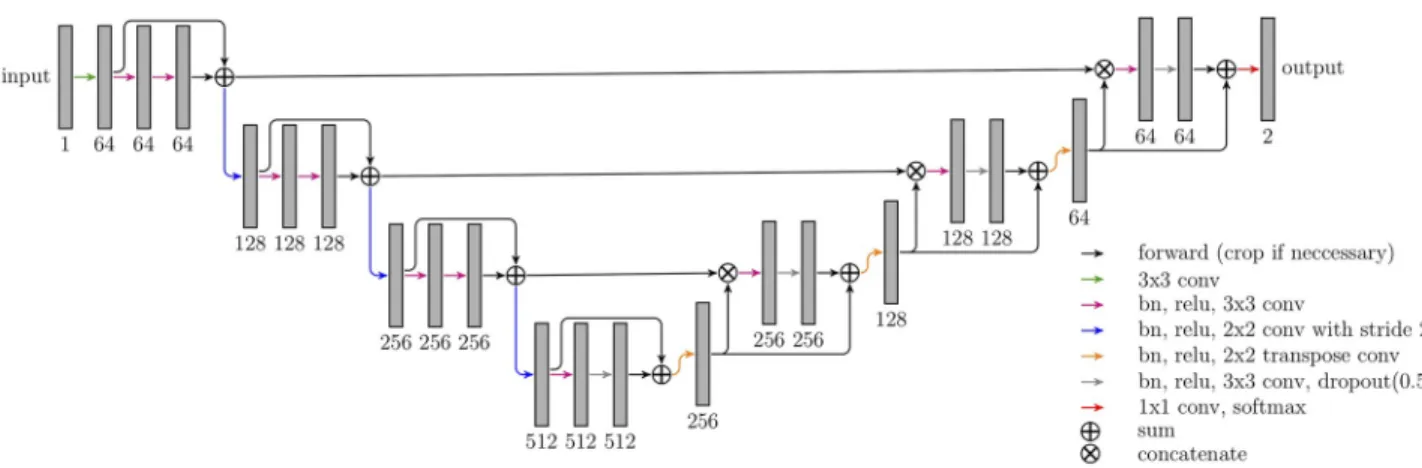
liver segmentation (seeFig 2). The models use convolutional layers with 3×3 kernel size. Downscaling (upscaling) is performed via strided (transposed) 2×2 convolutions. Each con-volution is followed by a batch normalization to speed up the convergence and ReLU nonline-arity. Short skip connections were added to improve the gradient flow throughout the network [17]. Additionally, in the upscaling path, dropout layers were used to avoid overfitting. Hard prediction outputs of the three models are combined via majority vote to produce the final seg-mentation mask.
Training. CNN models were trained using 2D image patches (228×228) and a mini-batch size of 16. Input was padded reflectively with 45 pixels on each side to account for convo-lutions computed in the “valid” mode. Models were trained using the soft dice loss function with the Adam optimizer (10−4learning rate). Model quality was evaluated every 500 iterations on the validation set using the Jaccard coefficient. The training was stopped if the model qual-ity had not improved for 20 validations.
Data preprocessing. The images fed into the models were resampled to 2 mm isotropic
voxel size and normalized by a linear mapping of the intensities between the 2ndand 98th per-centile of each MR image to the [0, 1] range. Random rotationsa½deg� �Nð0;10Þand ran-dom intensity shiftsx�Nð0;0:1Þwere applied to augment the training set.
Experiments
Comparison with manual routine segmentations. To evaluate the segmentation quality
of our automatic method, we asked one radiologist Rad (23-year radiology experience) and two radiology residents: Res1 (3-year radiology experience), Res2 (3-month radiology experi-ence) to delineate livers for 21 test patients according to routine clinical standards employed for SIRT planning and to measure the required time. The segmentations were performed using basic contouring software [18]. The automatic and routine segmentations were evalu-ated against the reference segmentations.
Error analysis of the automatic method. To analyze errors of the automatic method, we
asked another radiology resident Res3 (2-year radiotherapy, 1-year radiology experience) and one radiologist assistant RA (10-year contouring experience) to correct major errors of the automatically generated liver masks and to measure the correction time. The corrections were done using the same contouring tool as for the routine segmentations. To measure the impact of the corrections, we compared the automatic and corrected liver masks with the references.
Fig 2. Architecture of CNN models employed in the Liver-Net method. The numbers denote the feature map count.
Before the study was conducted, all observers participating in this study were trained to use the contouring tool used for manual segmentation and corrections.
Inter-observer variability. To assess the influence of the automatic liver segmentation on
the inter-observer variability of the estimated liver volume, we compared the inter-observer variability of the manual routine segmentations with the corrected segmentation masks.
Evaluation metrics
Segmentation quality. The segmentation quality was measured using complementary
metrics computed in 3D. We used the Dice index (DICE) as an overlap-based metric, the rela-tive volume error (RVE) as a volume-based error measure and the mean surface distance (MSD) and the Hausdorff distance (HD) as surface-based metrics. DICE between two binary objects is defined as:
DICEðX;YÞ ¼ 2jX\Yj
jXj þ jYj ð1Þ
We define RVE as:
RVEðX;YÞ ¼jVX VYj VY
�100% ð2Þ
whereVXandVYare the volumes of the test object and reference object, respectively. MSD
and HD are defined as follows: MSDðX;YÞ ¼ 1 2N X x2X min y2Y dðx;yÞ þ X y2Y min x2X dðx;yÞ ! ð3Þ HDðX;YÞ ¼maxfsup x2X inf
y2Ydðx;yÞ;supy2Y infx2Xdðx;yÞg ð4Þ whered(x,y) is the Euclidean distance between pointsxandy. To analyze how many slices had to be corrected, we computed a percentage of corrected slices (CS):
CS¼nc nt
�100% ð5Þ
wherencdenotes count of corrected slices andntdenotes count of slices occupied by the
auto-matic liver mask.
Inter-observer variability. The variability among users was measured as the average of
absolute inter-observer RVE differences. The consistency analysis of the volume estimation was performed using the intraclass correlation coefficient (ICC) [19]. We used the two-way random, single measure model ICC(2,1).
Differences were tested for statistical significance using the Wilcoxon signed-rank test at 0.01 level.
Results
The CNNs constituting the Liver-Net were trained in 3h, 1.5h and 6h for the axial, coronal and sagittal model, respectively. Time measurements for training as well as for prediction were done on a desktop PC (Intel Core i7-4770K, 32 GB RAM, NVIDIA Titan Xp).
Comparison with manual routine segmentations
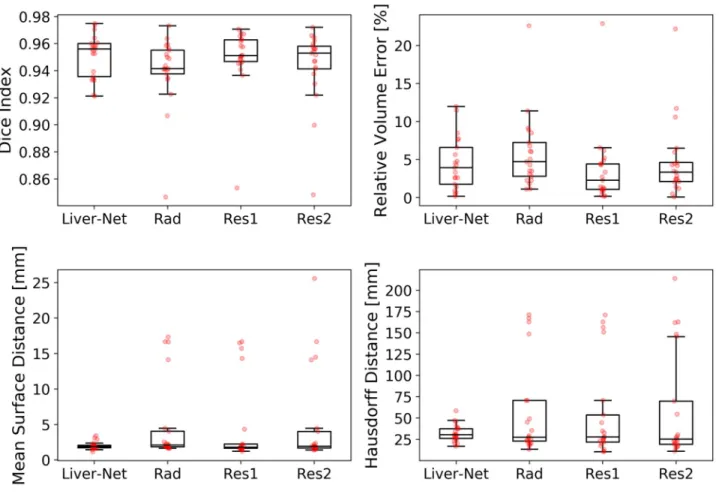
The quality of automatic liver masks was on par with manual ones according to the mean DICE: 0.95 for the automatic and 0.94, 0.95, and 0.94 for the manual segmentations (see Table 1andFig 3). The mean RVE of the routine segmentations was 5.8%, 3.6%, and 4.7% compared to 4.5% achieved by our method. For the surface distance metrics, our method resulted in the lowest errors (average of 2.0 mm and 32 mm for MSD and HD, respectively). No differences in metric values between the automatic and routine segmentations were signifi-cant. Our method needed on average 20±7 s per case, whereas the routine segmentations took 10±4 min.Fig 4shows representative examples of automatic results compared to routine segmentations.
Table 1. Evaluation results (mean±standard deviation) for the Liver-Net and manual routine segmentations by a radiologist (Rad) and two residents (Res1, Res2) when compared to the reference.
Liver-Net Rad Res1 Res2
DICE 0.95±0.02 0.94±0.03 0.95±0.02 0.94±0.03
RVE [%] 4.5±3.5 5.8±4.8 3.6±4.9 4.7±5.0
MSD [mm] 2.0±0.5 4.9±5.7 4.5±5.7 5.1±6.7
HD [mm] 32±10 57±55 54±55 60±64
Best results according to the mean are indicated in bold.
https://doi.org/10.1371/journal.pone.0217228.t001
Fig 3. Box plots showing segmentation quality of Liver-Net and that of manual routine segmentations.
Error analysis of the automatic method
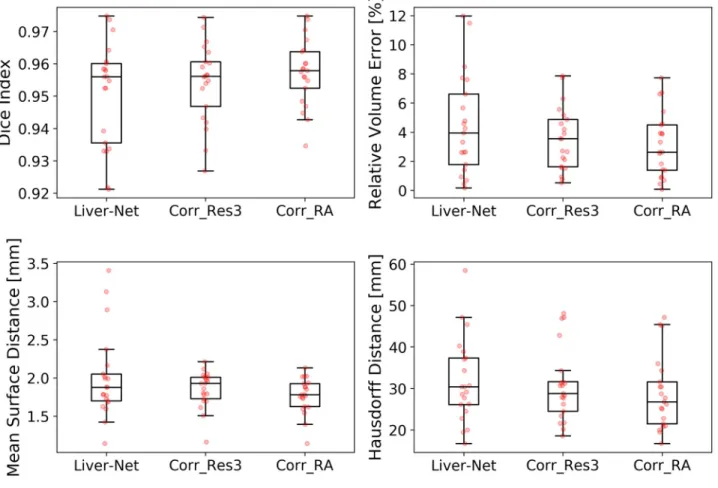
Res3 and RA corrected on average 38% and 25% of slices, respectively, which led to improve-ments in all error metrics (seeTable 2andFig 5). Liver masks corrected by the radiologist assistant scored significantly better than the automatic ones according to DICE (p = 0.001), RVE (p = 0.004), and MSD (p = 0.002), when compared with the high-quality reference. The corrections took 2.3±1.7 min for Res3 and less than 2 min for RA. Examples with no or minimal corrections needed as well as ones requiring many adjustments are illustrated in Fig 6.
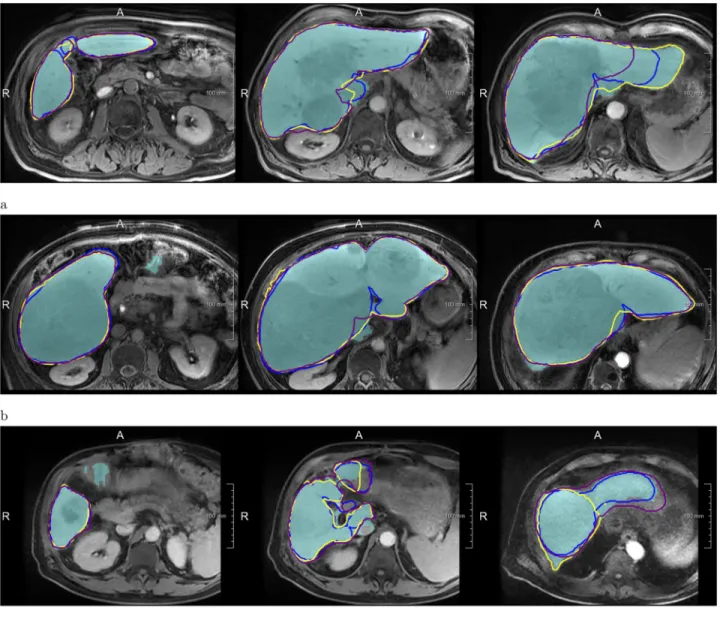
Fig 4. Examples of segmentations produced by the Liver-Net (cyan) compared to three routine delineations by Rad (blue), Res1 (yellow) and Res2 (purple). (a) Case where Liver-Net was more consistent with the reference than the routine segmentations: 0.70% (0.96), 8.89% (0.94), 6.56% (0.95) and 11.7% (0.92) for RVE (DICE) for the automatic method and the routine segmentations by Rad, Res1 and Res2, respectively. (b) Case where automatic and routine segmentations were very similar: 2.62% (0.97), 2.27% (0.97), 0.87% (0.97) and 0.09% (0.97). (c) Case where automatic liver mask had the biggest RVE: 8.49% (0.94), 2.24% (0.94), 0.80% (0.95) and 5.97% (0.94).
Inter-observer variability
The average per-case absolute inter-observer RVE difference was 2.75±1.41% for the manual routine segmentations, which was significantly higher (p = 0.0002) compared to 0.69±0.88% for corrected automatic liver masks (Fig 7).Table 3lists RVE values for each patient and each observer. The ICC(2,1) with a 95% confidence interval was 0.989 (0.978, 0.995) and 0.999 (0.998, 1) for manual and corrected segmentations, respectively.
Table 2. Evaluation results (mean±standard deviation) for the Liver-Net and for the liver masks corrected by Res3 and RA.
Liver-Net Corr_Res3 Corr_RA
DICE 0.95±0.02 0.95±0.01 0.96±0.01�
RVE [%] 4.5±3.5 3.5±2.2 3.1±2.2�
MSD [mm] 2.0±0.5 1.9±0.2 1.8±0.2�
HD [mm] 32±10 31±9 29±9
CS [%] n/a 38±30 25±28
Best results according to the mean are indicated in bold.
�Significant difference when compared to Liver-Net. https://doi.org/10.1371/journal.pone.0217228.t002
Fig 5. Box plots showing segmentation quality of the Liver-Net masks and their corrections done by Res3 and RA.
Discussion
Our Liver-Net method delivered segmentations which were on par with the manual routine segmentations. In case an observer corrected the automatic liver segmentation, the contours and subsequent volume measurement become less subjective than manual segmentations from scratch. The automatic suggestions may help to achieve segmentations more consistent with guidelines used to segment the training data. For example, in the case of Patient10 from Table 3, routinely segmented livers did not include a large lesion in the liver mask, which was not the case for the reference and both corrected segmentations (seeFig 6). Only RA, who also created reference segmentations, was able to achieve a significant quality improvement of cor-rected masks according to DICE, RVE, and MSD when compared to the automatic Liver-Net
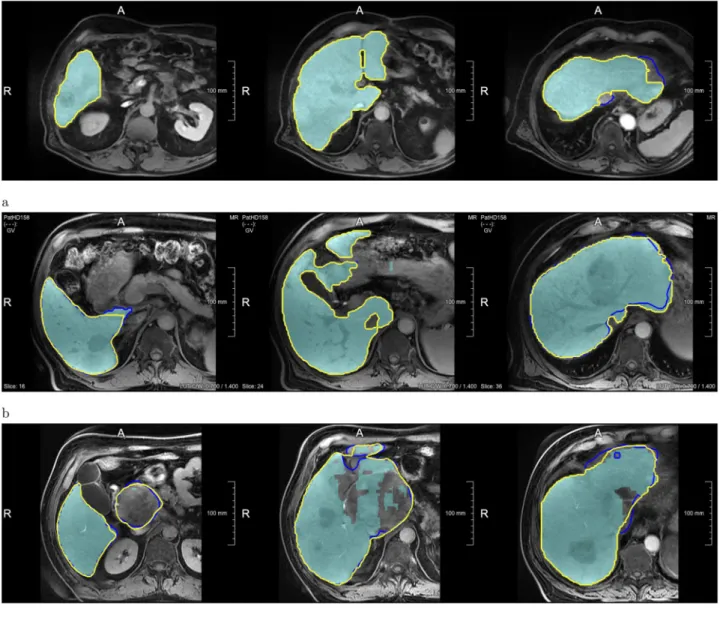
Fig 6. Examples showing how the automatic Liver-Net results (cyan) were corrected. The contours denote corrected liver masks by Res3 (blue) and RA (yellow). (a) Case with minor or no corrections: 1.42% for the Liver-Net liver masks, 1.51% (4.3%) and 1.42% (0%) RVE (CS) for the corrections by Res3 and RA, respectively. (b) Case where less than half of all slices were corrected: 5.66%, 5.57% (47.6%) and 5.40% (35.7%). (c) Case where most of the slices were corrected by all observers: 11.48%, 1.62% (74.0%) and 0.10% (78.3%).
Fig 7. Box plots showing mean absolute inter-observer relative volume difference for routine and corrected automatic segmentations. SeeTable 3for RVE values of all observers.
https://doi.org/10.1371/journal.pone.0217228.g007
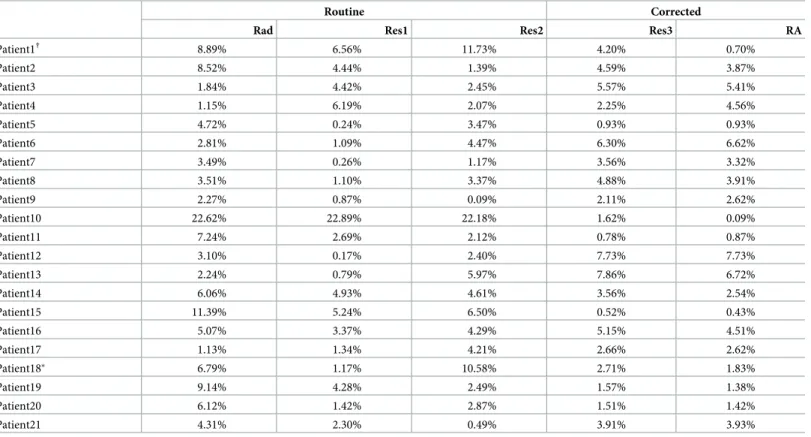
Table 3. Per patient relative volume error for routine and corrected automatic segmentations.
Routine Corrected
Rad Res1 Res2 Res3 RA
Patient1† 8.89% 6.56% 11.73% 4.20% 0.70% Patient2 8.52% 4.44% 1.39% 4.59% 3.87% Patient3 1.84% 4.42% 2.45% 5.57% 5.41% Patient4 1.15% 6.19% 2.07% 2.25% 4.56% Patient5 4.72% 0.24% 3.47% 0.93% 0.93% Patient6 2.81% 1.09% 4.47% 6.30% 6.62% Patient7 3.49% 0.26% 1.17% 3.56% 3.32% Patient8 3.51% 1.10% 3.37% 4.88% 3.91% Patient9 2.27% 0.87% 0.09% 2.11% 2.62% Patient10 22.62% 22.89% 22.18% 1.62% 0.09% Patient11 7.24% 2.69% 2.12% 0.78% 0.87% Patient12 3.10% 0.17% 2.40% 7.73% 7.73% Patient13 2.24% 0.79% 5.97% 7.86% 6.72% Patient14 6.06% 4.93% 4.61% 3.56% 2.54% Patient15 11.39% 5.24% 6.50% 0.52% 0.43% Patient16 5.07% 3.37% 4.29% 5.15% 4.51% Patient17 1.13% 1.34% 4.21% 2.66% 2.62% Patient18� 6.79% 1.17% 10.58% 2.71% 1.83% Patient19 9.14% 4.28% 2.49% 1.57% 1.38% Patient20 6.12% 1.42% 2.87% 1.51% 1.42% Patient21 4.31% 2.30% 0.49% 3.91% 3.93%
Case with the highest inter-observer variability among manual routine�and corrected†
segmentations: 6.27% and 3.50%, respectively.
segmentations. The consistency among observers measured as ICC(2,1) for manual (0.989) and corrected (0.999) segmentations was excellent and similar to the inter-observer correlation reported for CT (0.997) [20].
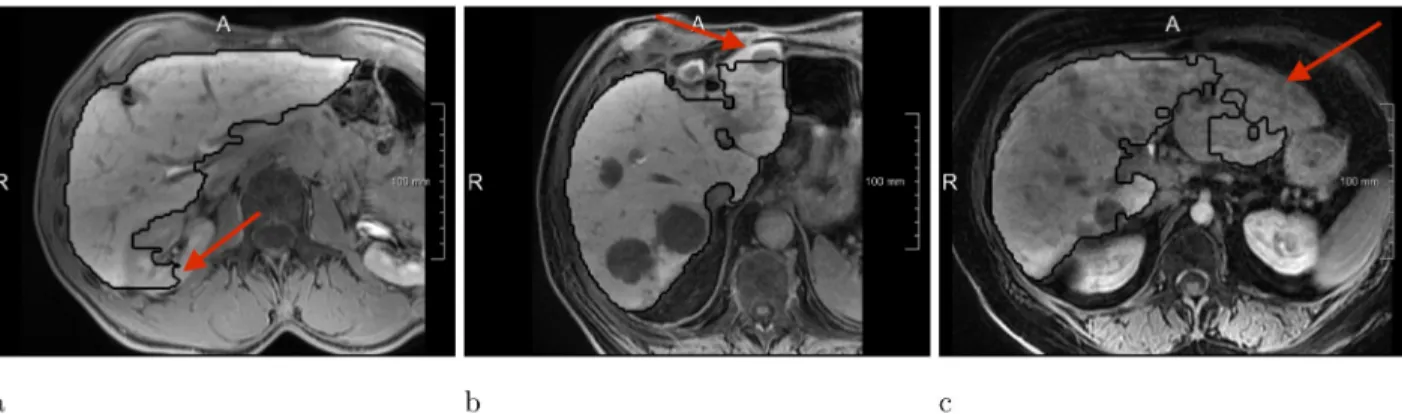
We asked an expert radiologist to analyze visually how the liver masks produced by Liver-Net were corrected by observers and the following factors causing major segmentations were identified (seeFig 8for error examples):
• Contrast changes causing FPs and FNs due to lesions located near the organ surface or con-trast enhanced vessels.
• Large inhomogeneous lesions leading to liver underestimation.
• Similar intensities of surrounding nearby organs cause FPs (e.g., kidneys and stomach).
Comparison with other methods
The segmentation quality of the Liver-Net evaluated using a challenging data set consisting of pathological livers with numerous tumors was 0.95 according to DICE, which is better than other methods in the literature reporting DICE in the 0.87-0.91 range [4–7]. Unfortunately, a direct comparison is not possible, as different datasets were used for method optimization and evaluation.
Liver-Net, in contrast to approaches employing shape models [4–6], does not contain an explicit knowledge about plausible liver forms. Therefore, in some cases, it produces segmenta-tions that do not completely resemble a liver (Fig 8a). On the other hand, the lack of a shape prior allows for a correct segmentation of livers strongly deviating in form from a normal liver shape (e.g., resected liver,Fig 9). Compared to the approach of Christ et al. [7] where only one axial 2D CNN was used, Liver-Net uses three orthogonal models, which allow our method to exploit the 3D context information of volumetric MR images.
Study limitations
The test set size (21 images) should be taken into account when considering the conclusions of this work, as the small sample size limits the accuracy of the statistical analysis.
Conclusion
We presented a validation of a fully automatic method dubbed Liver-Net for liver segmenta-tion in MRI based on three orthogonal neural networks and its corrected masks. The
Fig 8. Most common error types of the Liver-Net approach. (a) Leakage into surrounding structure of similar image intensity. (b) FNs due to lesions located near the organ boundary. (c) Liver underestimation caused by a big inhomogeneous lesion.
comparison with manual routine segmentations provided by three clinical users showed that Liver-Net produces liver masks of a comparable quality according to Dice index, relative vol-ume error, mean surface distance, and Hausdorff distance. Error analysis of the Liver-Net showed that, on average, 32% of slices had to be corrected, which required on average 2 min-utes of interaction time. Corrected liver masks led to a significantly lower inter-observer vari-ability when compared to manual segmentations from scratch (0.69% vs. 2.75% for mean per-case absolute inter-observer RVE difference and 0.999 vs. 0.989 for the intra-class correlation coefficient). We identified the following factors as sources of major errors of our method: con-trast changes close to organ boundary, inhomogeneous lesions and similar appearance of sur-rounding structures. Successful automated elimination of these errors would most probably lead to a substantial improvement in segmentation quality. One possible solution to this may be the extension of the training dataset with cases causing the above-mentioned errors. Addi-tionally, a hard example mining strategy could be employed, which concentrates the learning process on the most difficult cases.
Future research directions include usage of 3D neural networks exploiting the full volumet-ric context information, GAN models for generation of training data [21] and combination of CNNs with statistical shape knowledge [22].
Acknowledgments
We would like to thank Christiane Engel, Andrea Koller, Sergio Mercogliano and Claudia Bo¨hme for providing feedback and manual segmentations and Susanne Diekmann for the help in the error analysis. The work was funded by the Fraunhofer-Gesellschaft. The Titan Xp used for this research was donated by the NVIDIA Corporation.
Author Contributions
Conceptualization: Grzegorz Chlebus, Smita Thoduka.
Data curation: Grzegorz Chlebus, Smita Thoduka, Nasreddin Abolmaali. Funding acquisition: Andrea Schenk.
Project administration: Andrea Schenk.
Fig 9. Resected liver case, where the Liver-Net method (black) produced segmentation consistent with the reference (white): 3% RVE and 0.95 DICE.
Software: Grzegorz Chlebus, Hans Meine.
Supervision: Hans Meine, Bram van Ginneken, Horst Karl Hahn, Andrea Schenk. Validation: Grzegorz Chlebus.
Writing – original draft: Grzegorz Chlebus.
References
1. Nakayama Y, Li Q, Katsuragawa S, Ikeda R, Hiai Y, Awai K, et al. Automated hepatic volumetry for liv-ing related liver transplantation at multisection CT. Radiology. 2006; 240(3):743–748.https://doi.org/10. 1148/radiol.2403050850PMID:16857979
2. Kennedy A, Coldwell D, Sangro B, Wasan H, Salem R. Radioembolization for the treatment of liver tumors: general principles. American journal of clinical oncology. 2012; 35(1):91–99.https://doi.org/10. 1097/COC.0b013e3181f47583PMID:22363944
3. Gotra A, Chartrand G, Vu KN, Vandenbroucke-Menu F, Massicotte-Tisluck K, de Guise JA, et al. Com-parison of MRI-and CT-based semiautomated liver segmentation: a validation study. Abdominal Radiol-ogy. 2017; 42(2):478–489.https://doi.org/10.1007/s00261-016-0912-7PMID:27680014
4. Bereciartua A, Picon A, Galdran A, Iriondo P. Automatic 3D model-based method for liver segmentation in MRI based on active contours and total variation minimization. Biomedical Signal Processing and Control. 2015; 20:71–77.https://doi.org/10.1016/j.bspc.2015.04.005
5. Le TN, Huynh HT, et al. Fully automatic scheme for measuring liver volume in 3D MR images. Bio-medi-cal materials and engineering. 2015; 26(s1):1361–1369.https://doi.org/10.3233/BME-151434
6. Huynh HT, Le-Trong N, Oto A, Suzuki K, et al. Fully automated MR liver volumetry using watershed segmentation coupled with active contouring. International journal of computer assisted radiology and surgery. 2017; 12(2):235–243.https://doi.org/10.1007/s11548-016-1498-9PMID:27873147
7. Christ PF, Ettlinger F, Gru¨n F, Elshaera MEA, Lipkova J, Schlecht S, et al. Automatic liver and tumor segmentation of ct and mri volumes using cascaded fully convolutional neural networks. CoRR. 2017; abs/1702.05970.
8. Bilic P, Christ PF, Vorontsov E, Chlebus G, Chen H, Dou Q, et al. The Liver Tumor Segmentation Benchmark (LiTS). CoRR. 2019;abs/1901.04056.
9. Yuan Y. Hierarchical Convolutional-Deconvolutional Neural Networks for Automatic Liver and Tumor Segmentation. CoRR. 2017;abs/1710.04540.
10. Li X, Chen H, Qi X, Dou Q, Fu CW, Heng PA. H-DenseUNet: Hybrid Densely Connected UNet for Liver and Tumor Segmentation From CT Volumes. IEEE Transactions on Medical Imaging. 2018; 37:2663– 2674.https://doi.org/10.1109/TMI.2018.2845918PMID:29994201
11. Chlebus G, Schenk A, Moltz JH, van Ginneken B, Hahn HK, Meine H. Automatic liver tumor segmenta-tion in CT with fully convolusegmenta-tional neural networks and object-based postprocessing. Scientific reports. 2018; 8(1):15497.https://doi.org/10.1038/s41598-018-33860-7PMID:30341319
12. He B, Huang C, Sharp G, Zhou S, Hu Q, Fang C, et al. Fast automatic 3D liver segmentation based on a three-level AdaBoost-guided active shape model. Medical Physics. 2016; 43(5):2421–2434.https:// doi.org/10.1118/1.4946817PMID:27147353
13. Shi C, Cheng Y, Wang J, Wang Y, Mori K, Tamura S. Low-rank and sparse decomposition based shape model and probabilistic atlas for automatic pathological organ segmentation. Medical image anal-ysis. 2017; 38:30–49.https://doi.org/10.1016/j.media.2017.02.008PMID:28279915
14. Schenk A, Prause G, Peitgen HO. Efficient semiautomatic segmentation of 3D objects in medical images. In: International Conference on Medical Image Computing and Computer-Assisted Interven-tion. Springer; 2000. p. 186–195.
15. Prasoon A, Petersen K, Igel C, Lauze F, Dam E, Nielsen M. Deep feature learning for knee cartilage segmentation using a triplanar convolutional neural network. In: International conference on medical image computing and computer-assisted intervention. Springer; 2013. p. 246–253.
16. Ronneberger O, Fischer P, Brox T. U-net: Convolutional networks for biomedical image segmentation. In: International Conference on Medical image computing and computer-assisted intervention. Springer; 2015. p. 234–241.
17. Drozdzal M, Vorontsov E, Chartrand G, Kadoury S, Pal C. The importance of skip connections in bio-medical image segmentation. In: Deep Learning and Data Labeling for Medical Applications. Springer; 2016. p. 179–187.
18. Weiler F, Chlebus G, Rieder C, Moltz JH, Warning A, Brachmann C, et al. Building Blocks for Clinical Research in Adaptive Radiotherapy. In: Proceedings of CURAC 2015; 2015. p. 139–144.
19. Portney L, Watkins M. Foundations of clinical research: application to practice. Stamford, USA: Apple-ton & Lange. 1993.
20. Sandrasegaran K, Kwo P, DiGirolamo D, Stockberger S Jr, Cummings O, Kopecky K. Measurement of liver volume using spiral CT and the curved line and cubic spline algorithms: reproducibility and interob-server variation. Abdominal imaging. 1999; 24(1):61–65.https://doi.org/10.1007/s002619900441
PMID:9933675
21. Frid-Adar M, Diamant I, Klang E, Amitai M, Goldberger J, Greenspan H. GAN-based synthetic medical image augmentation for increased CNN performance in liver lesion classification. Neurocomputing. 2018; 321:321–331.https://doi.org/10.1016/j.neucom.2018.09.013
22. Milletari F, Rothberg A, Jia J, Sofka M. Integrating Statistical Prior Knowledge intoAˆ Convolutional Neu-ral Networks. In: Descoteaux M, Maier-Hein L, Franz A, Jannin P, Collins DL, Duchesne S, editors. Medical Image Computing and Computer Assisted Intervention—MICCAI 2017. Cham: Springer Inter-national Publishing; 2017. p. 161–168.