Coherency Identification in Interconnected Power
System - An Independent Component Analysis
Approach
M. A. M. Ariff, Student Member, IEEE, and B. C. Pal, Senior Member, IEEE
Abstract—This paper presents a novel approach to the
coh-erency identification technique in interconnected power system using independent component analysis (ICA). The ICA is applied to the generator speed and bus angle data to identify the coherent areas of the system. The results of the application of ICA using simulated data from 16-machine 68-bus system model and on data gathered through UK University-based Wide-Area Measurement System are presented. The approach is able to identify the cluster of generators and buses following a disturbance in the system. It is also demonstrated that the approach is robust in the presence of noise in measured signal, which is an important factor to be considered for assessing the effectiveness of any measurement-based technique.
Index Terms—Coherency identification, wide-area
measure-ment, measurement-based, independent component analysis, power system
I. INTRODUCTION
I
NTERCONNECTED power networks have suffered fromcascading blackouts over the decades with obvious socio-economic consequences. The instances of large blackouts have increased in the last 10 years leading to setting up various task forces, advisory groups, research programmes, network operating standard etc. across the world. One award winning task force formed by the IEEE Power and Energy Society (PES) has produced a very detail report in [1]. One important recommendation of the task force is for controlled island-ing through special protection scheme (SPS). The controlled islanding minimises the spread and impact of blackouts by splitting the entire networks into several sustainable islands. The SPS technology exists and is also being rolled out in various networks [2]. One important aspect is to determine the effective set of islands which are stable and sustainable. It is understood that each island consists of dynamically coherent group of generators and loads. So it is essential to identify coherent groups first in order to construct islands. The classical synchronous generator dynamic model (swing equations only) has been used to find coherent islands for known set of genera-tion, demand and network configuration [3]. With the changes in system operating condition and network configuration, the elements in the set of coherent generators and buses tend to vary. Furthermore, the accuracy of the system parameters (generator, loads and networks) influences the accuracy of
M.A.M. Ariff and B.C. Pal are with the Department of Electrical and Electronics Engineering, Imperial College London, SW7 2AZ London, U.K. email:([email protected]; [email protected]; [email protected]; [email protected])
the technique to obtain coherent islands in the system. These concerns motivated the researchers to look for based coherency identification tools. In the measurement-based techniques, all the system quantities and variables such as generator speed, output power, voltage at all nodes are measured continuously and a snapshot is utilised to find the coherent groups. The technology of wide-area measurement [4] is available to get the data across the whole network measured with time synchronous stamping. It transmits the data to the transmission control centre in milliseconds time scale so that the tools to identify coherency has input data available in less than a second’s time interval.
The objective of this paper is to identify the coherent areas of power system network by analysing the measured data obtained from the system. The method is based on multivariate analysis of the signals, using independent component analysis (ICA). In order to demonstrate the effectiveness of proposed approach in identifying the coherent group of generators and buses, 16-machine 68-bus test system model is used to generate the measured data using Matlab Simulink. Like other existing methods, the proposed method is able to identify the correct coherency group of generators and buses in the system. The ICA is preferred compared to the other methods because it is simple, accurate, and robust in filtering out the effect of noise in practical measured signals.
The paper is organised as follows: Section II describes the state of the art in coherency identification techniques. Section III explains the coherency identification technique through Direction Cosine and Principal Component Analysis (PCA). These techniques are used for comparison. Section IV elucidates the approach used to utilize ICA for coherency identification in interconnected power system. Subsequently, the proposed approach is applied to measurement data sim-ulated from 16-machine 68-bus system model and actual WAMS data gathered through UK University-based Wide-Area Measurement System. The results obtained are analysed and discussed in Section V. In Section VI, the results obtained using proposed method is validated and compared with the results obtained using the direction cosine and PCA approach. Additionally, the performance robustness of the proposed algorithm to measurement noise is also tested.
II. STATE OF THEART
The initial aim of coherency groupings of generators and buses is to aid the dynamic reduction of the models [5], [6],
[7]. It is useful for the computational convenience. Researchers in [3], [8] have used model-based approach. It is based on the eigenvalue analysis of the linearised model of the system. The accuracy of this method is reliable if the knowledge of the prevailing system condition and various parameters are precise. In practice, it is not always possible. Besides, small variations of load and generation have insignificant impact on the coherent group of generators [9]. However, the changes in topology and significant load variation influence the “loosely coherent” generators switching from one group to the other. Hence, as the operating condition and system topology vary noticeably with time, the coherent areas need to be tracked. Reference [10] has addressed this issue through continuation method. Besides being model-based, it is also computationally intensive.
The accuracy of the measurement-based coherency iden-tification techniques does not rely on the accuracy of the system parameters. There are several references in the liter-ature on the measurement-based coherency identification. The methodologies underlying these approaches are diverse, e.g. artificial neural network (ANN) [11], particle swarm optimiza-tion and k-means (PSO-KM) algorithm [12], graph theory [13], partitioning around medoids (PAM) [14], hierarchical clustering [15], self-organizing feature maps [16], Fast-Fourier transform (FFT) [17], [18], Hilbert-Huang transform (HHT) [19] and Principal Component Analysis (PCA) [20], [21]. Despite having the advantages over model-based approaches, these techniques have some limitations, for instance, the ANN algorithm requires excessive off-line training data to train the neural network in order to identify the coherent generators. The PSO-KM, graph theory based and PAM algorithms on the other hand suffer from high computation burden in order to achieve coherent groups of generator in the system reasonably fast. The FFT approach has been used to determine coherent areas of power system but this technique assumes that the system is linear and the data results from a stationary process, which is usually not the case in practice. The HHT provides solution to non-linear and non-stationary process, however, it is difficult to visualise the coherent groups of generators using the proposed approach for large power system. The PCA approach requires a priori additional information of dynamic characteristics of the system to identify the coherent group of generators accurately [20], [21].
Although some of the measurement-based coherency iden-tification methods in the literature are reliable in clustering the coherent group of generators in near real time, none of these approaches demonstrate their accuracy and robustness in the presence of noise. The existence of noise in measured signals affects the accuracy of the coherency identification technique. This is an important issue because the measured signals from the system have significant noise. Hence, it is important to ensure that the coherency identification technique is robust in the presence of measurement noise in the signals.
III. COHERENCY IN INTERCONNECTED POWER SYSTEM
Power system network is formed by the interconnection of two or more commercial areas through inter utility trans-mission links. After a system disturbance, some generators
in the interconnected power system have tendency to swing in unison. These generators are clustered into a coherent group, which has fairly similar time-domain response trends. The coherent groups of generators are formed by identifying the closely coupled generators from the angle component of the eigenvectors related to low frequency electromechanical oscillatory mode of the system, known as inter-area mode. However, it is difficult to ascertain the coherent groups of generators by the visual inspection of the eigenvectors of the system.
Alternatively, the coherent areas in the power network can be determined by observing the generator rotor angle and bus voltage, which have most consistent pattern over all the inter-area modes. This is realized with the help of the direction cosine method [3]. The direction cosine method works on the assumption that the coherent groups of generators are relatively insensitive to the disturbance. Hence, the coherent groups of generators are formed by performing the eigenvalue analysis of the linearised model of the system in order to obtain the rows of the eigenvectors corresponding to the generator angle. Then, these rows of the eigenvectors are used to calculate the direction cosine with respect to the inter-area mode of oscillation. The phase angle of the eigenvectors for coherent groups of generators are close to each other. The two coherent groups have more than 90 degrees of angle separating them. Although this technique has a strong theoretical founda-tion of coherency identificafounda-tion, implementing such technique requires very accurate model of the study system.
On the other hand, the measurement-based methods, cluster coherent groups of generators and buses by analysing the measured signals obtained from the networks. The approach proposed in [20], [21] used a multivariate analysis technique called Principal Component Analysis (PCA). It is used to identify the coherent groups of generators and buses, hence coherent areas of the interconnected power system. PCA highlights the clusters of generators and buses displaying common features in the measurements. However, the approach is unable to identify the accurate coherent areas without the priori information of inter-area mode of the system. Hence, the PCA method requires the assistance of Hilbert transform (HT) technique and empirical mode decomposition (EMD) to extract the instantaneous attributes of inter-area oscillations. The method is simple and does not require detailed system modelling information. The approach accurately identifies the coherent areas of the system through visual inspection of the three-dimensional coherency plot. However, its performance in the presence of noise in the measurement is inconsistent.
In this paper, the coherent groups of generators and buses are obtained by analysing the measurements using ICA, a multivariate analysis tool that is better than PCA. The ICA extracts a set of independent signals from its input signals while PCA finds a set of uncorrelated signals from a set of mixtures. Lack of correlation is a weaker property
than the independence. Independence implies a lack of correlation but a lack of correlation does not imply independence. This advantage allows better extraction of frequency components from the measured signals. Thus, the
and buses without prior knowledge of modal characteristic of the system. The technique is completely data driven and adaptive.
The direction cosine and PCA approaches will be used to compare the results obtained using the ICA method proposed in this paper.
IV. COHERENCYIDENTIFICATION USINGICA
The ICA is a data driven computation technique that re-covers a set of data, without any prior information about either the sources or the mixing parameters of the system that has the data as its output. The ICA seeks to estimate the sources by assuming that the output are dominated by a set of hidden sources which are statistically independent of each other and contribute to each output. Unlike other multivariate analysis techniques, the ICA looks for components that are both statistically independent and non-Gaussian. The ICA has earlier been used to compute the damping and frequency of low oscillatory mode in power system [22].
In this paper, a special type of ICA called spectral ICA is used to identify the coherent areas in interconnected power system. In spectral ICA, different independent components (ICs) consist of different spectral peaks. A component with a single spectral peak is more dominant in terms of non-Gaussianity than a component with multiple peaks. Thus, max-imising the non-Gaussianity of ICs in spectral ICA will result in the preferential decomposition of single-peak and narrow-band ICs. A spectrum can be extracted into a combination of spectrum-like and single-peak ICs by means of spectral ICA. The spectral ICA uses normalised power spectra of the measured time trend signals in the analysis such that each of the resulting estimated source or IC, is a narrowband spectrum with one sharp peak in the frequency domain. Each IC corresponds to a frequency of the estimated oscillatory source. Hence, the ICA decomposition on the power spectra of signal, sampled at different measurement points, is able to separate the measured signals into their various frequency components. The extraction of the dominant narrow-band peaks from the power spectra of the signal using the spectral ICA is superior to the extraction of the oscillatory sources by time-domain ICA. This is because, the spectral ICA is invariant to the time delays and phase lags, unlike the time-domain ICA [23].
There are other means of obtaining dominant mono-fre-quency components for the signals such as masking signal-based Empirical Mode Decomposition (EMD) [24] or other band-pass filtering techniques. The advantage of spectral ICA is it does not require a priori knowledge of the modes present in the signal. Spectral ICA decomposes the entire frequency spectrum of the signals into the mono-frequency components for further analysis. The main aim of this approach is to determine independent sources of similar spectral signature, which represent slow oscillatory modes of the system.
The row vectors of data matrix for the spectral ICA model, are single sided power spectra of the mean centred time trends over a range of frequency, up to the Nyquist frequency:
X(f) = P1(f1) · · · P1(fN) .. . . .. ... Pm(f1) · · · Pm(fN) (1)
The power spectrum can be obtained using Discrete Fourier Transform (DFT) to the mean centred time trend. Then, each power spectrum is normalised such that:
N
X
k=1
Pi(fk) = 1, i= 1,2,· · ·m (2)
Each vector in X is a linear mixture of hidden and inde-pendent process. Each process forms a row vector inS. Each row inSis an IC. These processes are represented by an ICA mixing model given by:
X(f) =Am×n s1 s2 .. . sn =Am×nS (3)
Where, A is an unknown m ×n matrix of full rank,
called the mixing matrix. The main aim of ICA is then to estimate S and the mixing matrix, A from the observed normalised power spectrum,X. Estimating the mixing matrix
Acan be simplified by performing a preliminary sphering or prewhitening the observed data, X. The observed data X is linearly transformed toV given by:
V=MX=MAS=BS (4)
The correlation matrixE{VVT}equals unity which means that the elements ofVare mutually uncorrelated. The problem of finding an arbitrary full-rank matrixAhas been reduced to the simpler problem finding an orthogonal matrixB. If thei -th column ofBis denoted bybi, thei-th IC can be computed
from the observed Vas:
si= (bi)TV (5)
Fast fixed algorithm [25] is used to estimate the value of
bi which maximise the kurtosis of (bi)TV. This algorithm
uses a very simple yet highly efficient fixed point iteration technique.
However, the sign and magnitude of the ICs obtained are not unique. So, additional constraints are imposed to the ICA mixing model for physically meaningful results. All ICs are adjusted to have positive peak values to enhance visualisation. The mixing matrix is also scaled so that the relationships between the spectral signatures and ICs are easily identified. A. Sign modification
The sign of the ICs is first manipulated, by imposing additional constraints on the ICs and incorporate this intoAto preserve the original relationships. Now, the spectral signitures are represented as:
where,
Q=Adiag(SN1, SN2, . . . , SNn) (7a)
P=diag(SN1, SN2, . . . , SNn)S (7b)
TheSNj(j= 1, . . . , n) represents the sign of the dominant peak of every ICs. The main reason for doing this sign modification is because the amplitude of a physical oscillation sources is positive by definition. Hence, it must have a positive magnitude in the frequency domain.
B. Scaling
The modified mixing matrix, Q, represents the relative ra-tios in which spectral source frequencies exist in the measured signals. However, it will be more meaningful, if the mixing ratio of one signal is relatively compared to the other signals for each spectral source. This is realised by normalising the maximum value of each column of Q= [q1 q2 . . . qn]
to unity as follow: T=Qdiag(∆−1 1 ,∆ −1 2 , . . . ,∆ −1 n ) (8a) C=diag(∆1,∆2, . . . ,∆n)P (8b) where, ∆j =kqjk∞, j= 1, . . . n (9) hence, X=TC (10)
C is the modified and sign corrected S. It is interesting to note that, each row of X is the weighted combination of all rows in C, which represent the ICs. Hence, X is the weighted combination of all ICs. The weight coming from the corresponding row element of T is used to plot the coherent groups of generators and buses in the system.
C. Order sorting
The order of the ICs is inconsistent every time the algorithm converges [26]. The reason is, both ICs and mixing matrix are unknown and can freely change from one convergence run to another. This affects the performance of the algorithm in order to visualise the coherency property of the system. To deal with this issue, the ICs (after peak adjustment and scaling) are sorted according to their dominance. In order to visualize the system coherent groups in three-dimensional spaces, only three most dominant ICs are being considered. Now, the ICA decomposition is represented using the following equation:
X= t1,1 .. . ti,1 c ′ 1+ t1,2 .. . ti,2 c ′ 2+ t1,3 .. . ti,3 c ′ 3+E (11)
The first part in (11) involving c′ 1, c
′ 2 and c
′
3 represents the
most dominant three ICs. Since visualization is restricted to maximum of three dimensions, only three most dominant ICs are considered. The last part, Erepresents the rest of the pro-cess. Although important, it could not be accommodated for visualization purposes. 3-tuple (ti,1, ti,2 and ti,3) is a point
in three-dimensional dominant IC space. The IC space has
the advantage of displaying coherent groups as tightly formed cluster. All 3-tuples from different rows ofTare plotted in the IC space. 3-tuples that are close to each other in the IC space represent coherent signals. Since each row represents a signal from a generator or bus, all the generators or buses captured in the cluster form the coherent groups. This formation of clus-ter is used to identify coherent area in a large inclus-terconnected power system. Apart from this graphical way of obtaining the coherent groups, there can be ways of obtaining them quanti-tatively such as through k-mean clustering approach [27] etc. However, the scope in this paper is limited to graphical means of representing coherency.
V. APPLICATION,RESULTS AND ANALYSIS
A. Application on simulated data
This section presents the application of the proposed method to a test system model. The 16-machine 68-bus system model is considered as the test system. The bus data, line data and dynamic characteristics of the system are in [3]. Fig. 1 shows the single line diagram of the system. Nonlinear simulations of the test system were performed in Matlab Simulink. The disturbance considered for this study was ten percent increment of mechanical input torque for 80 ms to each generator. Coherency being a slow post-fault dynamic process, a small perturbation will suffice to simulate them [28]. For coherency identification, the generator speed sig-nals from 16-machines subjected to the disturbance were recorded accordingly. Coherency primarily originates from the electromechanical swings of the generators following a disturbance. It extends beyond transient stability time scale of 3-5 seconds particularly in a large interconnected power system with poorly damped or undamped inter-area modes. In order to effectively monitor the system behaviour after a disturbance, typically a 20 seconds time window is adequate [29]. The choice of sampling frequency is also important. In this paper, 100 Hz was used as recommended in the recent IEEE Standard for Synchrophasor Measurements for Power Systems C37.118.1-2011 [30]. The time trends in Fig. 2 are used to construct the data matrix.
The proposed method was applied to the measured data, to obtain the matrices T andC in (10). Fig. 3 displays the three most dominant ICs of the system. Physically, the three most dominant ICs were the slowest mode of oscillation in the system. The peak ofIC1 was at 0.05 Hz, represents the stationary mode of the system, while IC2 and IC3, both
peaks at 0.34 Hz and 0.54 Hz respectively, represent low frequency inter-area mode of oscillations. The inclusion of stationary mode to identify the coherency is necessary [3], [8]. Each spectral signature of the machine speed data was the combination of one or more of these ICs. The columns of mixing matrix, T, represent the amount of each IC in each spectral signature of input data. The plot of the elements of
T in three-dimensional plot, helps to visualise the coherent groups in the system.
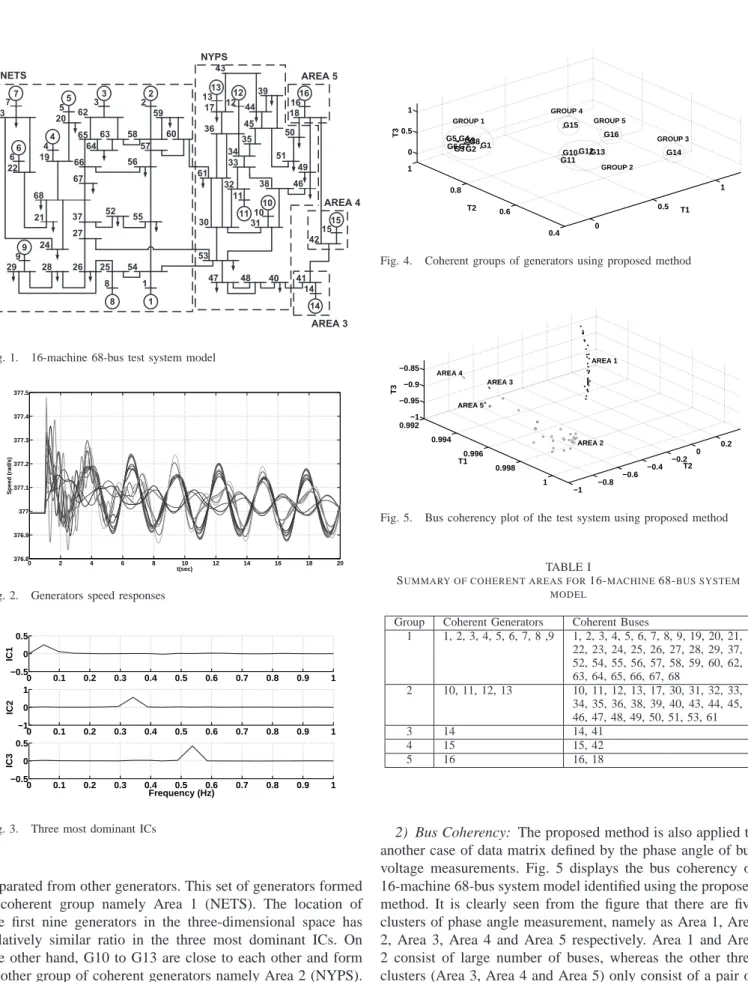
1) Generator Coherency: Fig. 4 shows the three-dimensional plot of the modified mixing matrix, T. It is observed that the first nine generators, G1 to G9 are well
7 23 6 22 4 5 3 20 19 68 21 24 37 27 26 28 29 9 62 65 66 67 63 64 52 55 2 58 57 56 59 60 25 8 1 54 53 47 30 61 36 17 13 12 11 32 33 34 35 45 44 43 39 51 50 18 16 38 10 31 46 49 48 40 41 14 15 42 NETS NYPS AREA 3 AREA 4 AREA 5 7 5 3 2 6 4 9 8 1 14 15 10 11 13 12 16
Fig. 1. 16-machine 68-bus test system model
0 2 4 6 8 10 12 14 16 18 20 376.8 376.9 377 377.1 377.2 377.3 377.4 377.5 t(sec) Speed (rad/s)
Fig. 2. Generators speed responses
0 0.1 0.2 0.3 0.4 0.5 0.6 0.7 0.8 0.9 1 −0.5 0 0.5 IC1 0 0.1 0.2 0.3 0.4 0.5 0.6 0.7 0.8 0.9 1 −1 0 1 IC2 0 0.1 0.2 0.3 0.4 0.5 0.6 0.7 0.8 0.9 1 −0.5 0 0.5 Frequency (Hz) IC3
Fig. 3. Three most dominant ICs
separated from other generators. This set of generators formed a coherent group namely Area 1 (NETS). The location of the first nine generators in the three-dimensional space has relatively similar ratio in the three most dominant ICs. On the other hand, G10 to G13 are close to each other and form another group of coherent generators namely Area 2 (NYPS). The other three equivalent machines: G14, G15 and G16 form three separate coherent groups namely Area 3, Area 4 and Area 5 respectively, at the far end of the three-dimensional plot. The cluster of coordinates of the mixing matrix, T in the three-dimensional plot represent the coherent groups of generators in the system.
0 0.5 1 0.4 0.6 0.8 1 0 0.5 1 T1 G14 G16 G13 G12 G11 G15 G10 G1 T2 G8 G2 G9 G3G7 G4 G6 G5 T3 GROUP 2 GROUP 3 GROUP 5 GROUP 4 GROUP 1
Fig. 4. Coherent groups of generators using proposed method
0.992 0.994 0.996 0.998 1 −1 −0.8 −0.6 −0.4 −0.2 0 0.2 −1 −0.95 −0.9 −0.85 T2 T1 T3 AREA 5 AREA 3 AREA 4 AREA 2 AREA 1
Fig. 5. Bus coherency plot of the test system using proposed method
TABLE I
SUMMARY OF COHERENT AREAS FOR16-MACHINE68-BUS SYSTEM MODEL
Group Coherent Generators Coherent Buses
1 1, 2, 3, 4, 5, 6, 7, 8 ,9 1, 2, 3, 4, 5, 6, 7, 8, 9, 19, 20, 21, 22, 23, 24, 25, 26, 27, 28, 29, 37, 52, 54, 55, 56, 57, 58, 59, 60, 62, 63, 64, 65, 66, 67, 68 2 10, 11, 12, 13 10, 11, 12, 13, 17, 30, 31, 32, 33, 34, 35, 36, 38, 39, 40, 43, 44, 45, 46, 47, 48, 49, 50, 51, 53, 61 3 14 14, 41 4 15 15, 42 5 16 16, 18
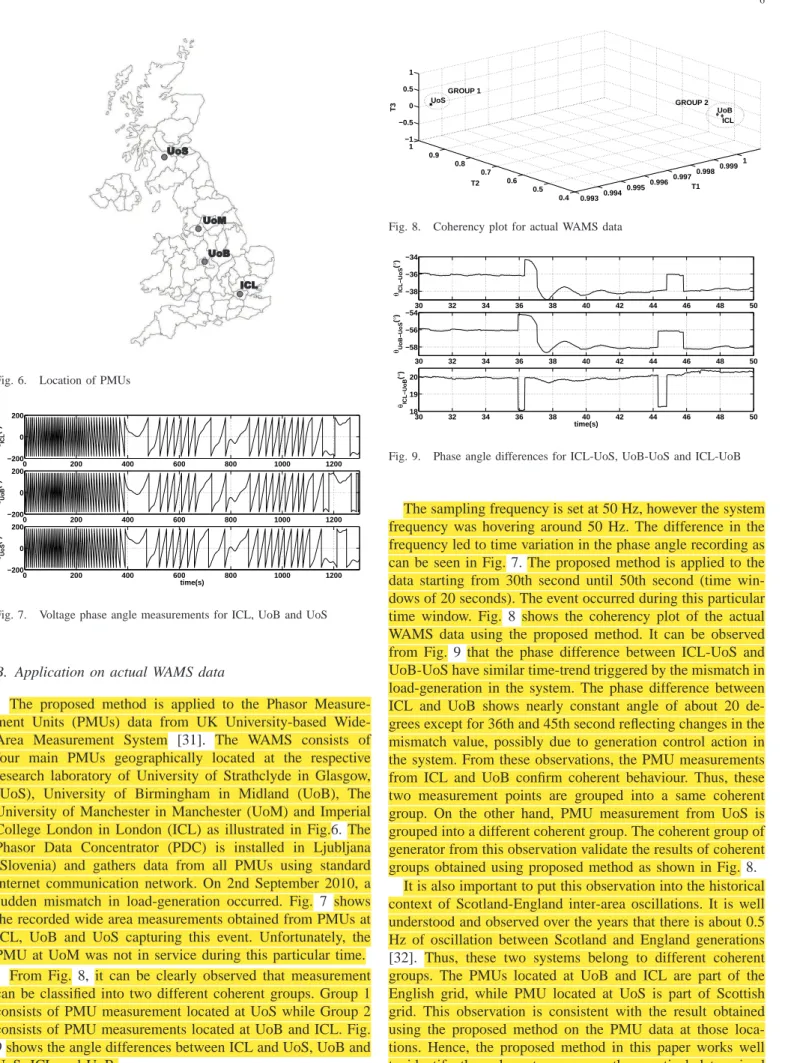
2) Bus Coherency: The proposed method is also applied to another case of data matrix defined by the phase angle of bus voltage measurements. Fig. 5 displays the bus coherency of 16-machine 68-bus system model identified using the proposed method. It is clearly seen from the figure that there are five clusters of phase angle measurement, namely as Area 1, Area 2, Area 3, Area 4 and Area 5 respectively. Area 1 and Area 2 consist of large number of buses, whereas the other three clusters (Area 3, Area 4 and Area 5) only consist of a pair of buses. It can be observed that some of the buses from Area 2 are moving towards Area 3. These buses demonstrate weak dynamic coupling with other buses in Area 2. It is also worth mentioning that, these buses are also electrically and physi-cally close with the buses in Area 3. Table I summarises the coherent area of the test system.
ICL UoB UoM UoS
Fig. 6. Location of PMUs
0 200 400 600 800 1000 1200 −200 0 200 θICL ( ° ) 0 200 400 600 800 1000 1200 −200 0 200 θUoB ( ° ) 0 200 400 600 800 1000 1200 −200 0 200 time(s) θUoS ( ° )
Fig. 7. Voltage phase angle measurements for ICL, UoB and UoS
B. Application on actual WAMS data
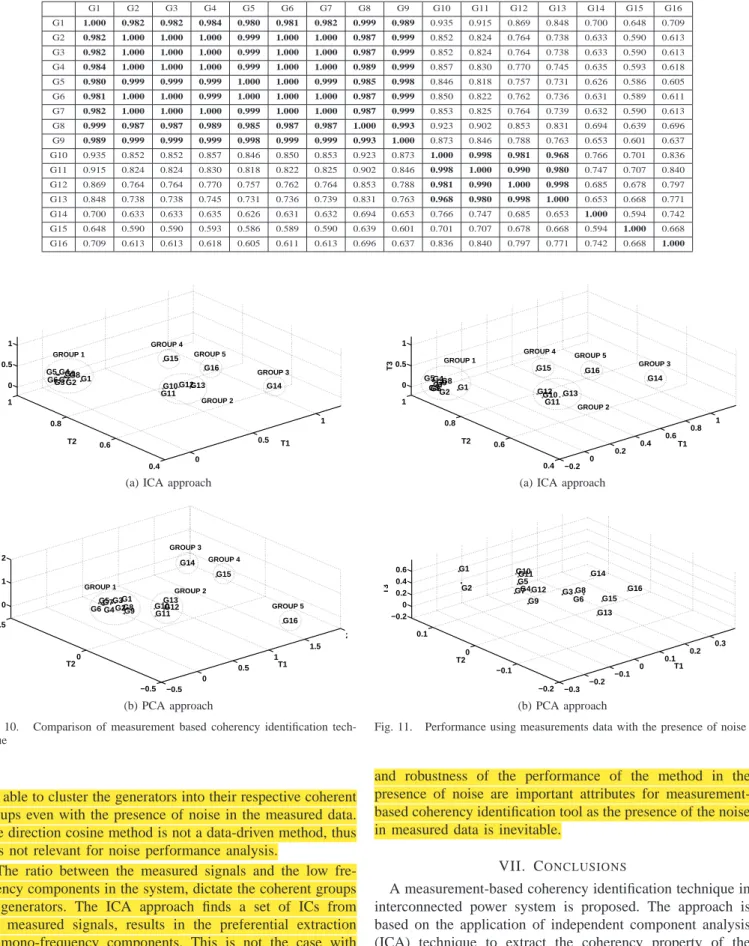
The proposed method is applied to the Phasor Measure-ment Units (PMUs) data from UK University-based Wide-Area Measurement System [31]. The WAMS consists of four main PMUs geographically located at the respective research laboratory of University of Strathclyde in Glasgow, (UoS), University of Birmingham in Midland (UoB), The University of Manchester in Manchester (UoM) and Imperial College London in London (ICL) as illustrated in Fig.6. The Phasor Data Concentrator (PDC) is installed in Ljubljana (Slovenia) and gathers data from all PMUs using standard internet communication network. On 2nd September 2010, a sudden mismatch in load-generation occurred. Fig. 7 shows the recorded wide area measurements obtained from PMUs at ICL, UoB and UoS capturing this event. Unfortunately, the PMU at UoM was not in service during this particular time.
From Fig. 8, it can be clearly observed that measurement can be classified into two different coherent groups. Group 1 consists of PMU measurement located at UoS while Group 2 consists of PMU measurements located at UoB and ICL. Fig. 9 shows the angle differences between ICL and UoS, UoB and UoS, ICL and UoB.
0.9930.994 0.9950.996 0.9970.998 0.9991 0.4 0.5 0.6 0.7 0.8 0.9 1 −1 −0.5 0 0.5 1 ICL UoB T1 T2 UoS T3 GROUP 1 GROUP 2
Fig. 8. Coherency plot for actual WAMS data
30 32 34 36 38 40 42 44 46 48 50 −38 −36 −34 θICL−UoS (° ) 30 32 34 36 38 40 42 44 46 48 50 −58 −56 −54 θUoB−UoS ( ° ) 30 32 34 36 38 40 42 44 46 48 50 18 19 20 time(s) θICL−UoB ( ° )
Fig. 9. Phase angle differences for ICL-UoS, UoB-UoS and ICL-UoB
The sampling frequency is set at 50 Hz, however the system frequency was hovering around 50 Hz. The difference in the frequency led to time variation in the phase angle recording as can be seen in Fig. 7. The proposed method is applied to the data starting from 30th second until 50th second (time win-dows of 20 seconds). The event occurred during this particular time window. Fig. 8 shows the coherency plot of the actual WAMS data using the proposed method. It can be observed from Fig. 9 that the phase difference between ICL-UoS and UoB-UoS have similar time-trend triggered by the mismatch in load-generation in the system. The phase difference between ICL and UoB shows nearly constant angle of about 20 de-grees except for 36th and 45th second reflecting changes in the mismatch value, possibly due to generation control action in the system. From these observations, the PMU measurements from ICL and UoB confirm coherent behaviour. Thus, these two measurement points are grouped into a same coherent group. On the other hand, PMU measurement from UoS is grouped into a different coherent group. The coherent group of generator from this observation validate the results of coherent groups obtained using proposed method as shown in Fig. 8.
It is also important to put this observation into the historical context of Scotland-England inter-area oscillations. It is well understood and observed over the years that there is about 0.5 Hz of oscillation between Scotland and England generations [32]. Thus, these two systems belong to different coherent groups. The PMUs located at UoB and ICL are part of the English grid, while PMU located at UoS is part of Scottish grid. This observation is consistent with the result obtained using the proposed method on the PMU data at those loca-tions. Hence, the proposed method in this paper works well to identify the coherent groups on the practical data mixed
with inherent noise obtained through university-based wide-area measurement system.
Eventually, all of the transmission substations in the UK grid are expected to have PMU commissioned. It will be possible, under that situation, to obtain full bus and generator coherency groups which will be useful for the National Grid, the grid operator in the UK, for any pro-active control decision.
VI. COMPARISON WITH OTHER METHODS
In this section, the accuracy of the coherent groups, ob-tained using the ICA method is compared with the results obtained using model-based direction cosine method [3] and measurement-based PCA approach [20], [21]. The PCA ap-proach will also be used to demonstrate the impact of noise towards the accuracy of the measurement-based coherency identification. Using identical operating condition, the 16-machine 68-bus test system model is used for this evaluation.
A. Direction Cosine
In direction cosine, the coherent generators are identified by observing the entries in coherency matrix that have direction cosine close to unity. The difference between the direction cosine of one generator to the other generator that belong to the same coherent group is very small. But, if the differ-ence is quite noticeable, the two generators will belong to different groups. From the eigenvalue analysis of linearised system model, the rows of the eigenvectors correspond to the generator angle state variables with respect to the slow modes of oscillations, having the same length,n, the direction cosine is defined as: dcv= Pm i=1w1iw2i pPp i=1w 2 1i Pp i=1w 2 2i (12) Generators belonging to the same coherent group will have angle of w close to each other. When normalised by the dominator in (12), dcv for each generator will be closed to unity. The details can be found in [3].
B. Principal Component Analysis (PCA)
The PCA is applied to decompose the measured data ofX
into several orthogonal time trends, W′
. These time trends are multi-mode components. The PCA decomposition of the measured data alone is insufficient to find accurate groups of coherent generators. Thus, the PCA requires additional infor-mation of dynamic characteristics of the system. Combination of Hilbert Transform and Empirical Mode Decomposition (EMD) has been used to obtain the information. HT-EMD extract these dynamic characteristics of the system from the measured data. Frequency, phase and damping (dynamic characteristics) are used to truncate the PCA description as follows, X=TW′ =T(RM′ ) =TnM ′ =Tn c1 .. . ck (13) where, cj(t) =e −ζ2πfnt cos((2πfn p 1−ζ2) + φ) (14) For j = 1,2, . . . k, fn, φ and ζ represent the frequency,
phase and damping of the system modes, respectively. C. Comparison
For measurement-based approach (PCA and ICA), the machine speed signals of 16-machine 68-bus system model sampled at every 10 ms for 20 s were used as the input. Ten percent increment of mechanical torque for 80 ms disturbance was considered for this study. The results obtained using proposed method is given in Fig. 10b, while the coherent generators groups acquired using the PCA approach is given in Fig. 10a. The coherency matrix obtained using the direction cosine method is given in Table II.
In Fig. 10a, it is shown that the ICA method proposed in this paper, clustered the test system into five coherent groups of generators. First nine generators (G1 to G9) form a group of coherent generators, while G10 to G13 form another group of generators. The other three generators, G14, G15, and G16 each forms a single coherent group. Similar groups of coherent generators can be observed in Fig. 10b, where PCA approach is used to identify coherent groups in the system, based on the generator speed data. The coherency matrix obtained using direction cosine method in Table II also segregates the system into five different groups of coherent generators. The five groups are in bold.
Results show that the proposed ICA method, clustered the system into five coherent groups of generators. This implies that, the results obtained using coherency identification tech-nique proposed in this paper, matches with the coherent groups of generators obtained in measurement-based PCA technique and model-based direction cosine method.
D. Performance under noise
The effectiveness of any data-driven method is very much influenced by the noise present in the data. It is worthwhile to assess the performance of the ICA and PCA in the presence of noise. The same measured data are used for this study with the addition of white Gaussian noise with Signal-to-Noise Ratio (SNR) of 25. Both PCA and ICA are used to identify coherent groups of generators after the disturbance.
Fig. 11a shows the coherency plot obtained with the ICA method, while Fig. 11b shows the coherency plot obtained with the PCA method. The results indicate that the PCA method shows limitation in identifying the same coherent groups of generators with the presence of noise in the measured data. Since the choice of SNR=25 is arbitrary, the test is repeated using different values of SNR. It is observed with SNR=50, the PCA method produces visibly better coherent clusters than it does with SNR=25. The visibility of the coherent clusters produced by the ICA is not affected by the level of noise in the data. This demonstrates that the noise in measured signals has significant influence in the results of measurement-based coh-erency identification technique. Nevertheless, it can be noticed that the coherency plot of ICA approach proposed in this paper
TABLE II
GENERATORS COHERENCY MATRIX USING DIRECTION COSINE
G1 G2 G3 G4 G5 G6 G7 G8 G9 G10 G11 G12 G13 G14 G15 G16 G1 1.000 0.982 0.982 0.984 0.980 0.981 0.982 0.999 0.989 0.935 0.915 0.869 0.848 0.700 0.648 0.709 G2 0.982 1.000 1.000 1.000 0.999 1.000 1.000 0.987 0.999 0.852 0.824 0.764 0.738 0.633 0.590 0.613 G3 0.982 1.000 1.000 1.000 0.999 1.000 1.000 0.987 0.999 0.852 0.824 0.764 0.738 0.633 0.590 0.613 G4 0.984 1.000 1.000 1.000 0.999 1.000 1.000 0.989 0.999 0.857 0.830 0.770 0.745 0.635 0.593 0.618 G5 0.980 0.999 0.999 0.999 1.000 1.000 0.999 0.985 0.998 0.846 0.818 0.757 0.731 0.626 0.586 0.605 G6 0.981 1.000 1.000 0.999 1.000 1.000 1.000 0.987 0.999 0.850 0.822 0.762 0.736 0.631 0.589 0.611 G7 0.982 1.000 1.000 1.000 0.999 1.000 1.000 0.987 0.999 0.853 0.825 0.764 0.739 0.632 0.590 0.613 G8 0.999 0.987 0.987 0.989 0.985 0.987 0.987 1.000 0.993 0.923 0.902 0.853 0.831 0.694 0.639 0.696 G9 0.989 0.999 0.999 0.999 0.998 0.999 0.999 0.993 1.000 0.873 0.846 0.788 0.763 0.653 0.601 0.637 G10 0.935 0.852 0.852 0.857 0.846 0.850 0.853 0.923 0.873 1.000 0.998 0.981 0.968 0.766 0.701 0.836 G11 0.915 0.824 0.824 0.830 0.818 0.822 0.825 0.902 0.846 0.998 1.000 0.990 0.980 0.747 0.707 0.840 G12 0.869 0.764 0.764 0.770 0.757 0.762 0.764 0.853 0.788 0.981 0.990 1.000 0.998 0.685 0.678 0.797 G13 0.848 0.738 0.738 0.745 0.731 0.736 0.739 0.831 0.763 0.968 0.980 0.998 1.000 0.653 0.668 0.771 G14 0.700 0.633 0.633 0.635 0.626 0.631 0.632 0.694 0.653 0.766 0.747 0.685 0.653 1.000 0.594 0.742 G15 0.648 0.590 0.590 0.593 0.586 0.589 0.590 0.639 0.601 0.701 0.707 0.678 0.668 0.594 1.000 0.668 G16 0.709 0.613 0.613 0.618 0.605 0.611 0.613 0.696 0.637 0.836 0.840 0.797 0.771 0.742 0.668 1.000 0 0.5 1 0.4 0.6 0.8 1 0 0.5 1 T1 G14 G16 G13 G12 G11 G15 G10 G1 T2 G8 G2 G9 G3G7 G4 G6 G5 T3 GROUP 2 GROUP 3 GROUP 5 GROUP 4 GROUP 1
(a) ICA approach
−0.5 0 0.5 1 1.5 2 −0.5 0 0.5 0 1 2 G16 T1 G15 G14 G12 G13 G11 G10 G9 G8 G1 G2 G3 G4 G7 G6 G5 T2 T3 GROUP 3 GROUP 4 GROUP 5 GROUP 1 GROUP 2 (b) PCA approach
Fig. 10. Comparison of measurement based coherency identification tech-nique
are able to cluster the generators into their respective coherent groups even with the presence of noise in the measured data. The direction cosine method is not a data-driven method, thus it is not relevant for noise performance analysis.
The ratio between the measured signals and the low fre-quency components in the system, dictate the coherent groups of generators. The ICA approach finds a set of ICs from the measured signals, results in the preferential extraction of mono-frequency components. This is not the case with PCA approach. As noise can be considered as a frequency process, the PCA approach is unable to identify the accurate coherent groups of generators in the system. The consistency
−0.2 0 0.2 0.4 0.6 0.8 1 0.4 0.6 0.8 1 0 0.5 1 T1 G14 G16 G13 G11 G10 G12 G15 T2 G1 G8 G6G2 G3G9 G5 G7 G4 T3 GROUP 1 GROUP 4 GROUP 2 GROUP 5 GROUP 3
(a) ICA approach
−0.3 −0.2 −0.1 0 0.1 0.2 0.3 −0.2 −0.1 0 0.1 −0.2 0 0.2 0.4 0.6 T1 G16 G15 G13 G14 G6 G8 G3 G12 G9 G4 G11 G5 G10 G7 T2 G2 G1 T3 (b) PCA approach
Fig. 11. Performance using measurements data with the presence of noise
and robustness of the performance of the method in the presence of noise are important attributes for measurement-based coherency identification tool as the presence of the noise in measured data is inevitable.
VII. CONCLUSIONS
A measurement-based coherency identification technique in interconnected power system is proposed. The approach is based on the application of independent component analysis (ICA) technique to extract the coherency property of the system from wide-area generator speed and bus voltage angle signals. The mixing ratio of independent components (ICs) extracted using the proposed ICA method is used to cluster
the generators and buses displaying the common features in the measured signals into their coherent areas.
The accuracy of this analysis is validated by comparing the results with the direction cosine method and PCA approach. It is found out that the presence of noise in the measured data, influences the accuracy of the results obtained using the PCA. On the other hand, the ICA method accurately identifies the coherent groups of generators even with the presence of noise in the measured data. The proposed method also works well with the practical data gathered through UK University-based Wide-Area Measurement System. The method is simple and does not require detailed system modelling information. Con-trolled islanding scheme minimizes the frequency and impact of wide-area blackout by separating the system into several islands in controlled manner. The coherency information can be utilized to select the boundary for implementing controlled islanding scheme.
ACKNOWLEDGMENT
We thank Ministry of Higher Education Malaysia (MOHE) and Universiti Tun Hussein Onn Malaysia (UTHM) for sup-porting this research. We are grateful to all of the anonymous reviewers for their many valuable suggestions that has led us to conduct additional research, establish deeper insight and make well informed conclusions.
REFERENCES
[1] P. Kundur and C. Taylor, “Blackout Experiences and Lessons, Best Practices for System Dynamic Performance, and the Role of New Technologies,” IEEE Task Force Report, 2007.
[2] V. Madani, D. Novosel, S. Horowitz, M. Adamiak, J. Amantegui, D. Karlsson, S. Imai, and A. Apostolov, “IEEE PSRC Report on Global Industry Experiences With System Integrity Protection Schemes (SIPS),”
IEEE Transactions on Power Delivery, vol. 25, pp. 2143–2155, Oct.
2010.
[3] G. Rogers, Power system oscillations. Kluwer Academic, 2000. [4] A. G. Phadke and J. S. Thorp, Synchronized Phasor Measurements and
Their Applications. Springer, 2008.
[5] G. Troullinos and J. F. Dorsey, “Coherency and model reduction: state space point of view,” IEEE Transactions on Power Systems, vol. 4, no. 3, pp. 988–995, 1989.
[6] F. Wu and N. Narasimhamurthi, “Coherency identification for power system dynamic equivalents,” IEEE Transactions on Circuits and
Sys-tems, vol. 30, pp. 140–147, Mar. 1983.
[7] R. Podmore, “Identification of coherent generators for dynamic equiv-alents,” IEEE Transactions on Power Apparatus and Systems, no. 4, pp. 1344–1354, 1978.
[8] S. B. Yusof, G. J. Rogers, and R. T. H. Alden, “Slow coherency based network partitioning including load buses,” IEEE Transactions on Power
Systems, vol. 8, no. 3, pp. 1375–1382, 1993.
[9] G. N. Ramaswamy, C. Evrard, G. C. Verghese, O. Fillˆatre, and B. C. Lesieutre, “Extensions, simplifications, and tests of synchronic modal equivalencing (SME),” IEEE Transactions on Power Systems, vol. 12, no. 2, pp. 896–905, 1997.
[10] X. Wang, V. Vittal, and G. T. Heydt, “Tracing generator coherency indices using the continuation method: A novel approach,” IEEE
Trans-actions on Power Systems, vol. 20, no. 3, pp. 1510–1518, 2005.
[11] M. Abd-EI-Rehim, I. D. Helal, and M. A. H. Omar, “Multi-machine power system dynamic equivalents using artificial intelligence (ANN),” in Power Systems Conference, 2006. MEPCON 2006. Eleventh
Interna-tional Middle East, vol. 1, pp. 197–207, IEEE, 2006.
[12] M. Davodi, H. R. Modares, E. Reihani, and A. Sarikhani, “Coherency approach by hybrid PSO, K-Means clustering method in power sys-tem,” in IEEE 2nd International Power and Energy Conference, 2008, pp. 1203–1207, IEEE, 2008.
[13] M. A. Rios and O. Gomez, “Identification of coherent groups and PMU placement for inter-area monitoring based on graph theory,” in IEEE
PES Conference on Innovative Smart Grid Technologies (ISGT Latin America), 2011, pp. 1–7, IEEE, 2011.
[14] G. C. Pyo, J. W. Park, and S. I. Moon, “A new method for dynamic reduction of power system using PAM algorithm,” in IEEE Power and
Energy Society General Meeting, 2010, pp. 1–7, IEEE, 2010.
[15] H. A. Alsafih and R. Dunn, “Determination of coherent clusters in a multi-machine power system based on wide-area signal measurements,” in IEEE Power and Energy Society General Meeting, 2010, pp. 1–8, IEEE, 2010.
[16] T. N. Nababhushana, K. T. Veeramanju, and Others, “Coherency iden-tification using growing self organizing feature maps [power system stability],” in Proceedings of International Conference on Energy
Man-agement and Power Delivery, 1998, vol. 1, pp. 113–116, IEEE, 1998.
[17] K. L. Lo, Z. Z. Qi, and D. Xiao, “Identification of coherent generators by spectrum analysis,” in IEE Proceedings - Generation, Transmission
and Distribution, vol. 142, pp. 367–371, IET, 1995.
[18] M. Jonsson, M. Begovic, and J. Daalder, “A new method suitable for real-time generator coherency determination,” IEEE Transactions on
Power Systems, vol. 19, no. 3, pp. 1473–1482, 2004.
[19] N. Senroy, “Generator coherency using the hilbert–huang transform,”
IEEE Transactions on Power Systems, vol. 23, no. 4, pp. 1701–1708,
2008.
[20] K. K. Anaparthi, B. Chaudhuri, N. F. Thornhill, and B. C. Pal, “Coh-erency identification in power systems through principal component analysis,” IEEE Transactions on Power Systems, vol. 20, no. 3, pp. 1658– 1660, 2005.
[21] K. K. Anaparthi, Measurement based identification and control of
electromechanical oscillations in power systems. PhD thesis, Imperial
College London, Mar. 2006.
[22] J. Thambirajah, N. F. Thornhill, and B. C. Pal, “A Multivariate Approach Towards Interarea Oscillation Damping Estimation Under Ambient Con-ditions Via Independent Component Analysis and Random Decrement,”
IEEE Transactions on Power Systems, vol. 26, no. 1, pp. 315–322, 2011.
[23] C. Xia and J. Howell, “Isolating multiple sources of plant-wide os-cillations via independent component analysis,” Control Engineering
Practice, vol. 13, pp. 1027–1035, Aug. 2005.
[24] A. R. Messina, Inter-area oscillations in power systems: a nonlinear
and nonstationary perspective. Springer Verlag, 2009.
[25] A. Hyv¨arinen and E. Oja, “A fast fixed-point algorithm for independent component analysis,” Neural computation, vol. 9, no. 7, pp. 1483–1492, 1997.
[26] A. Hyv¨arinen, J. Karhunen, and E. Oja, Independent component analysis, vol. 26. Wiley-interscience, 2001.
[27] R. A. Johnson and D. W. Wichern, Applied multivariate statistical
analysis, vol. 4. Prentice hall Upper Saddle River, NJ, 2002.
[28] J. H. Chow, Time-scale modeling of dynamic networks with applications
to power systems. Springer, 1982.
[29] P. Kundur, J. Paserba, V. Ajjarapu, G. Andersson, A. Bose, C. Canizares, N. Hatziargyriou, D. Hill, A. Stankovic, C. Taylor, T. Van Cutsem, and V. Vittal, “Definition and classification of power system stability IEEE/CIGRE joint task force on stability terms and definitions,” IEEE
Transactions on Power Systems, vol. 19, no. 3, pp. 1387–1401, 2004.
[30] “IEEE Standard for Synchrophasor Measurements for Power Systems,”
IEEE Std C37.118.1-2011 (Revision of IEEE Std C37.118-2005), pp. 1–
61, 2011.
[31] V. Terzija, P. Regulski, L. P. Kunjumuhammed, B. C. Pal, G. Burt, I. Abdulhadi, T. Babnik, M. Osborne, and W. Hung, “FlexNet wide area monitoring system,” in 2011 IEEE Power and Energy Society General
Meeting, pp. 1–7, July 2011.
[32] J. Paserba, “Analysis and Control of Power System Oscillation: CIGRE Special Publication 38.01. 07, 1996, vol,” Technical Brochure, vol. 111.
M. A. M. Ariff (S’12) received the B.Eng of Electrical Engineering with first class honors and M.Eng (Electrical-Power) from Universiti Teknologi Malaysia (UTM), in 2008 and 2010 respectively. Currently, he is a tutor in Universiti Tun Hussein Onn Malaysia (UTHM) and on study leave to pursue his Ph.D. at Department of Electrical and Electronic Engineering, Imperial College London, U.K.
His current research interests are in the field of coherency identification, adaptive protection in power system and controlled separation for blackout prevention.
B. C. Pal (M’00-SM’02) received the B.E.E. (with honors) degree from Jadavpur University, Calcutta, India, the M.E. degree from the Indian In-stitute of Science, Bangalore, India, and Ph.D. degree from Imperial College London, London, U.K., in 1990, 1992, and 1999, respectively, all in electrical engineering.
Currently, he is a Reader in the Department of Electrical and Electronic Engineering, Imperial College London. His current research interests include wide area monitoring, state estimation, power system dynamics, and flexible AC transmission system controllers.