This is the author’s version of a work that was submitted/accepted for pub-lication in the following source:
Yigitcanlar, Tan &Duvarci, Yavuz (2006) A framework for integrating dis-advantaged analysis into transportation planning models. In Grainger, C (Ed.) A framework for integrating disadvantaged analysis into transporta-tion planning models, Queensland Transport, Australia, Queensland, Gold Coast, pp. 1-16.
This file was downloaded from: http://eprints.qut.edu.au/42220/
c
Copyright 2006 Queensland Transport.
Notice: Changes introduced as a result of publishing processes such as copy-editing and formatting may not be reflected in this document. For a definitive version of this work, please refer to the published source:
A Framework for Integrating Disadvantaged Analysis into
Transportation Planning Models
Tan Yigitcanlar1, Yavuz Duvarci2 1
Griffith University, Brisbane, Australia 2
Izmir Institute of Technology, Izmir, Turkey
1
Introduction
The ability to access personal or public transportation is fundamental for people to connect with employment opportunities, health and medical services, educational services, and the community at large. However certain populations lack the ability to provide their own transportation or have difficulty accessing whatever conventional public transportation may be available (Department of Transportation 2003). The ‘transportation disadvantaged’ populations are those persons who are unable to transport themselves or are unable to purchase transportation due to physical or mental disability, income status, or age. Therefore, the transportation disadvantaged are dependent upon others to obtain access to health care, employment, education, shopping, and other life sustaining activities. Additionally, since disadvantage is a personal experience, it can be simply characterised as what people perceive to be transportation disadvantage (Raje 2003).
This research paper aims to develop a method to explore the travel behaviour differences between disadvantaged and non-disadvantaged populations. It also aims to develop a modelling approach or a framework to integrate disadvantage analysis into transportation planning models (TPMs). This research views the term disadvantage as a multi-faceted one, meaning that a person is likely to be disadvantaged in a variety of ways (e.g. physically disabled, elderly and without a motor vehicle). The methodology employed identifies significantly disadvantaged groups through a cluster analysis. The paper presents a disadvantage-integrated TPM. This model could be useful in determining areas with concentrated disadvantaged population and also developing and formulating relevant disadvantage sensitive policies.
This paper addresses the following five primary research questions: (a) Who are the transportation disadvantaged? (b) What kinds of disadvantages are involved? (c) What are the travel patterns of the transportation disadvantaged? (d) Where these patterns are spatially concentrated? (e) Are they exposed to severe disadvantage? And the methodology of the research consists of primary and secondary data collection, statistical and spatial analyses, including cluster analysis, regression analysis, and GIS-based spatial analysis. Transport modelling is also undertaken using TRANUS Integrated Land Use and Transportation Planning software.
The paper is structured as follows. Section two reviews the literature on transportation disadvantage. Section three introduces the integrated transportation modelling approach. Section four demonstrates and discusses the implementation of the model in a pilot study. Section five concludes with the overall findings of this research.
2
Transport Disadvantaged
The transportation disadvantaged are generally identified as those people whose range of travel alternatives is limited, especially in the availability of easy-to-use and inexpensive options for trip-making (Transit Cooperative Research Board 1999). Conventional transportation models and studies have been inadequate in addressing severe long-term urban transportation problems that transportation disadvantaged groups overwhelmingly encounter (Simpson 1994; Banister 2002; Kenyon et al. 2002). The negative impacts of transportation on the disadvantaged have not been effectively considered in the modelling
studies, as these models do not take qualitative, social and ethical parameters into account (Banister 2002; Kane and Mistro 2003).
Transportation models are increasingly under attack for being biased against non-motorised traffic modes and socially disadvantaged groups (Murray 2003) and for failing to inform decision-makers with accurate information on the transport disadvantaged. In recent years, a strong demand has arisen for an equitable access to transport for the disadvantaged. Garrett and Wachs (quoted in Sheck 1997) point out the ethical responsibility of modelling studies towards social issues. Church et al. (2000), Deakin (2001; 2003) and Yigitcanlar et al. (2005) view ‘accessibility’ and ‘social equity’ among the key issues for land use and transportation planning to achieve sustainable outcomes.
Mobility impairment and a low level of accessibility to urban services (e.g. health, education, shopping and recreation) and transportation facilities are among the growing problems contributing to the escalation of inequity (Wu and Hine 2003; Yigitcanlar et al. 2006). Until recently the conventional TPMs have only preserved this status quo. For example, North American cities have extensively promoted mobility and trip generation, but at the same time have failed in promoting accessibility and equity, particularly for those without automobiles. Pennycook et al. (2001) point that over the last two decades distances to services have increased together with the rapid growth of suburbia. Increased distances to urban services are exacerbating transportation disadvantage among communities. According to Webber (1982), there is an inequity problem between people with and without an automobile, and it is the elderly, young, poor or disabled represented in the latter. Those without access to an automobile are even deprived of access to the economic and social life of the city.
However, there is still a struggle to define the disadvantage in a more explicit way. It has been concluded that the precise definition is impossible, since the many dimensions of disadvantage cannot be compartmentalised and handled with the existing travel modelling techniques (Lyons 2003). In describing who the disadvantaged might be the Transit Cooperative Research Program (1999), Pennycook et al. (2001) and Kenyon et al. (2002) succinctly elucidate reasons for disadvantage and the factors influencing immobility as: access to automobiles; demographic factors; and availability of public transportation.
Similarly in the report by the Social Exclusion Unit (2003), disadvantage is explained by three factors: (a) people may not have access to the transport facilities as a result of social exclusion; (b) due to poor transportation provision, some people may possess no access and be prevented from participating in social events, jobs, learning, leisure, healthcare, and food shopping; and (c) the effects of transport may have adverse impacts on socially excluded areas, such as air pollution or accidents. The impact of social isolation on travel behaviour is well documented in Bradford Metropolitan District Council’s (2003) study on social deprivation. This study illustrates that poverty usually accompanies poor transportation. Since people in deprived areas are more dependent on public transportation, they are more severely affected by poor public transportation (Porter 2002; Lucas 2004). However, exclusion does not solely relate to poverty or disability. Poor people still may have cars, or live in an accessible area and, thus, their poverty may not cause them to experience transport exclusion. Disabled people can have high accessibility to transport if they are supplied or made accessible to resources by other means. The exclusion can become much wider and multi-dimensional such as physical, temporal, economical, spatial and psychological (Hine and Mitchell 2001; Schonfelder and Axhausen 2003). One would be disadvantaged in certain periods of time, or in some certain places. Demographic dimension also adds to this as the numbers of disabled and elderly people are increasing in almost all nations (Brail et al. 1976; Blaser 1996; Deakin 2003) and together with these groups, those disadvantaged may constitute the majority. Hine and Grieco (2003) argue that combination of poor accessibility with low levels of mobility and low levels of sociability intensifies
exclusion. Thus, these intensities can be used as a measure in identifying the disadvantaged.
Hine and Grieco (2003) describe the general characteristics of various disadvantaged groups and the socio-economic or transport groups they belong to. Kenyon et al. (2002) advocates three aspects of analysis to deal with the disadvantaged issues of individuals (e.g. mobility impaired), groups (e.g. poor, elderly) and communities (e.g. clusters, neighbourhoods). They also argue that disadvantage is rather scattered. Newman et al. (1992) have compiled statistical data and devised an index of the various typologies of disadvantage. In this study, the disadvantages mostly appeared at household level with three dimensions: social and demographic, economic, and accessibility. Another classification by Wu and Hine (2003) provides seven different deprivation domains, which are income, employment, health and disability, education, geographical access to services, social environment, and housing. Litman (2002) examines the equity-based studies, and concludes that working with four user and six travel cost categories for a comprehensive equity-based transportation study is most appropriate.
None of the aforementioned studies sought integration of the disadvantaged into the mainstream TPMs. They only located disadvantage into various model-based works. In these studies, it is not clearly stated how various classifications would help to improve the conditions of the transportation disadvantaged. However, some studies have attempted to make this connection, which are described in the next section.
3
The Disadvantaged in Transportation Planning Models
Brail et al. (1976) is the first inquiry on the demand estimation for the transportation disadvantaged in a TPM. Yet, the study only concerns the elderly and the disabled as transportation disadvantaged groups. It is argued that the traditional demand estimation techniques were useless for these groups due to their particular transportation patterns and needs. In this study special ‘disadvantage coefficients’ are sought, but, the problem of overlapping categories occurred and caused double counting in the analysis in the trip estimation.
More recent studies have utilised intelligent transportation systems (ITS) and geographical information systems (GIS) applications in transportation modelling (Arampatzis et al. 2004; Thill et al. 2004; Wang 2005). Unfortunately these technologies only serve as partial solutions in considering the disadvantaged in the planning process and represent a comprehensive integration of the issue into mainstream TPMs. According to Cervero (in Barter and Raad 2000) there is no technology that can redress the social injustices inherent in a sprawling and auto-centric landscape.
There may be many groups with different transportation disadvantages, which can appear in various forms, such as: family size and conditions, dependency on a family member, personal characteristics (age or disability), travel comfort, travel time, travel cost, transfers, speed and physical travel conditions, vehicle performance, security and safety, physical barriers and difficulties, and dissatisfaction with transportation services. Transit and peak captives may even be added because of their dependency on a single mode of transportation and travel time. Travel behaviours may also show variety in different cultures (Cervero and Mason 1998) and from one disadvantaged group to another. Therefore developing an overall travel demand configuration for transportation modelling would be beneficial in addressing the problems of the disadvantaged.
3.1. Integrated Transportation Modelling Approach
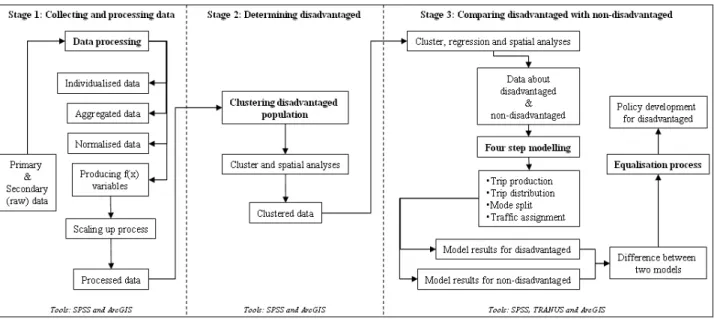
In this study a new modelling approach is developed to determine transportation disadvantaged and their travel behaviour in order to focus and address their transport related problems. The model contains three stages, which are: (a) collecting and processing
data; (b) determining disadvantaged population; and (c) comparing the disadvantaged and non-disadvantaged populations (Figure 1). The first stage of the model focuses on data collection and processing. The second stage of the model consists of a series of cluster analyses to clearly define disadvantaged groups. The final stage involves comparison of disadvantaged with non-disadvantaged population in terms of their travel behaviours.
Figure 1 Flowchart of the model
The model is tested in a pilot study to find out whether it runs validly and serves as a useful tool for improving the conditions of the disadvantaged groups. The city of Aydin, a food-processing centre at the Menderes River basin in Western Turkey, is selected as the pilot study area. The population of Aydin in 2000 was 135.365. The population is large enough and the urban layout is not too complicated to run the model satisfactorily. The boundary of the pilot area is restricted to the central suburbs of the city, which comprise of 12 travel analysis zones (zones).
3.2 Collecting and Processing Data
The data for the case study is gathered from three sources; municipal transportation dataset, 2000 census, and household travel survey. The municipal transportation dataset includes road networks, public transport (PT) routes, PT stops and time-tables. Some of the data was not available in digital format. The available datasets are geocoded and entered into GIS. The 2000 census data has been provided by the State Institute of Statistics. A face-to-face survey is conducted with randomly selected households using a ‘stratified random sampling’ technique. The survey is conducted with 326 households which represents 932 household members. The sampling ratio of this survey was 0.7 per cent. The household travel survey is designed carefully to investigate both individual and household socio-economic and travel characteristics. Questions related to households aim to reveal socio-economic status of the households, such as car ownership, household size, and income. Questions related to individual household members aim to determine individual travel patterns to reveal disadvantage-related information. Respondents were asked to give detailed information about their daily travel behaviour, such as trip destinations, travel comfort level, travel time and the cost. The reliability of the survey data is cross-checked by re-interviewing randomly selected respondents.
Contrary to many Turkish cities, Aydin is not a rapidly developing city. According to 2000 census statistics (State Institute of Statistics 2003), Aydin has the following socio-economic profile: 16 per cent unemployed, 19 per cent student, 25 per cent pre-school age, and 20 per cent over 65 of age. Service, manufacturing and commercial sectors are the dominant
economic activities among the urban economic activities (38%, 17% and 16% respectively). Census statistics also confirm the household travel survey findings.
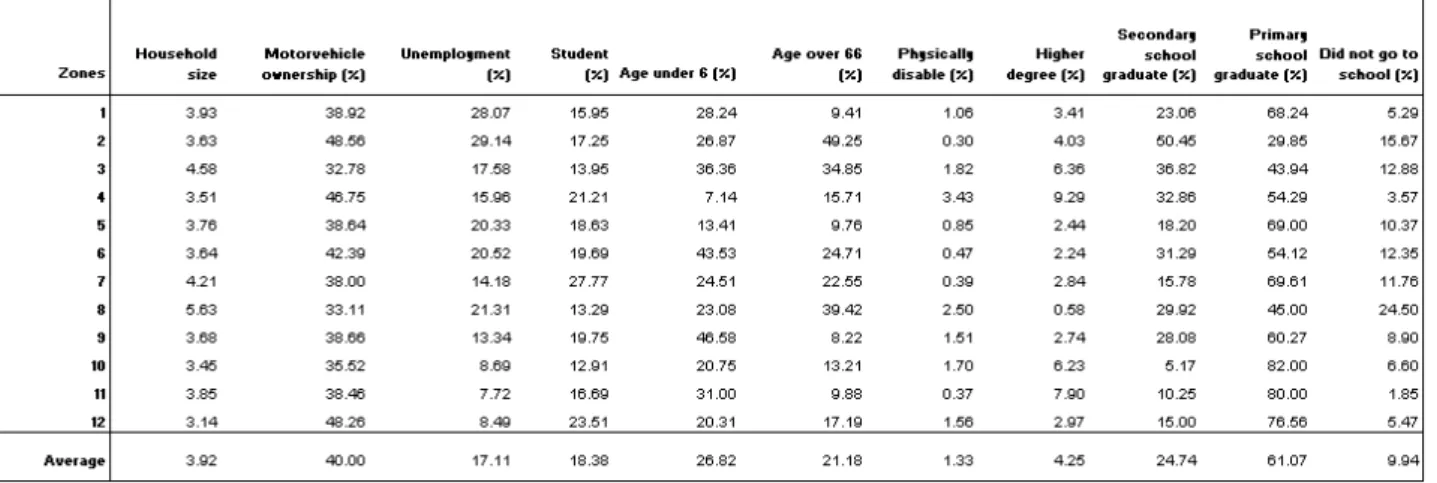
Aydin’s settlement structure is quite different than cities in developed countries. The city has a compact form, having only very limited dispersed suburbs. Wealthier groups reside in the suburbs surrounding the city centre. The urban fringe is mainly home to low income groups. The eastern suburbs largely comprise the manufacturing and industrial precincts with limited residential areas, while the western suburbs comprise newly developed middle income residential quarters. Table 1 presents some of the salient characteristics of the households within 12 zones (see Figure 2 for the location of these zones).
Table 1 Salient household characteristic
3.3 Determining the Disadvantaged Population
There are a large number of factors which contribute to transport disadvantage. NSW Ministry of Transport (2005) defines people as being transport disadvantaged with mobility, isolation, disability and age-based criteria. Some researchers focused on the socio economic aspects of the public to determine social groupings that are most likely to suffer transport disadvantage (Denmark 1998; Wu and Hine 2003; Dodson et al. 2004). Buchanan et al. (2005:14) noted that “[transport disadvantaged] include low-income people, the unemployed, beneficiaries, youth and children, women, the elderly, disabled people, outer urban dwellers and ethnic minorities. Other categories of relevance are: households in low rent housing, households with low mortgage payments (a proxy for cheaper owner-occupied housing) and households that do not own a motor vehicle”. However not everyone in each of these groupings are severely transportation disadvantaged.
The research reported here developed a method for clearly determining people as being severely transport disadvantaged. It defines people with severe transportation disadvantage as those having a number of major disadvantages at the same time (see Table 3 for the listing of the major disadvantage categories). Therefore the second stage of the model consists of a series of cluster analyses to determine those who are disadvantaged.
Cluster analysis is a statistical technique that is developed to group similar cases. Clustering algorithms are methods to divide a set of observations into groups so that the members of the same groups are more similar than members of different groups or clusters (Ripley 1999). The method of cluster analysis has been used widely in transportation planning, traffic accident analyses, traffic signal optimisation and ITS related studies as a data mining tool (Hauser et al. 2000). Cluster analysis makes data manageable and helps analysts to construct simple mathematical relationship between causes and the phenomenon, and it identifies the most relevant elements that represent the group. For example Smith and Saito (2001) used cluster analysis to categorise planning districts into a smaller and more manageable number of land use zones.
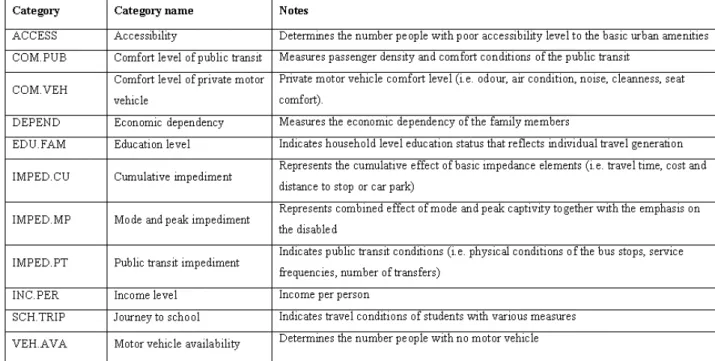
In cluster analysis, all data values are needed to be commensurate for comparability (Richardson et al. 1995). In this study over a 100 disadvantage variables are clustered around 11 major disadvantaged categories to form the generalised ‘disadvantage domain’ (Table 2). For example, factors that are affecting PT usage (e.g. service frequencies, number of transfers, and physical conditions of PT stops) are combined into one generalised PT impediment variable. This clustering allowed us to run a model with only 11 variables, and helped minimise possible errors originating from individual variables.
Table 2 Major disadvantage categories
Socio-economic, cultural, geographic, and legislative characteristics of localities are very important in selecting correct variables to determine the disadvantaged. Therefore, some of the variables that are used in this pilot study (i.e. PT comfort and vehicle comfort) may not be the best suited to defining disadvantaged populations elsewhere.
Cluster analysis requires all variables to be comparable and therefore each observation value is translated to a scale value between 0 and 100, which this process is referred as ‘scaling up process’. The general principle in scaling process is to scale all individual values to the highest value gained all throughout the data field. The frequency of summative (Likert) scale values in a single data column provides the importance of the variable concerned before the variable value in the function. In the process, first, the weights of importance are assigned and a raw utility value is found, and then, the highest value gained is calculated throughout the utility results of individuals. Similarly, if a maximum accessibility level is found for an individual to be 2.8 point, this was regarded as ‘100 point of access’ and all other individual values are rated over this highest value (for more information see Arsham 2002). The process of forming and scaling disadvantaged categories is undertaken in three steps:
Disaggregating household data into personal statistics, Forming disadvantage categories, and
Generating utility directions.
All upward values mean positive utility results for a person, while downward values mean negative utility (referred to as ‘disutility’). It is necessary for clustering that all values are distributed between two clusters (disadvantaged and non-disadvantaged) so the lower
values fall into the disadvantaged category and higher ones fall into the non-disadvantaged. It is assumed that all considered categories have an equal weighting.
There are two basic utilities of the clustering. These are; to which cluster an individual belongs, and the distance of the individual values to the centre of the cluster, which is the degree of disadvantage for the variable. All data are reduced to 11 disadvantage categories and are prepared for the clustering process. ‘K-Means’ method of clustering in SPSS is applied to derive the data of those disadvantaged persons. Each individual belonged to the cluster that whose centre is closest to that in terms of Euclidian distance. This type of clustering is referred in the literature as the ‘internal cohesion’ clustering (Everitt 1993). For objectivity, no predefined threshold values are introduced in grouping the values. Simply, the procedure is used for splitting sample population into two groups for the major 11 disadvantage categories.
The persons with relatively low scores belonged to the disadvantaged, and the ones with high scores to the non-disadvantaged categories. Consequently, the number of disadvantaged persons was 629 and non-disadvantaged was 303. In the model, the disadvantaged and non-disadvantaged are separated and evaluated independently. Additionally cluster centres provide an indication of the disparities (as a gauge for disadvantage) between the two clusters for each variable. Cluster centre results point to the fact that disadvantage is largely due to a lack of motor vehicle access and poverty. This finding indicates that ‘vehicle availability’ and ‘income’ are the key policy variables in determining disadvantage. Therefore local council needs to pay a great deal of attention on these two issues, while developing policies to address the problems of the disadvantaged. Determining types of disadvantage provides us with information about which variables are to be captured as ‘policy variables’ and which socio-demographic groups to focus on. Table 3 presents the aggregated view of disadvantaged categories by zones. These findings overlap with the socio-economic data obtained from the household travel survey and the census.
Table 3 Aggregated disadvantaged categories by zones
The cluster results indicate that the city of Aydin accommodates more disadvantaged people than expected. The reason of this high level disadvantaged ratio might be because of its urban form, PT configuration and also socio-economic characteristics of the residents. Aydin is a compact medium-size city with mostly a gridiron road network. However, the PT services are lacking. In addition, motor vehicle ownership, income and employment levels are very low. Further, travel times exceeding 20 minutes are considered a disadvantage in Aydin, while 45 minutes of travel time could barely be considered a disadvantage in a large metropolitan city.
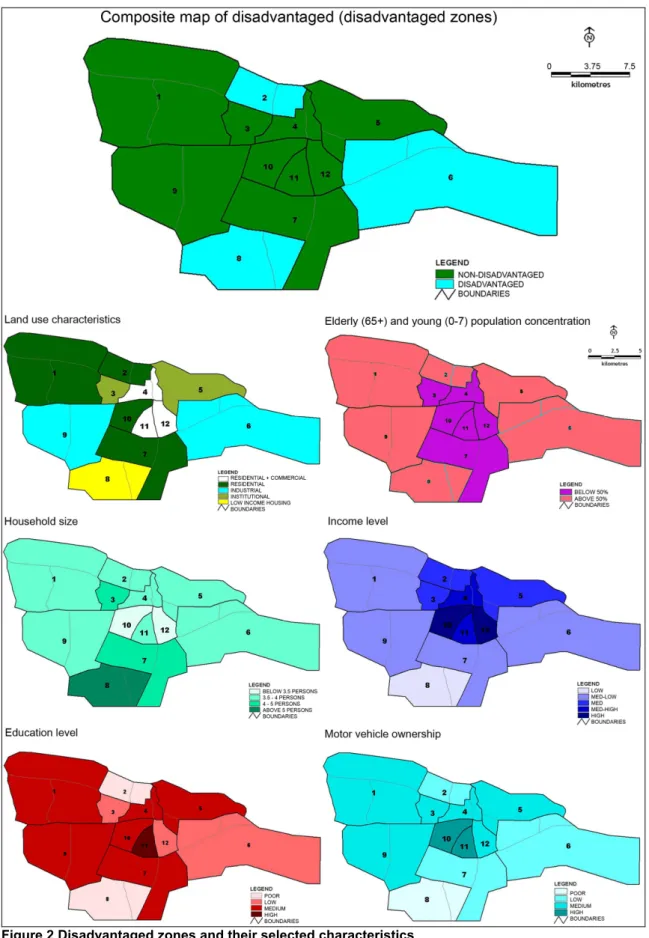
Figure 2 Disadvantaged zones and their selected characteristics
Figure 2 presents disadvantaged zones as zone averages derived from the aggregated clustering results. Zones 2, 6 and 8 are noted as disadvantaged and are also characterised as low socio-economic areas. It also illustrates various socio-economic characteristics of the zones that are derived from the household travel survey and the census.
Consequently, this analysis demonstrates that it is possible to determine zone clusters of the disadvantaged by the cluster analysis. In the case of Aydin, this study falsifies Hine and Grieco’s (2003) argument that the disadvantaged is rather scattered. This analysis shows that there are relatively dense disadvantaged populated areas. The disadvantages are overwhelmingly contingent on low income, low motor vehicle ownership, large household size, poor accessibility and low educational level.
3.4 Comparing Disadvantaged with Non-Disadvantaged
TRANUS integrated land use and transport modelling software is utilised for the transportation modelling of Aydin. TRANUS accommodates a traditional four-step modelling process to estimate traffic volumes on major roadways (primarily freeways, arterials, and collectors). The four steps include:
Trip production - the amount of travel (both trip production and trip attraction models), Trip distribution - where people are travelling,
Mode split - whether people travel by car, car pool, transit, or bicycle and or on foot, and
Traffic assignment - what routes people select, if by car or transit.
In this pilot study ‘journey to work’ and ‘journey to school’ are considered in determining travel patterns. The model is run for 12 traffic analysis zones. To compare the disadvantaged population with the non-disadvantaged, both of their travel behaviours are determined by TRANUS. Trip productions and distributions for all modes (PT, private vehicle and walking) are calculated and entered into TRANUS for the mode split. TRANUS is utilised for running the model and monitoring assignment results. Performance indicator results and simulations are also obtained for each category.
In terms of PT there is only one mode available at the pilot study area, which is the bus service. Bus services that run on 17 routes are operated by the transportation department of the Aydin city council. Network configurations and travel cost values are estimated by considering distances over the PT and road networks for each ‘trip production-trip attraction’ pairs. Other aspects of the transportation system and the traffic assignment calibration specifications are outside the scope of this paper.
3.4.1 Trip Production
An ordinary least square multiple linear regression model was used to determine the most important factors in trip production for both disadvantaged and non-disadvantaged. Regression analysis is a popular technique in determining factors influencing trip production (Cervero and Gorham 1995; Cervero and Kockelmann 1997; Hess et al. 1999; Krizek 2003). After various trials with different variables through correlation analysis, three variables are entered in the regression model. For non-disadvantaged the variables with the highest R2 value are the most effective factors in explaining the trip generation behaviour. These variables were educational level, income level, and economic dependency. When these variables are run together in the regression model, the R2 value was as high as 0.78. For the disadvantaged, the highest R2 value (0.69) is achieved with the following variables: vehicle comfort, comfort level of PT, and economic dependency.
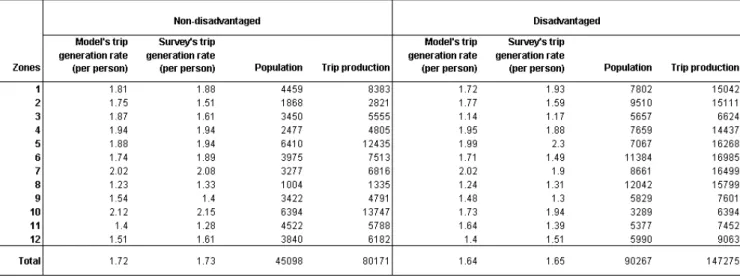
The average daily trips were measured for both non-disadvantaged and disadvantaged in each zone. The overall average daily trips per person for the non-disadvantaged were 1.73, compared with 1.65 for the disadvantaged. Trip production results by zones for both disadvantaged and non-disadvantaged groups are presented in Table 4.
Table 4 Trip production by zones for non-disadvantaged and disadvantaged
3.4.2 Trip Distribution
A simple distance decay function, which is based on the singly-constrained gravity model, is used to determine trip distributions. Following the calibration process, obtained trip length distributions (TLD) are found to be fitting to the TLD curve of ‘trip production-trip attraction’ for the beta calibration. Finally, the beta values became –1.22 and –1.12 for the non-disadvantaged and the non-disadvantaged respectively. This analysis confirms that the disadvantaged travel slightly further than the non-disadvantaged. The outcomes of the trip distributions for the non-disadvantaged and the disadvantaged are listed in Table 5.
3.4.3 Mode Split
The utility approach (binomial logit) is used to calculate the proportions of modal choices. The general utilities for modes (public/private) of transport categories (non-disadvantaged /disadvantaged) are derived through regression analyses, seeking relationship between the combined impediment variable and the type of mode travelled as dependent variable. The R2 value for non-disadvantaged was 0.78. The utility function for the disadvantaged could be explained solely by the combined impediment variable, where R2 was 0.72 with coefficients being almost identical with the non-disadvantaged.
The calculations for mode split and assignments are run on TRANUS, therefore there was no need to employ logit method in finding mode split figures. TRANUS requires overall observed modal preferences to be entered into its system. Modal preferences are calculated by considering the network and system characteristics (distance, PT services, and capacities). The modal preferences in favour of PT were 0.43 for the disadvantaged and 0.37 for the non-disadvantaged population.
3.4.4 Traffic Assignment
Quantifying traffic assignments is required for completing the final step of the modelling and also for determining performance indicator results for user disutility levels. The assignments are calculated automatically by TRANUS.
4
Discussion
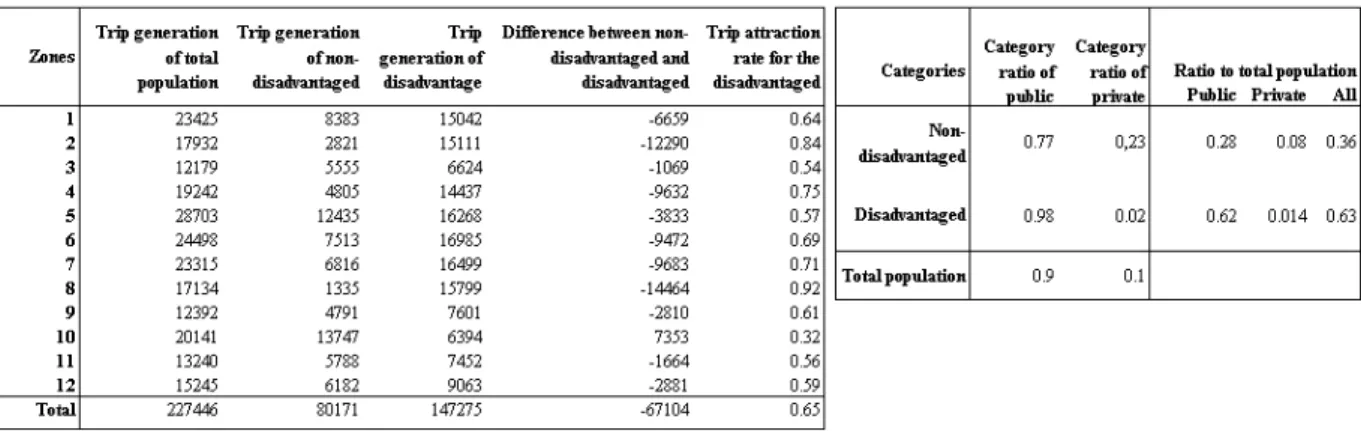
The purpose of this paper is to determine and compare travel behaviours of the disadvantaged and non-disadvantaged. The research findings are significant and the model could have a considerable contribution in the policy-making process. The disadvantaged group’s ratio to the whole population is 64 per cent. In trip production, the most disadvantaged zones (disadvantaged ratio above 65%) are 8, 2, 4, 7 and 1 (Table 6). Policy-makers of Aydin need to address the accessibility and mobility problems of the disadvantaged in these zones. Yet the parametric differences between the non-disadvantaged and the non-disadvantaged groups are slim, as in the beta values of trip distribution. This is probably because of the inflexible data of regular trips that both non-disadvantaged and non-disadvantaged equally have to endure. There is also a significant difference between the modal choices. PT mode is 43 per cent for the disadvantaged and 18 per cent for the non-disadvantaged.
Table 6 Trip production and mode split differences
Detailed cell results in the mode split stage are examined at the final stage of this study. Values over the general rate of 0.64 are assumed as severe disadvantaged cells. There are five zones (8, 2, 4, 7, 1), which should be targeted as the policy zones. Such differential rates of the base-year would especially be useful in the absence of data for future studies. If less mobility is perceived as a disadvantage, the trip rate should be heightened for the disadvantaged.
Intra-urban performance indicators and trip numbers by mode for the disadvantaged are provided in comparison to the non-disadvantaged population in Table 7. Modal shifts can be also monitored in the simulations as a sustainability indicator to detect whether there is any significant modal shift occurring towards more PT use.
Table 7 Intra-urban average performance indicators per person
Findings of the ratio analysis for PT and private motor vehicle trips to all trips are listed in Table 8. Shaded cells in the table represent relatively disadvantaged trip distributions. Analysing these results could be useful for planners in detecting weak PT links in these zones. Also it could be helpful to take action in improving PT conditions especially if people reside in these zones are heavily transit dependent. Further, through simulations this model can be used to test future transportation infrastructure investments (e.g. new roads, PT routes) aiming to minimise disadvantage.
By analysing the results of the model, policy makers can quickly and easily identify how much improvement is needed for the disadvantaged, and where to deploy new policies. Where pockets of disadvantage exist, the demand responsive systems based on modest ITS technology can be utilised to improve transportation for the most severely disadvantaged people (Hine and Grieco 2003).
4.1 Simulation Scenarios
The model is run through several simulation scenarios to demonstrate some of the possible options to improve the conditions of the disadvantaged. For example, one of the simulation scenarios focuses on the improvement of the PT services. The previous findings have shown that major reasons for the disadvantaged concentration in zones 2, 6, 7 and 8 are mainly due to income and age (over 65). Therefore the simulation is run with a proposed new discounted paratransit service for the elderly, retired and disabled.
The results of this simulation are illustrated in Figure 3. First, the lines of the paratransit services are demarcated (Figure 3a and 3b). Secondly, existing passenger demands for PT are checked (Figure 3c). Lastly, the passenger demand volumes of proposed service lines are a result of the new policy/scenario aimed at improving conditions for the disadvantaged (Figure 3d).
The simulation results are also double checked with basic performance measure indicators (i.e. cost, travel time, modal shift) by TRANUS Reporting Program. These findings were then compared with the model findings as well as other simulation results. Furthermore, congestion levels of roads are also considered in the simulations.
It is clear that the proposed PT routes would attract voluminous passenger demand, which probably involves greater portions of the disadvantaged. Consequently, the simulation results are found to be satisfactory for improving the disadvantaged population’s conditions.
5
Conclusion
This paper introduces a methodology based on statistical and spatial (GIS-based) analyses to evaluate the travel pattern and behaviours of the transportation disadvantaged. The study seeks the integration of the disadvantaged into a traditional TPM. Thus, soundness of the approach rather than the precision of the demand estimations became the prime concern in the study. The model performs practically without any failure and the usefulness of the approach is tested in a pilot study. Contrary to the arguments in some of the literature, this research has demonstrated that it is possible to develop an integrated approach in modelling for the disadvantaged.
Based on the knowledge derived from the differences between the disadvantaged and non-disadvantaged by means of clustering, the travel non-disadvantaged is defined precisely in a multi-variate modelling. Travel patterns are determined through the steps of the model. The disadvantaged zones are geographically determined. The degrees and the types of disadvantages are defined.
The model approach tested in this pilot study reveals the answers of the research questions. The model is capable of determining the disadvantaged people by using 11 major disadvantage categories. The pilot study has shown that the model is useful in determining the disadvantaged population and their travel patterns. The model also provides policy-makers and planners with a metric gauge to determine the travel disadvantage of people in various dimensions (i.e. spatial, temporal, magnitude).
The model also provides a yardstick to: (a) measure the degree of disadvantage for various sub-categories of disadvantage; (b) integrated disadvantage-related parameters into the TPMs; (c) provide a knowledge base for social and spatial disadvantages. Therefore, the model can be used as a decision-support tool for transportation and land-use planners to produce remedies for those disadvantaged. It can assist policy-makers in developing people-based strategies in addressing the issue of transport disadvantaged instead of traditional place-based strategies. The model can also be utilised as a continuous monitoring medium of performance measures in policy making.
The differences in travel patterns between the disadvantaged and non-disadvantaged are significant. The disadvantaged group produced fewer trips compared to the non-disadvantaged, travelled more distance, and inclined heavily to use public modes of transportation. However, the most important outcome of this study is the determination of the degrees of disadvantages for each zone (for more information see Duvarci and Gur 2003). It has also been found that socio-economic variables such as income and car ownership are the most significant ones in defining the pattern of transportation disadvantage. Therefore, for Aydin these variables should be considered in policy making for addressing the problems of the disadvantaged as these are found to be significant in the cluster centres.
6
References
Arampatzis, G., C. Kiranoudis, P. Scaloubacas and D. Assimacopoulos (2004). "A GIS-based decision support system for planning urban transportation policies." European Journal of Operational Research 152(2): 465-475. Arsham, H. (2002). Empirical Cumulative Distribution Function Construction.
Banister, D. (2002). Transport Planning. London, Spon.
Barter, P. and T. Raad (2000). Taking Steps: A Community Action Guide to People-Centred, Equitable and Sustainable Urban Transport, Sustainable Transport Action Network for Asia and the Pacific.
Blaser, A. (1996). "A brilliant future with disabilities." Futurist 30(5): 40-42.
Brail, R., J. Hughes and C. Arthur (1976). Transportation services for the disabled and elderly. New Jersey, Center for Urban Policy Research, Rutgers University.
Buchanan, N., R. Evans and J. Dodson (2005). Transport Disadvantage and Social Status: A Gold Coast Pilot Project. Research Monograph 8. Brisbane, Urban Research Program, Griffith University.
Cervero, R. and R. Gorham (1995). "Commuting in Transit Versus Automobile Neighbourhoods." Journal of the American Planning Association 61: 210-225.
Cervero, R. and K. Kockelmann (1997). "Travel Demand in the Three Ds: Density, diversity, and design." Transportation Research-D 2(3): 199-219.
Cervero, R. and J. Mason (1998). Transportation in Developing Countries. Transportation in Developing Countries, Berkeley, University of California, University of California Transportation Centre.
Church, A., M. Frost and K. Sullivan (2000). "Transport and Social Exclusion in London." Transport Policy 7: 195-205.
City of Bradford Metropolitan District Council (2003). Bradford Deprivation Maps. Service:.
Deakin, E. (2001). Sustainable Development and Sustainable Transportation: Strategies for Economic Prosperity, Environmental Quality, and Equity. Working 2001-03, University of Berkeley, Institute of Urban and Regional Development.
Deakin, E. (2003). Trends and Policy Choices: A Research Agenda. Access, University of California Transportation Center. Fall 23.
Denmark, D. (1998). "The outsiders: Planning and transport disadvantage." Journal of Planning Education and Research 17(3): 231-245.
Department of Transportation (2003). Transport Disadvantaged Populations: Some Coordination Efforts Among Programs Providing Transportation Services, But Obstacles Remain. Washington, D.C.
Dodson, J., B. Gleeson and N. Sipe (2004). Transport Disadvantage and Social Status: A Review of Literature and Methods. Research Monograph 5. Brisbane, Urban Research Program, Griffith University.
Duvarci, Y. and G. Gur (2003). A Method of Policy Capturing for the Transportation Disadvantaged: Simulation Results. Urban Transport IX, Sevilla, WIT Press.
Everitt, B. (1993). Cluster analysis. London, Oxford University Press.
Hauser, T., W. Scherer and B. Smith (2000). Signal system data mining. Studies, University of Virginia.
Hess, P., M. Moudon, M. Snyder and K. Stanoliv (1999). "Site Design and Pedestrian Travel." Transportation Research Record 1674: 9-19.
Hine, J. and M. Grieco (2003). "Scatters and clusters in time and space: implications for delivering integrated and inclusive transport." Transport Journal 10: 299-306.
Hine, J. and F. Mitchell (2001). "Better for everyone? Travel experiences and transport exclusion." Urban Studies 38(2): 319-332.
Kane, L. and D. Mistro (2003). "Changes in Transport Planning Policy: Changes in Transport Methodology?" Transportation 30: 113-131.
Kenyon, S., G. Lyons and J. Rafferty (2002). "Transport and Social Exclusion: investigating the possibility of promoting inclusion through virtual mobility." Journal of Transport Geography 10: 201-219.
Krizek, K. (2003). "Residential Location and Changes in Urban Travel: Does Neighbourhood Sclae Really Matter?" Journal of the American Planning Association 69(3): 265-281.
Litman, T. (2002). "Evaluating Transportation Equity." World Transport Policy and Practice 8(2): 50-65.
Lucas, K. (2004). Locating transport as a social policy problem. Running on empty: Transport, social exclusion and environmental justice. Lucas. Bristol, Policy Press.
Lyons, G. (2003). "The introduction of social exclusion into the field of travel behaviour." Transport Policy 10(4): 339-342.
Ministry of Transport (2005). New South Wales Transportation Policy. www.transport.nsw.gov.au on 5 September 2005, NSW Government.
Murray, A. (2003). "A Coverage Model for Improving Public Transit System Accessibility and Expanding Access." Annals of Operation Research 123(1): 143-156.
Newman, P., J. Kenworthy and P. Vintila (1992). Housing, Transport and Urban Form. Background Paper 15, National Housing Strategy. Department of Health. Canberra.
Pennycook, F., R. Barrington-Crags, D. Smith and S. Bullock (2001). Environmental Justice: Mapping Transport and Social Exclusion in Bradford, Friends of the Earth.
Porter, A. (2002). "Compromise and Constraint: Examining the nature of transport disability in the context of local travel." World Transport Policy and Practice 8(2): 9-16.
Raje, F. (2003). "The impact of transport on social exclusion processes with specific emphasis on road user charging." Transport Journal 10: 321-338.
Richardson, A., E. Ampt and A. Meyburg (1995). Survey Methods for Transport Planning. Melbourne, Eucalyptus Press, University of Melbourne.
Ripley, B. (1999). Pattern recognition and neural networks. Cambridge, Cambridge University Press.
Schonfelder, S. and K. Axhausen (2003). "Activity spaces: measures of social exclusion." Transport Policy 10: 273-286.
Sheck, R. (1997). "Transportation Planning On Trial (Book Review)." Growth and Change 28(1): 130-33. Simpson, B. (1994). Urban public transport today. London ; Melbourne, Vic., E & FN Spon.
Smith, J. and M. Saito (2001). "Creating land-use scenarios by cluster analysis for regional land use and transportation sketch planning." Journal of transportation statistics 4(1): 39-51.
Social Exclusion Unit (2003). Making the Connections: Final Report on Transport and Social Exclusion, Office of the Deputy Prime Minister.
State Institute of Statistics (2003). Census of Population and Housing. Ankara, Turkey.
Thill, J., G. Rogova and J. Yan (2004). "Evaluating Benefits and Costs od Intelligent Transportation System Elements for a Planning Perspective." Research in Transportation Economics 8: 581-603.
Transit Cooperative Research Board (1999). Using Public Transport to Reduce the Economic, Social, and Human Costs of Personal Immobility. Transportation Research Board Report 49. Council. Washington D.C., National Academic Press.
Wang, X. (2005). "Integrating GIS, Simulation Models, and Visualisation in Traffic Impact Analysis." Computers, Environment and Urban Systems 29(4): 471-496.
Webber, M. (1982). The Transportation Problem is A Problem in Social Equity. Urban Transport. Levinson and Weant. Westport, ENO Foundation.
Wu, B. and J. Hine (2003). "A PTAL Approach to Measuring Changes in Bus Service Accessibility." Transport Policy 10: 307-320.
Yigitcanlar, T., J. Dodson, B. Gleeson and N. Sipe (2005). Sustainable Australia: Containing Travel in Master Planned Estates. Urban Research Program Research Monograph 9, September 2005. Brisbane, Urban Research Program Griffith University.
Yigitcanlar, T., N. Sipe, R. Evans, and M. Pitot (2006). Land Use and Public Transportation Accessibility Index. The International Geographical Union 2006 Brisbane Conference, QUT, 3-7 July 2006.