TSKgel SW-type
SW
SW
XLSuperSW
TSKgel PW-type
PW
PW
XLTSKgel Alpha-type
Alpha
SuperAW
TSKgel H-type
H
XLH
HRSuperH
SuperHZ
Size Exclusion
Chromatography
Size Exclusion
Chromatography
Introduction to TSK-GEL Size Exclusion
Chromatography Columns
Tosoh Bioscience provides TSK-GEL columns for both modes of Size Exclusion Chromatography (SEC), which are Gel Filtration Chromatography (GFC) and Gel Permeation Chromatography (GPC). GFC refers to the SEC separation of water soluble polymers in aqueous mobile phases, while GPC refers to the SEC separation of organic soluble polymers using an organic solvent as mobile phase. From a sample perspective, the TSK-GEL SW-type column line, which is based on spherical porous silica particles, is most suitable for analyzing proteins and peptides by gel filtration. Polymer-based TSK-GEL PW columns are best used for GFC analysis of other water soluble polymers, such as oligosaccharides, acrylic acid, etc. Polymer-based TSK-GEL Alpha and SuperAW columns can be used in aqueous solvents, and also with polar organic solvents, thus bridging the gap between GFC and GPC. Organic soluble polymers are best separated by GPC using polystyrene/divinylbenzene-based TSK-GEL HXL, HHR, SuperH or SuperHZ columns. Table Icompares the characteristics of the various TSK-GEL column lines for SEC. Tosoh Corporation has a proud history of innovation in size exclusion chromatography. The porous silica-based SW columns were originally introduced in 1978 as TSKgel G2000SW, G3000SW and G4000SW, using 10 and 13 μm spherical particles. The second generation of SEC columns for biopolymer analysis was introduced in 1987. By reducing the particle size from 10 to 5 μm for G2000SWXLand G3000SWXL, and from 13 to 8 μm for G4000SWXL, analysis times were cut in half without sacrificing resolution. The third generation of SW-type columns was introduced in 1998 under the name SuperSW, a column line that features 4 μm spherical particles packed in 4.6 mm ID columns rather than the wider (7.8 mm ID) SWXLcolumns. TSK-GEL SuperSW columns are available in two pore sizes that mimic the pore structure of the G3000SWXLand G2000SWXLcolumns. Due to their higher column efficiency and smaller column volume, these columns provide better resolution and higher sensitivity in sample limited cases. This trend towards smaller, more efficient particles packed into narrower bore columns has been expanded to include columns for the analysis of non-biological aqueous and non aqueous polymers. SuperAW, SuperH and SuperHZ columns represent the state of the art column technology for high throughput SEC analysis.
Bulk polymeric Toyopearl GFC resins for process scale
separations are available in convenient LABPAK samplers (up to 150 mL) and in bulk quantities of up to 500 mL (see the Bulk
Resins section of this catalog). For larger volumes of Toyopearl GFC media, please request a copy of the process media catalog.
Column Selection
The complete TSK-GEL SW, PW, Alpha and SuperAW column lines for GFC consist of many packings, available in various pore and particle sizes. The main criterion in choosing between the TSK-GEL SW, PW, Alpha and SuperAW SEC columns is the molecular weight of the sample and its solubility. The fact that the TSK-GEL SW columns are based on silica and the TSK-GEL PW, Alpha and SuperAW columns are derived from a hydrophilic polymer network has less impact on the separation than the particle and pore size differences. See the Molecular Weight Range Tables in each column type section to determine the best column choice based on pore size.
Due to their higher resolving power, the TSK-GEL SW columns are suitable for the separation of monodisperse biopolymers such as proteins and nucleic acids. TSK-GEL PW columns are commonly used for the separation of synthetic water-soluble polymers because they exhibit a much larger separation range, better linearity of calibration curves, and less adsorption than the TSK-GEL SW columns. While a TSK-TSK-GEL SW column is typically the first column to try for biopolymers, TSK-GEL PW columns have demonstrated good results for smaller peptides (<1,000 Da), protein aggregates, DNA fragments, and viruses.
The TSK-GEL Alpha Series columns offer a new alternative for performing SEC. Their compatibility with a wide range of solvents makes them useful for both gel filtration chromatography (GFC) and gel permeation chromatography (GPC). TSK-GEL SuperAW columns are based upon the the same chemistry as Alpha columns but have smaller particle sizes and shorter, narrower column dimensions for high-throughput applications. Unlike the Alpha columns, mixed bed formats are included in the SuperAW product offerings for samples with wide ranges of molecular weights/ hydrodynamic radius. See Figure 1for more information on compatibility of all TSK-GEL SEC columns and solvents.
Non-aqueous GPC separations are performed with TSK-GEL H-type pre-packed columns. Our TSKgel MultiporeHXL-M column contains porous polystyrene divinylbenzene packings with various sized pores on a single bead. TSK-GEL SuperH and SuperHZ columns are offered for high throughput applications where reductions in run time and solvent consumption are critical. Table XII (see p. 61) provides a list of possible shipping solvents along with compatible solvents for each H-type packing.
SeeTable IIfor suggestions on how to choose between TSK-GEL SW, TSK-GEL PW and TSK-GEL Alpha column types.
Features
Benefits
Rigid hydrophilic packings Minimal swelling and excellent physical strength Low adsorption resulting in high mass recovery Four series of SEC columns Suitable for aqueous with different ranges of GFC and non-aqueous GPC solvent compatibility
(Figure 1)
Easy scale up Analytical and preparative
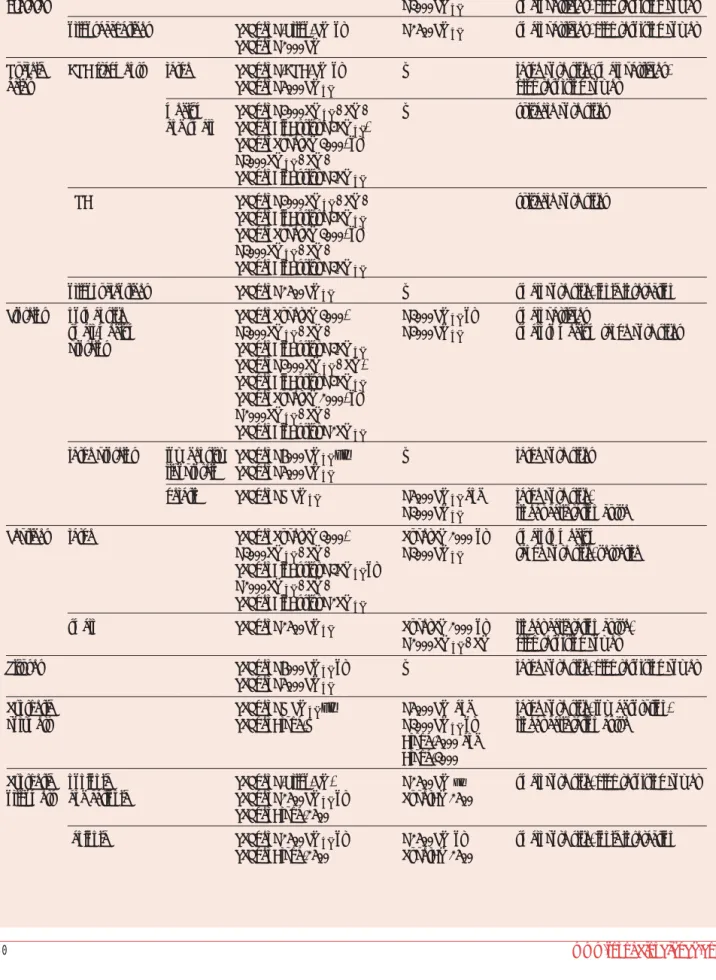
Characteristics of TSK-GEL Size Exclusion Column Lines
Column Line TSK-GEL SW / SWXL/ TSK-GEL PW / PWXL TSK-GEL Alpha / TSK-GEL HXL/ HHR/
SuperSW SuperAW SuperH / SuperHZ
Resin Type Silica Methacrylate Methacrylate PS-DVB
No. of Available 3 7 5 8
Pore Sizes
pH stability 2.5 - 7.5 2.0 - 12.0 2.0 - 12.0 1.0 - 14.0
Solvent 100% polar 50% polar 100% polar 100% nonpolar,
Compatibility and nonpolar limited polar
Max. Temperature 30°C 80°C* 80°C 60°C (1000H-3000H)
80°C (4000H-GMH) 140°C (HHR,H- HT)
Max. Flow 0.4 (SuperSW) 1.0 (PWXL) 0.6 (SuperAW) 1.0 (HHR)
Rate (mL/min) 1.2 (SW and SWXL) 1.2 (PW) 1.0 (Alpha) 1.2 (HXL)
0.8 (SuperH)
0.7 (SuperHZ 6.0 mmID) 0.4 (SuperHZ 4.6 mmID)
Pressure** 8-120 10-40 20-40 10-60
(kg/cm2)
Application proteins water-soluble polymers intermediate polar organic-soluble
Focus polymers polymers
* Except for the TSKgel G-DNA-PW, which can be operated up to 50˚C and the 55 mm ID TSK-GEL PW-type columns, which can be operated up to 60˚C. When operating below 10˚C, reduce the flow rate to ensure that the maximum pressure is not exceeded.
** Depends on column dimensions and particle size
Note: The operating conditions and specifications for each column are listed on the Operating Conditions and Specifications sheet (OCS) shipped with the column and in the Ordering Information section at the end of each section.
Table I
water, aqueous solution polar organic solvent nonpolar organic solvent
(PW up to 50% organic solvent) (solvent limited) PW, PWXL SW, SWXL, SuperSW Alpha SuperAW HXL, MultiporeHXL and SuperHZ HHR SuperH
Solvent compatibility for TSK-GEL Size Exclusion Chromatography columns
Column selection guide for high performance Gel Filtration Chromatography
Sample Column selection Selection criteria
First choice Alternative
Carbo- polysaccharides TSKgel GMPWXL G5000PWXLand large pore size, linear calibration curve,
hydrates G3000PWXL small particles, high resolving power
oligosaccharides TSKgel G-Oligo-PW or G2500PWXL small particles, high resolving power
TSKgel G2000PW
Nucleic DNA fragments large TSKgel G-DNA-PW or — large pore size, small particles,
acids TSKgel G5000PWXL high resolving power
medium TSKgel G4000SWXL/ SW/ — suitable pore sizes
and small TSKgel BioAssist G4SWXL,
TSKgel SuperSW3000, or
G3000SWXL/ SW/
TSKgel BioAssist G3SWXL
RNA TSKgel G4000SWXL/ SW/ suitable pore sizes
TSKgel BioAssist G4SWXL TSKgel SuperSW3000, or
G3000SWXL/ SW/
TSKgel BioAssist G3SWXL
oligonucleotides TSKgel G2500PWXL — small pore size, ionic interaction
Proteins normal size TSKgel SuperSW3000, G3000PWXLor small particles
small-medium G3000SWXL/ SW/ G4000PWXL small to medium range pore sizes
proteins TSKgel BioAssist G3SWXL
TSKgel G4000SWXL/ SW,
TSKgel BioAssist G4SWXL
TSKgel SuperSW2000, or
G2000SWXL/ SW/
TSKgel BioAssist G2SWXL
large proteins low density TSKgel G6000PWXLor — large pore sizes
lipoprotein TSKgel G5000PWXL
gelatin TSKgel GMPWXL G5000PWXLand large pore size,
G3000PWXL linear calibration curve
Peptides large TSKgel SuperSW3000, SuperSW2000 or small to medium
G3000SWXL/ SW/ G3000PWXL range pore size, versatile
TSKgel BioAssist G3SWXLor
G2000SWXL/ SW/
TSKgel BioAssist G2SWXL
small TSKgel G2500PWXL SuperSW2000 or linear calibration curve,
G2000SWXL/ SW high resolving power
Viruses TSKgel G6000PWXLor — large pore size, high resolving power
TSKgel G5000PWXL
Synthetic TSKgel GMPWXLor G5000PW and large pore size, low adsorption,
polymers TSKgel Alpha-M G3000PWXLor linear calibration curve
Alpha-5000 and Alpha-3000
Synthetic nonionic TSKgel G-Oligo-PW, G2500PWor small pore size, high resolving power
oligomers and cationic TSKgel G2500PWXLor SuperAW2500
TSKgel Alpha-2500
anionic TSKgel G2500PWXLor G2500PW or small pore size, ionic interaction
TSKgel Alpha-2500 SuperAW2500
Applications
Polynucleotides
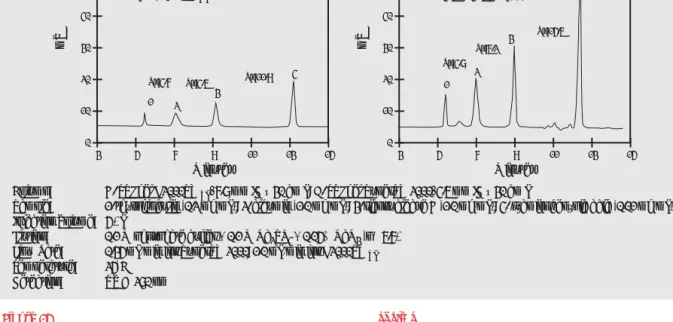
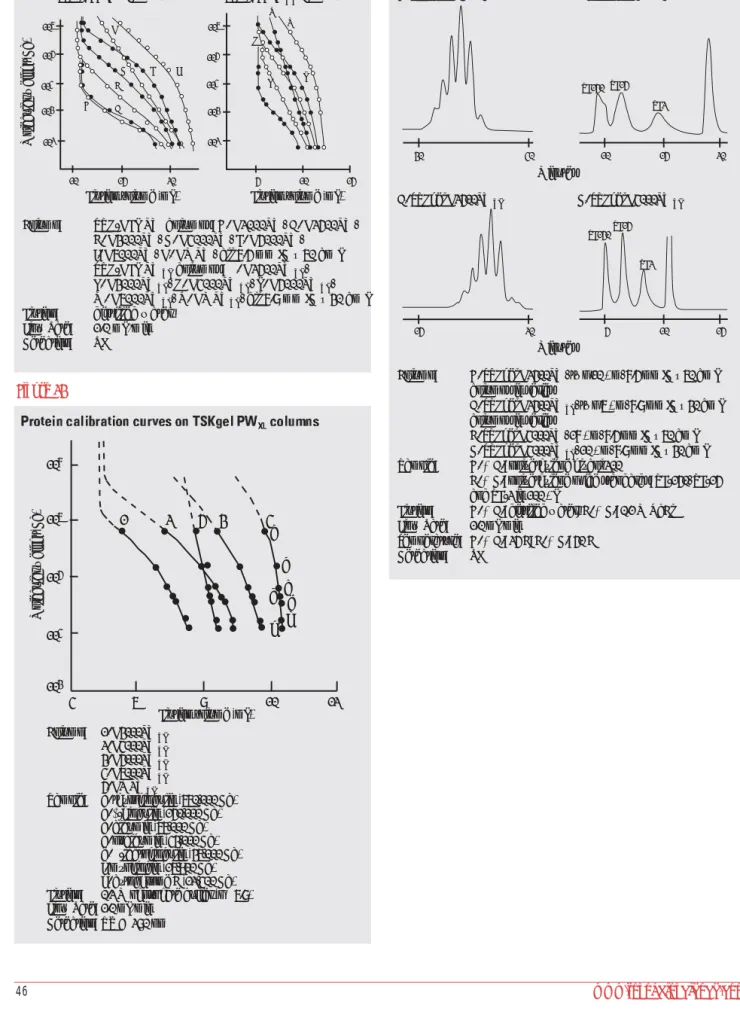
TSKgel G2000SW, G3000SW, G4000SW, and G5000PW columns are effective in separating double-stranded DNA fragments and ribosomal and transfer RNA. The choice of column is dependent on sample molecular weight. Small nucleic acids are adequately analyzed by using TSK-GEL SW columns. Larger nucleic acids should be analyzed with TSK-GEL PW columns of larger pore size, such as the TSKgel G-DNA-PW and TSKgel G5000PW columns. Calibration curves for double-stranded DNA fragments on TSK-GEL SW type columns and a TSKgel G5000PW column are shown in Figure 2; Table IIIlists the recommended TSK-GEL SW and TSK-GEL PW columns for separating double-stranded DNA and RNA fragments.
Separation of four E. coliRNAs, shown in Figure 3, confirms the better performance of TSK-GEL SW columns for samples with a wide molecular weight range. The sample consists of 4S tRNA (25,000 Da), 5S rRNA (39,000 Da), 16S rRNA (560,000 Da), and 23S rRNA (1,100,000 Da). All four polynucleotides are within the molecular weight range recommended for TSK-GEL SW type columns. The two chromatograms demonstrate a superior separation with the TSKgel G4000SW column.
Figure 2
TSK-GEL SW or TSK-GEL PW, two 7.5 mm ID x 60 cm L columns in series
22 fragments from HaeIII-cleaved pBR322 DNA and 6 fragments from EcoRI-cleaved pBR322 DNA 0.1 M NaCl in 0.1 M phosphate buffer, pH 7.0, plus 1 mM EDTA 1.0 mL/min UV @ 260 nm Column: Sample: Elution: Flow Rate: Detection: Elution Volume (mL) 101 20 30 40 Base Pairs TSKgel G5000PW TSKgel G4000SW TSKgel G3000SW TSKgel G2000SW 102 103 Figure 3 TSKgel G4000SW TSKgel G5000PW TSKgel G4000SW, two 13μm, 7.5 mm ID x 30 cm L columns in series TSKgel G5000PW, two 17 μm, 7.5 mm ID x 30 cm L columns in series
0.1 mL of 1:10 diluted solution of total E. coli RNA: 1. 23 s rRNA (1,100,000 Da),
2. 16 s rRNA (560,000 Da),
3. 5 s rRNA (39,000 Da), 4. 4 s tRNA (25,000 Da) 0.1 M NaCl in 0.1 M phosphate buffer, pH 7.0, plus 1 mM EDTA 1.0 mL/min UV @ 260 nm Column: Sample: Elution: Flow Rate: Detection: Minutes 20 30 40 50 20 30 40 1 2 3 4 1 2 3 4 Minutes Table III
Recommended TSK-GEL SW and TSK-GEL PW columns for separating double-stranded DNA and RNA fragments Base pairs of DNA Recommended column
< 55 TSKgel G2000SWXL/SW or G3000SWXL/SW or SuperSW2000 or 3000 55 – 110 TSKgel G3000SWXL/SW or SuperSW3000 110 – 375 TSKgel G4000SWXL/SW 375 – 1500 TSKgel G5000PWXL/PW 1000 – 7000 TSKgel G-DNA-PW
RNA (Da) Molecular Weight
< 60,000 TSKgel G2000SWXL/SW or G3000SWXL/SW or SuperSW2000 or 3000 60,000 – 120,000 TSKgel G3000SWXL/SW or SuperSW3000 120,000 – 1,200,000 TSKgel G4000SWXL/SW 1,200,000 – 10,000,000 TSKgel G5000PWXL
Note: To determine the approximate molecular weight (Da) of a DNA fragment, multiply the number of base pairs by 650.
Peptides
AsFigure 4shows, the calibration curves for TSKgel G2500PWXL and TSKgel G2000SWXLare very similar for samples below 3,000 Da. The data was generated using 17 samples ranging in size from myoglobin (17,800 Da) to glycine (75 Da). While the curves are similar in shape through this range of sample sizes, each sample molecule behaved differently on the two columns, indicating additional sample-resin interaction. For example, although an organic solvent was used to reduce hydrophobic effects, the elution of hydrophobic peptide leu-enkephalin was delayed on the TSKgel G2500PWXLcolumn.
Small peptides may be difficult to chromatograph by aqueous GFC, due to complex non-size effects such as ionic and hydrophobic interactions. The addition of organic solvents and
buffered salt solutions overcome these effects. Figure 5 compares the separation of two mixtures of peptides on both TSKgel G2500PWXLand TSKgel G2000SWXLcolumns to demonstrate which might be superior for a particular type of peptide. The first group of peptides had molecular weights ranging from 6,500 Da to 555 Da. In the second group, the range was from 75 Da to 17,800 Da. The chromatograms confirm that TSKgel G2000SWXLcolumns give higher resolution for most peptide mixtures, but do not perform as well as TSKgel G2500PWXLcolumns at peptide molecular weights lower than 1,000 Da. For very small peptides, the TSK-GEL PWXLcolumn type is preferable.
Figure 4
Molecular weight (Da)
Column: Sample: Elution: Flow Rate: Detection: Elution Volume (mL) TSKgel G2500PWXL, 6 μm, 7.8 mm ID x 30 cm L TSKgel G2000SWXL, 5μm, 7.8 mm ID x 30 cm L
1. myoglobin (17,800 Da), 2. aprotinin (6500 Da), 3. insulin (5807 Da), 4. big gastrin (3849 Da), 5. glucagon (3482 Da), 6. bombesin (1619 Da), 7. substance P (1347 Da), 8. bradykinin-potentiator B (1182 Da), 9. LH-RH (1182 Da),
10. oxytocin (1007 Da), 11. DSIP (848 Da), 12. leu-enkephalin (555 Da), 13. TRH (362 Da), 14. glutathione (307 Da), 15. tetraglycine (246 Da), 16. alanylvaline (188 Da), 17. glycine (75 Da) 45% CH3CN in 0.1% TFA, pH 3 1.0 mL/min UV @ 215 nm TSKgel G2000SWXL TSKgel G2500PWXL 102 103 104 1 1 2 3 4 5 12 6 7 8 9 7 10 2 3 4 5 6 8 10 9 11 11 12 13 13 14 14 15 15 16 16 17 17 4 6 8 10 ( ) ( ) Figure 5 Column: Sample: Elution: Flow Rate: Detection: Minutes Minutes Minutes Minutes A. TSKgel G2500PWXL, 6μm, 7.8 mm ID x 30 cm L B. TSKgel G2000SWXL, 5μm, 7.8 mm ID x 30 cm L
approximately 2.5 μg/40 μL each of: 1. aprotinin (6500 Da), 2. big gastrin (3849 Da), 3. bombesin (1619 Da),
4. oxytocin (1007 Da), 5. leu-enkephalin (555 Da), 6. myoglobin (17,800 Da), 7. glucagon (3482 Da), 8. LH-RH (1182 Da), 9. TRH (362 Da), 10. glycine (75 Da) 45% CH3CN in 0.1% TFA
0.2 mL/min (top pair); 0.5 mL/min (bottom pair) UV @ 215 nm A. TSKgel G2500PWXL B. TSKgel G2000SWXL 10 20 0 0 20 40 60 20 40 60 20 6 7 8 9 10 6 7 8 9 10 2 1 3 4 5 2 1 3 4 5 1
Proteins
In general, TSK-GEL SW columns have a fractionation range that matches the molecular weight range of most proteins and peptides. However, analytical methods that utilize combinations of TSK-GEL SW and TSK-GEL PW columns in series for isolating large lipoproteins (high and low density), chylomicron, etc. are illustrated in Figure 6.
As shown inFigure 7, successful elution of the hydrophobic amphoteric polymer collagen (a connective tissue protein) and gelatin on the TSKgel GMPW column requires the addition of 20% CH3CN to 0.1M NaNO3. Peak areas are reduced and elution is not reproducible when the organic solvent is omitted from the elution buffer for hydrophobic samples.
IgG
The most suitable column and mobile phase will depend on the particular components that need to be measured. TSK-GEL SWXL columns can provide fast, simplified quality control analyses of proteins, peptides and other large-size biopharmaceuticals. For example, a therapeutic solution of intravenous IgG may contain albumin as a stabilizer, and both proteins must be quantified following manufacture. Although literature reports describe the separation of these two proteins by many other chromatographic methods, long analysis times and complex gradient elutions are required. A method developed on TSKgel G3000SWXLprovides quantitative separation of the two proteins in 15 minutes with a simple, isocratic elution system. As shown in Figure 8, human albumin can be separated from a 20-fold excess of IgG, and quantified using an optimized elution buffer. This simple separation method can be applied to the isolation of other IgGs, such as monoclonal antibodies in ascites fluid.
Figure 6 G30 00S W X 2 G5000PW + G3000SW X 2 G6000PW + G3000SW G6000PW + G3000SW X 2 G5000PW + G3000SW 20 30 40 50 60 106 105 107 108 104
Molecular weight (Da)
Elution Volume (mL) Column: 7.5 mm ID x 60 cm L Sample: chylomicron VLDL LDL HDL2 HDL3 albumin ovalbumin
Elution: 0.1 M Tris-HCl buffer, pH 7.4 Flow Rate:
Detection: on-line post column reaction 1.0 mL/min Figure 7 collagen, Type VI A. distilled water gelatin, Type I 80 40 60 100 B. 0.1 M NaNO3 80 40 60 100 Minutes Minutes Minutes Column: Sample: Elution: Flow Rate: Detection: TSKgel GMPW, two 17 μm, 7.5 mm ID x 60 cm L columns in series
0.5 mL of 0.05-0.1% collagen, Type VI, or gelatin, Type I A. distilled water, B. 0.1 M NaNO3 in water,
C. 20% CH3CN in 0.1 M NaNO3 0.5 mL/min RI C. 20% CH3CN in 0.1 M NaNO3 80 40 60 100 Figure 8 5 0 0 15 Minutes Column: Sample: Elution: Flow Rate: TSKgel G3000SWXL, 5μm, 7.8 mm ID x 30 cm L
5μL of Venilon®, containing 237.5 mg of IgG and
12.5 mg of albumin
0.1 M Na2SO4 in 0.05 M sodium phosphate buff er, pH 5.0
1.0 mL/min optimized eluents
1
albumin IgG
Cleaning Procedures
Please see Appendix A for instructions on how to maintain and clean TSK-GEL Size Exclusion columns.
Improving resolution with SEC columns
• Verify that the column is not overloaded (refer to sample load information in the SW column section).
• Decrease the dead volume in the HPLC system by using the shortest tubing lengths and the smallest tubing ID possible without exceeding the maximum pressure for the column. • Decrease the flow rate, but not lower than 0.3 mL/min for
TSK-GEL SW and SWXLcolumns because increased diffusion will occur.
Note: TSK-GEL SuperSW columns show optimum resolution at flow rates below 0.3mL/min because of their small diameter.
• If using a 30 cm column, add an additional 30 cm column or switch to a TSK-GELXL-type column that has a smaller particle size. Resolution will improve more than two-fold. Alternatively, if using the SWXL-type columns, switch to the TSK-GEL SuperSW that offer increased sensitivity and resolution due to 50% more theoretical plates.
Literature
For additional information describing applications of Size Exclusion Chromatography columns, or how to select the optimal Size Exclusion Chromatography column, please contact our Technical Service specialists or refer to Tosoh HPLC database on our website: www.tosohbioscience.com.
Column selection
The three different pore sizes for the TSK-GEL SW packings results in different exclusion limits for several sample types, as shown by the calibration curves in Figure 9. From this data, recommended separation ranges for different sample types can be made for each column (TableIV). The ranges for polyethylene glycol (PEG) should be consulted when choosing a column for straight chain molecules, dextran for branched molecules, and globular proteins for globular molecules.
Standard TSK-GEL SW columns are packed with 10 μm particles (13 μm particles in G4000SW columns). The higher performance TSK-GEL SWXLversions are packed with 5 μm particles (8 μm particles in G4000SWXLcolumns).Figure 10 shows the improved resolution and reduced analysis time with a protein standard mixture on the TSK-GEL SWXLcompared with SW analytical columns. The calibration curves for protein standards for the three types of SW columns are compared on the TSK-GEL SWXL packings in Figure 11.
For preliminary research or reducing quality control testing time, the 15 cm long QC-PAK columns provide analysis times half as long as those on standard 30 cm columns, while retaining baseline resolution of many protein mixtures. They are available in glass or stainless steel packed with the high performance 5 μm TSK-GEL SWXLpackings. TSKgel QC-PAK GFC 200 columns contain the G2000SWXLpacking, while TSKgel QC-PAK GFC 300 columns contain the G3000SWXLpacking.
Highlights
• -NEW-PEEK column hardware available for SWXLpackings.
• TSK-GEL SW-type packings are comprised of rigid spherical silica gel chemically bonded with hydrophilic compounds.
• Low adsorption and well defined pore size distribution, which are required for high performance SEC. • Particles having three different pore sizes are available
packed as the standard SW or SWXL(higher resolution) columns.
• TSK-GEL SuperSW columns feature a 4 μm particle size packing in a narrower 4.6 mm ID column for the highest resolution and sensitivity in the SW series.
• The TSK-GEL SuperSW as well as the larger particle size TSK-GEL QC-PAK (fast analysis) columns are available in two pore sizes. (The properties and molecular weight ranges of these packings are summarized in Table IV). • Semi-preparative (21.5 mm ID) and preparative (55 mm,
108 mm ID) stainless steel columns are available for precise scale-up to commercial production.
Silica-based TSK-GEL SW, TSK-GEL SW
XL
and TSK-GEL SuperSW columns
for aqueous Gel Filtration Chromatography of proteins and peptides
Properties and separation ranges for TSK-GEL SW-type packings
Molecular weight of sample (Da)
TSK-GEL packing Particle Pore Globular Dextrans Polyethylene
Size (μm) Size (Å) proteins glycols and oxides
SuperSW2000 4 125 5,000–1.5 x 10⁵ 1,000–3 x 10⁴ 500–15,000 G2000SWXL 5 125 5,000–1.5 x 10⁵ 1,000–3 x 10⁴ 500–15,000 BioAssist G2SWXL 5 125 5,000–1.5 x 10⁵ 1,000–3 x 10⁴ 500–15,000 QC-PAK GFC 200 5 125 5,000–1.5 x 10⁵ 1,000–3 x 10⁴ 500–15,000 G2000SW 10, 13 125 5,000–1 x 10⁵ 1,000–3 x 10⁴ 500–15,000 SuperSW3000 4 250 1 x 10⁴–5 x 10⁵ 2,000–7 x 10⁴ 1,000–3.5 x 10⁴ G3000SWXL 5 250 1 x 10⁴–5 x 10⁵ 2,000–7 x 10⁴ 1,000–3.5 x 10⁴ BioAssist G3SWXL 5 250 1 x 10⁴–5 x 10⁵ 2,000–7 x 10⁴ 1,000–3.5 x 10⁴ QC-PAK GFC 300 5 250 1 x 10⁴–5 x 10⁵ 2,000–7 x 10⁴ 1,000–3.5 x 10⁴ G3000SW 10 250 1 x 10⁴–5 x 10⁵ 2,000–7 x 10⁴ 1,000–3.5 x 10⁴ G4000SWXL 8 450 2 x 10⁴–7 x 10⁶ 4,000–5 x 10⁵ 2,000–2.5 x 10⁵ BioAssist G4SWXL 8 450 2 x 10⁴–7 x 10⁶ 4,000–5 x 10⁵ 2,000–2.5 x 10⁵ G4000SW 13, 17 450 2 x 10⁴–7 x 10⁶ 4,000–5 x 10⁵ 2,000–2.5 x 10⁵
Data generated using the following conditions:
Columns: Two 4 μm, 4.6 mm ID x 30 cm L TSK-GEL SuperSW columns in series; two 5 μm, 7.8mm ID x 30 cm L TSK-GEL SWXLcolumns in series; two 10 μm, 7.5 mm ID x 60 cm L TSK-GEL SW columns in series Elution: Globular proteins: 0.3 M NaCl in 0.1 M (0.05 M for SWXLcolumns) phosphate buffer, pH 7 Table IV
To further improve efficiency and resolution, TSK-GEL SuperSW columns are filled with 4μm particles. These columns feature a 4.6 mm ID to provide better sensitivity in sample-limited cases. A minimum of 30,000 plates/column is guaranteed. Two pore sizes are available, 125 Å and 250 Å, which provide molecular weight ranges as shown in Table IV.Figure 12shows similarities of the calibration curves of the TSK-GEL SuperSW and SWXL. Chromatograms of a standard protein mixture in Figure 13 illustrate the increased sensitivity and resolution of the TSKgel SuperSW3000 compared with the TSKgel G3000SWXL.Figure 14 depicts the same benefits on the SuperSW2000.
The eluent plays an important role in determining the appropriate column for a separation. Since the structure of globular proteins is compact, the molecular weight exclusion limit for proteins is higher than for linear polymers such as polyethylene oxides, dextrans, or double-stranded DNA. However, when denaturing eluents are used, the exclusion limit for proteins becomes more like the exclusion limit for linear polymers. Table Vlists the suggested TSK-GEL SW and TSK-GEL PW columns for the separation of proteins and peptides with different eluents. Figure 15shows a calibration curve for proteins denatured with 0.1% SDS on the SuperSW3000. Figure 10 Minutes Minutes Column: Sample: Elution: Flow Rate: Detection:
Left: TSK-GEL SW, two 10 μm 7.5 mm ID x 30 cm L columns in series Right: TSK-GEL SWXL,
one 5 μm, 7.8 mm ID x 30 cm L column 1. glutamate dehydrogenase (55,000 Da) 2. lactate dehydrogenase (36,500 Da) 3. enolase (67,000 Da)
4. adenylate kinase (6,000 Da) 5. cytochrome C (12,400 Da)
0.3 M NaCl in 0.05 M phosphate buffer, pH 6.9 1.0 mL/min UV @ 220 nm TSKgel G3000SW TSKgel G3000SWXL 15 20 10 5 10 1 2 3 4 5 1 2 3 4 5
Higher resolution with 5 μm TSK-GEL SW compared with 10μm TSK-GEL SW columns
XL
Figure 9
TSKgel G2000SW TSKgel G3000SW TSKgel G4000SW
Column: Sample: Elution: Flow Rate: Detection: 106
Molecular weight (Da)
105
Elution volume (mL) Elution volume (mL)
TSK-GEL SW, two 7.5 mm ID x 60 cm L columns in series proteins, polyethylene oxides, dextrans
dextrans and polyethylene oxides: distilled water; proteins: 0.3 M NaCl in 0.1 M phosphate buffer, pH 7 1.0 mL/min UV @ 220 nm and RI 40 20 30 20 30 40 106 106 105 105 103 103 104 104 104 103 40 20 30 Elution volume (mL)
Figure 11 TSKgel G2000SWXL TSKgel G3000SWXL TSKgel G4000SWXL Elution volume (mL) 6 8 10 12 Column: Sample: Elution: TSK-GEL SWXL columns, 5 or 8μm, 7.8 mm ID x 30 cm L
1. thyroglobulin (660,000 Da); 2. IgG (156,000 Da); 3. bovine serum albumin (67,000 Da);
4. ovalbumin (43,000 Da); 5. peroxidase (40,200 Da); 6. β-lactoglobulin (35,000 Da); 7. myoglobin (16,900 Da);
8. ribonuclease A (13,700 Da); 9. cytochrome C (12,400 Da); 10. glycine tetramer (246 Da) 0.3 M NaCl in 0.1 M sodium phosphate buffer, pH 7
102 103 104 105 106 1 3 5 7 8 6 4 9 2 10
Molecular weight (Da)
TSKgel G2000SWXL TSKgel G3000SWXL TSKgel G4000SWXL Elution volume (mL) 6 8 10 12 102 103 104 105 106 1 3 5 7 8 6 4 9 2 10
Molecular weight (Da)
Column: Sample:
Elution: Detection:
TSK-GEL SWXL columns, 5 or 8μm, 7.8 mm ID x 30 cm L
1. thyroglobulin (660,000 Da); 2. IgG (156,000 Da); 3. bovine serum albumin (67,000 Da);
4. ovalbumin (43,000 Da); 5. peroxidase (40,200 Da); 6. β-lactoglobulin (35,000 Da); 7. myoglobin (16,900 Da);
8. ribonuclease A (13,700 Da); 9. cytochrome C (12,400 Da); 10. glycine tetramer (246 Da) 0.3 M NaCl in 0.1 M sodium phosphate buffer, pH 7 UV @ 220 nm Figure 12 5 6 100 1,000 10,000 100,000 1,000,000 7 8 9 10 11 12 Minutes MW Sample: Elution: Flow Rate: Temperature: Detection:
proteins: 1. thyroglobulin (670,000 Da); 2.γ-globulin (155,000 Da); 3. BSA (66,300 Da); 4.β-lactoglobulin (18,400 Da); 5. lysozyme (14,300 Da); 6. cytochrome C (12,400 Da); 7. triglycine (189 Da) 0.15 M phosphate buffer (pH 6.8)
0.35 mL/min for SuperSW; 1.0 mL/min for SWXL
25°C UV @ 280 nm (220 nm for triglycine) SuperSW2000 G2000SWXL SuperSW3000 1 2 3 4 5 6 7 G3000SWXL Figure 13 Minutes Column: Sample: Elution: Flow Rate: Temperature: Detection:
A.TSKgel G3000SWXL, 7.8mm ID x 30 cm L; B. TSKgel Super SW3000, 4.6 mm ID x 30 cm L
5 μL of a mixture of 1. thyroglobulin, 0.5 mg/mL (660,000 Da); 2. γ-globulin, 1.0 mg/mL; (150,000 Da); 5.p-aminobenzoic acid, 0.01 mg/mL (137 Da)
0.1 M Na2SO4 in 0.1 M phosphate buffer with 0.05% NaN3, pH 6.7
1.0 mL/min for G3000SWXL; 0.35 mL/min for SuperSW3000
25
˚
C UV @ 220 nm 0 10 20 30 40 50 3 5 7 9 11 13 15 0 10 20 30 40 50 3 5 7 9 11 13 15 5 Rs: 10.7 4 Rs: 4.0 2 3 Rs: 3.5 1 5 4 3 2 1 RS: 8.4 RS: 3.0 RS: 3.3 A. G3000SWXL B. SuperSW3000 mV MinutesRecommended TSK-GEL SW and TSK-GEL PW columns for separating peptides and proteins
Sample (Da) Recommended column
Peptides with 45% CH3CN in 0.1% TFAa 500 – 2.5 x 10⁴ TSKgel G2000SW XLb/BioAssist G2SWXLb/ SuperSW2000b 100 – 5 x 10³ TSKgel G2500PW XLc 1,000 – 5 x 10⁴ TSKgel G3000PW XLd
Peptides and proteins
with 0.1% SDS in 0.1 M phosphate, pH 7.0 1,000 – 2.5 x 10⁴ TSKgel G2000SW XL/SW/BioAssist G2SWXLor SuperSW2000 10,000 – 7 x 10⁴ TSKgel G3000SW XL/SW/BioAssist G3SWXLor SuperSW3000 15,000 – 3 x 10⁵ TSKgel G4000SW XLor SW
with 6M guanidine-HCl in 0.1M phosphate, pH 6.0
1,000 – 2.5 x 10³ TSKgel G2000SW XL/SW/BioAssist G2SWXLor SuperSW2000 2,000 – 7 x 10⁴ TSKgel G3000SW XL/SWe/BioAssist G3SWXLor SuperSW3000 3,000 – 4 x 10⁵ TSKgel G4000SW XL/SW Proteins
with 0.3 M NaCl in 0.05 ~ 0.1 M phosphate, pH 7.0
5 x 10³ – 1 x 10⁵ TSKgel G2000SW XL/SW/BioAssist G2SWXLor SuperSW2000 1 x 10⁴ – 5 x 10⁵ TSKgel G3000SW XL/SW/BioAssist G3SWXLor SuperSW3000 2 x 10⁴– 7 x 10⁶ TSKgel G4000SW XLor SW Notes:
a Proteins may denature in this eluent, increasing the apparent molecular weight. b Recommended as first column for peptide separation since it offers high resolution across
a wide fractionation range.
c Recommended for small peptides. Lower overall resolution than the SW column, but durable to alkaline solutions.
d Recommended for larger peptides. TSKgel G3000SWXL is also effective with mild buffer for peptide fragments with molecular weight >10,000 Da. e TSKgel G4000SW or SWXL is recommended for polypeptides above 60,000 Da.
Figure 14 3 5 7 9 11 13 15 0 10 20 30 40 50 60 Minutes mV Column: Sample: Injection Volume: Elution: Flow Rate: Temperature: Detection:
A. TSKgel G2000SWXL, 7.8 mm ID x 30 cm L; B. TSKgel SuperSW2000, 4.6 mm ID x 30 cm L
1. thyroglobulin (0.2 mg/mL); 2. albumin (1.0 mg/mL); 3. ribonuclease A (1.0 mg/mL); 4. p-aminobenzoic acid (0.01 mg/mL) 5μL
0.1 M phosphate buffer + 0.1 M Na2SO4+ 0.05% NaN3 (pH 6.7)
0.35 mL/min for SuperSW2000; 1.0 mL/min for G2000SWXL
25°C UV @ 280 nm 1 Rs:4.7 Rs:4.6 Rs:11.9 2 3 4 G2000SWXL 3 5 7 9 11 13 15 0 10 20 30 40 50 60 Minutes mV 1 Rs:4.8 Rs:6.2 Rs:15.6 2 3 4 SuperSW2000
Comparison of chromatograms of proteins on TSKgel SuperSW2000 and TSKgel G2000SWXL
A. B. Table V Figure 15 5 6 10,000 100,000 Minutes Molecular W eight (Da) Sample: Eluent: Flow Rate: Temperature: Detection: proteins*: 1. phosphorylase (94,000 MW); 2. BSA (67,000 MW); 3. ovalbumin (43,000 MW); 4. carbonic anhydrase (30,000 MW);
5. soybean trypsin inhibitor (20,100 MW); 6.α-lactalbumin (14,400 MW)
50 mM-200 mM phosphate buffer (pH 6.8) containing 0.1% 0.35 mL/min
25°C UV @ 280 nm
7 8 9
*Proteins are denatured in phosphate buffer containing SDS and DTT at 40˚C during 15 min.
50 mM PB 100 mM PB 200 mM PB
Applications
Proteins
The effect of different concentrations of surfactant on the separation of membrane proteins is seen in Figure 16. As the concentration of octaethyleneglycol dodecylether increases to 0.05%, the main peak becomes sharper and recovery increases. The TSKgel SuperSW3000 provides an excellent high resolution separation of IgG1from mouse ascites fluid as can be seen in Figure 17.
Enzymes
Mobile phase conditions in GFC are optimized to ensure none or minimal interaction of the sample with the packing material. This gentle technique allows for high recovery of enzymatic activity. For example, crude samples of peroxidase and glutathione S-transferase were separated in only 15 minutes on a TSKgel G3000SWXLcolumn, and activity recovery was 98% and 89% respectively. The elution profiles of the separations in Figure 18show that all of the activity eluted in a narrow band of about 1.5 mL. Minutes Column: Sample: Elution: Flow Rate: Detection: TSKgel G3000SW, 7.5 mm ID x 60 cm L Membrane protein from a crude extract from rat liver microsome
(0.2 M sodium chloride + 20% glycerol + octaethyleneglycol dodecylether) in 50 mM phosphate buffer, pH 7.0. Note: concentration of surfactant: (1) 0.005%, (2) 0.01%, (3) 0.025%, (4) 0.05% 1.0 mL/min UV @ 280 nm 10 20 30 40 (1) (2) (3) (4) Figure 16 A. crude peroxidase
B. crude glutathione S-transferase
Minutes Minutes Column: Sample: Elution: Flow Rate: Detection: Recovery: TSKgel G3000SWXL, 5 μm, 7.8 mm ID x 30 cm L
A. crude peroxidase from Japanese radish, 0.15 mg in 0.1 mL
B. crude glutathione S-transferase from guinea pig liver extract, 0.7 mg in 0.1 mL
0.3 M NaCl in 0.05 M phosphate buffer, pH 7 1.0 mL/min
UV @ 220 nm (solid line) and enzyme assay tests (dashed line)
enzymatic activity recovered was 98% in A and 89% in B
0 5 10 15 0 5 10 15 Figure 18 Column: Sample: Elution: Flow Rate: Detection: TSKgel SuperSW3000, 4.6 mm ID x 30 cm L 5 μM of IgG1 from mouse ascites 0.2 M phosphate buffer, pH 6.7 0.35 mL/min
UV @ 280 nm micro flow cell Minutes
5 7 9 11 13 15
(mV)
IgG1
Optimizing GFC with TSK-GEL SW, SW
XL
and
SuperSW Columns
Sample Load
In all modes of chromatography, high sample loads distort peak shapes and cause an overall decrease in efficiency due to column overload. Sample loads may be increased by using organic solvents to enhance the solubility of the sample or by using higher column temperatures to lower the viscosity of the mobile phase. When recovering protein activity, however, these techniques are usually not recommended.
The sample load limitations of TSK-GEL SW and TSK-GEL SWXL analytical and semi-preparative columns are shown in Figure 19. At protein injections higher than 0.8 mg, HETP increases rapidly and column efficiency decreases with GEL SW and TSK-GEL SWXLanalytical columns. Sample concentrations in the
range of 1-20 mg/mL are recommended, but proteins can be loaded at higher concentrations and higher total loads than synthetic macromolecules. For example, a TSKgel G3000SW semi-preparative column can provide high efficiency for 100 mg of bovine serum albumin (BSA) shown in Figure 19. For a synthetic, linear polyethylene glycol (7,500 Da), sample loads higher than 20 mg cause a rapid increase in HETP.
SuperSW columns provide excellent resolution at a sample load of less than 0.3 mg of BSA as seen in Figure 20. A sample volume less than 20 μL is recommended for the SuperSW2000 column, and less than 80 μL for the SuperSW3000 column, illustrated in Figure 21. However, a 5 μL injection ensures optimal results. If a larger sample load is necessary, a 7.5 mm ID x 60 cm L SW column has twice the capacity of a 30 cm SWXLcolumn with very little loss of resolution.
A. TSKgel G3000SWXL, 5μ m, 7.8 mm ID x 30 cm L
TSKgel G3000SW, 10μm, 7.5 mm ID x 30 cm L B. TSKgel G3000SW, 13μm, 21.5 mm ID x 60 cm L , two columns in series
A. bovine serum albumin in 100μL
B. PEG 7500 or bovine serum albumin in 4 mL A. 0.3 M NaCl in 0.05 M phosphate buffer, pH 7 B. 0.3 M NaCl in 0.1 M phosphate buffer, pH 7 A. 1.0 mL/min,
B. 4.0 mL/min, 16.0 mL/min BSA: UV @ 220 nm, PEG 7500: RI A. Analytical TSK-GEL SW and TSK-GEL SWXL Columns
HETP ( μ m) 2 1 0 2 1 0 Column: Sample: Elution: Flow Rate: Detection: Sample Loading (mg) 0 10 100 1000 10 100 1000 PEG 7500
Bovine Serum Albumin Sample Loading (mg) 0.6 0.4 0.2 0 HETP ( μ m) 0 0.01 0.1 1
B. Semipreparative TSK-GEL SW Columns
Figure 19 Sample Loading (mg) A. B. HETP ( μ m) 0 20 40 60 80 100 0.01 0.1 1 10 120 140 0 20 40 60 80 100 0.01 0.1 1 10 120 140 SuperSW2000 G2000SWXL G3000SWXL SuperSW3000
Column: A. TSKgel SuperSW2000, 4.6 mm IDx 30 cm L and TSKgel G2000SWXL, 7.8 mm ID x 30cm L
B. TSKgel SuperSW3000, 4.6 mm ID x 30 cm L and TSKgel G3000SWXL, 7.8 mm ID x 30 cm L
Sample: 10 μL of bovine serum albumin
Elution: 0.1 M NaCl in 50 mM phosphate buffer (pH 6.7) Flow Rate: 0.2 mL/min for SuperSW; 0.57 mL/min forSWXL
Detection: UV @ 280 nm Sample Loading (mg) HETP ( μ m) Figure 20
Selecting mobile phase buffers
Proper selection of elution conditions is necessary to maximize molecular sieving mechanisms and to minimize secondary effects, such as ionic and hydrophobic interactions between the sample and the column packing material. Under conditions of high ionic strength (>1.0 M), hydrophobic interactions may occur. Under low ionic strength (<0.1 M), ionic interactions are more likely to occur. Secondary interactions take place more often with small solutes since the residual silanol sites of TSK-GEL SW packings are mainly located in small pores, which are accessible to small solutes. In general, the use of relatively high ionic strength buffers can be used to overcome secondary interactions. A neutral salt, such as sodium sulfate, is often added to increase buffer ionic strength.
While the extent of secondary interactions is not as great for proteins as for smaller molecules, complex interactions can occur. For each protein, there will be an optimum buffer type and concentration that results in the highest resolution and recovery. As shown in Table VI, resolution among protein samples varies according to buffer type and strength. Although each salt used has the same molar concentration in the mobile phase, each provides a different ionic strength, from the lowest in strength, sodium chloride, to the highest, ammonium phosphate. The ionic species of the mobile phase will also affect the separation, shown in Table VI, by the difference in resolution values for the different salts. In addition, calibration curves for proteins in potassium phosphate buffers are more shallow than those generated in sodium phosphate buffers, while the slope of
the curve in Sorenson buffer (containing both Na+and K+) is midway between the slopes generated with either cation alone. Table VIIillustrates the impact of different buffer conditions on mass recovery for six sample proteins. In this case, the mass recovery of proteins is higher with sodium or potassium phosphate buffers (pH 6.9) than with Tris-HCl buffers (pH 7.8). If hydrophobic interaction occurs between the sample and the column matrix, up to 100% water soluble organic, such as acetonitrile, acetone, methanol or ethanol, can be added to the mobile phase. Alternatively, 1% nonionic detergent (0.1% SDS), 8M urea, or 6 M guanidine can be used. Viscous mobile phases may require a flow rate reduction if the maximum pressure is exceeded (listed on the Operating Condition and Specification [OCS] sheet or the Ordering Information section at the end of this catalog section).
Choice of mobile phase pH
The optimal buffer pH for a separation depends on the protein’s isoelectric point (pI) and the stability of the packing. In general, Tosoh Bioscience recommends the use of a buffer with a pH that is different from the pI of the protein so the protein will carry an overall net positive or negative charge. This generally increases the protein’s stability. The pH stability of TSK-GEL SW packings ranges from 2.5 to 7.5. If the separation must be performed under basic conditions, the pH stable polymer-based TSK-GEL PW or TSK-GEL Alpha columns should be used.
Sample Volume (μL) Column: Sample: Elution: Flow Rate: Detection:
A. TSKgel SuperSW2000, 4.6 mm ID x 30 cm L and TSKgel G2000SWXL, 7.8 mm ID x 30 cm L
B. TSKgel SuperSW3000, 4.6 mm ID x 30 cm L and TSKgel G3000SWXL, 7.8 mm ID x 30 cm L
1 mg/mL of bovine serum albumin
0.1 M Na2SO4 in 50 mM phosphate buffer (pH 6.7)
0.20 mL/min for Super SW; 0.57 mL/min for SWXL
UV @ 280 nm A. B. 1 10 100 1000 SuperSW2000 G2000SWXL G3000SWXL SuperSW300 0 HETP ( μ m) 0 20 40 60 80 0 10 20 30 40 1 10 100 1000 Sample Volume (μL) Figure 21
Table VI
Table VII
Resolution factors (Rs) of proteins with various ionic species added to the elution buffer
Da 0.2 M (NH4)2HPO4 0.2 M Na2SO4 0.2 M (NH4)2SO4 0.2 M MgCl2 0.2 M NaCl Glutamate dehydrogenase 280,000 1.4 1.1 1.5 1.3 1.5 Alcohol dehydrogenase 150,000 0.4 0.5 0.2 0.5 0.6 Glutathione reductase 113,000 0.9 1.1 0.9 0.9 1.2 Enolase 67,000 1.1 0.8 1.3 0.8 0.4 Ovalbumin 43,000 1.3 1.3 1.4 1.9 2.2 Trypsinogen 24,000 1.0 0.5 0.2 0.8 0.9 Cytochrome C 12,400 Column: TSKgel G3000SW, 7.5 mm ID x 30 cm L
Elution: 0.05 M GTA buffer, pH 7.0 (G: 3,3-dimethylglutaric acid, T: trishydroxyaminomethane, A: 2-amino-2-methyl-1,3-propanediol) plus indicated salt Detection: UV @ 220 nm
〉
〉
〉
〉
〉
〉
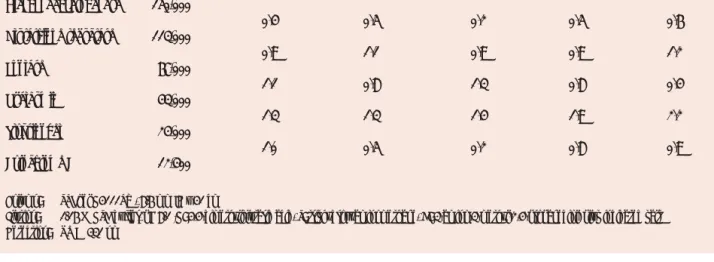
Effect of buffer composition
on mass recovery of proteins on TSKgel G3000SW
Protein Recovery (%)
A. Sodium B. Potassium C. Tris-HCl phosphate phosphate buffer buffer buffer Cytochrome C 98 101 92 Lysozyme 92 96 75 α-Chymotrypsinogen 95 98 90 IgG 95 98 88 Thyroglobulin 94 94 85 Ovalbumin 96 92 66 Column: TSKgel G3000SW, 7.5 mm ID x 60 cm L Elution: A. 0.2 M NaH2PO4and 0.2 M Na2HPO4, pH 6.9;
B. 0.2 M KH2PO4and 0.2 M K2HPO4, pH 6.9;
C. 0.2 M NaCl and 0.05 M Tris-HCl, pH 7.8 Flow Rate: 1.0 mL/min
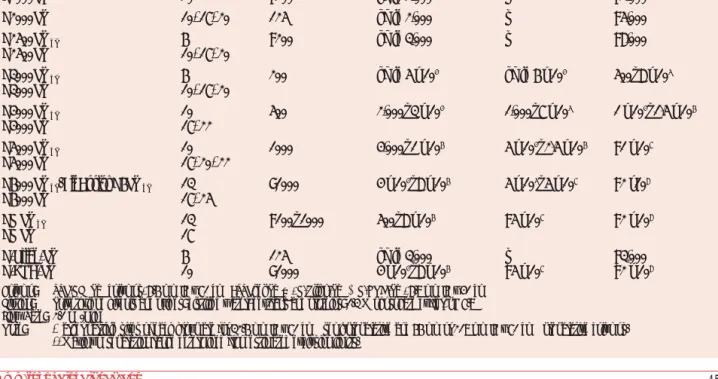
Ordering Information
Analytical and preparative TSK-GEL Size Exclusion silica-based column products: typical properties See Appendix A for total column volumes and void volumes for each column size
Part # Description ID Length Particle Min. Number Flow Rate (mL/min) Maximum (mm) (cm) Size (μm) Theoretical Range Max. Pressure
Plates Drop (kg/cm2) Glass columns 16214 QC-PAK GFC 200, Glass, 125 Å 8.0 15 5 10,000 0.5 – 1.0 1.2 40 16216 QC-PAK GFC 300, Glass, 250 Å 8.0 15 5 10,000 0.5 – 1.0 1.2 40 08799 G2000SW, Glass, 125 Å 8.0 30 10 10,000 0.4 – 0.8 0.8 20 08800 G3000SW, Glass, 250 Å 8.0 30 10 10,000 0.4 – 0.8 0.8 20 08801 G4000SW, Glass, 450 Å 8.0 30 13 8,000 0.4 – 0.8 0.8 20 14464 G3000SW, Glass, 250 Å 20.0 30 13 6,000 3.0 – 6.0 8.0 8
Stainless steel columns
18674 SuperSW2000, 125 Å 4.6 30 4 30,000 0.1 – 0.35 0.4 120 18675 SuperSW3000, 125 Å 4.6 30 4 30,000 0.1 – 0.35 0.4 120 08540 G2000SWXL, 125 Å 7.8 30 5 20,000 0.5 – 1.0 1.2 70 08541 G3000SWXL, 250 Å 7.8 30 5 20,000 0.5 – 1.0 1.2 70 08542 G4000SWXL, 450 Å 7.8 30 8 16,000 0.5 – 1.0 1.2 35 16215 QC-PAK GFC 200, 125 Å 7.8 15 5 10,000 0.5 – 1.0 1.2 40 16049 QC-PAK GFC 300, 250 Å 7.8 15 5 10,000 0.5 – 1.0 1.2 40 05788 G2000SW, 125 Å 7.5 30 10 10,000 0.5 – 1.0 1.2 20 05789 G3000SW, 250 Å 7.5 30 10 10,000 0.5 – 1.0 1.2 25 05790 G4000SW, 450 Å 7.5 30 13 8,000 0.5 – 1.0 1.2 15 05102 G2000SW, 125 Å 7.5 60 10 20,000 0.5 – 1.0 1.2 40 05103 G3000SW, 250 Å 7.5 60 10 20,000 0.5 – 1.0 1.2 50 05104 G4000SW, 450 Å 7.5 60 13 16,000 0.5 – 1.0 1.2 30 06727 G2000SW, 125 Å 21.5 30 13 10,000 3.0 – 6.0 8.0 10 06728 G3000SW, 250 Å 21.5 30 13 10,000 3.0 – 6.0 8.0 15 06729 G4000SW, 450 Å 21.5 30 17 8,000 3.0 – 6.0 8.0 10 05146 G2000SW, 125 Å 21.5 60 13 20,000 3.0 – 6.0 8.0 20 05147 G3000SW, 250 Å 21.5 60 13 20,000 3.0 – 6.0 8.0 30 05148 G4000SW, 450 Å 21.5 60 17 16,000 3.0 – 6.0 8.0 20 07428 G2000SW, 125 Å 55.0 30 20 4,000 15.0 – 25.0 50.0 10 07481 G3000SW, 250 Å 55.0 30 20 4,000 15.0 – 25.0 50.0 10 07429 G2000SW, 125 Å 55.0 60 20 9,000 15.0 – 25.0 50.0 15 07482 G3000SW, 250 Å 55.0 60 20 9,000 15.0 – 25.0 50.0 15 PEEK Columns 20027 BioAssist G2SWXL-NEW- 7.8 30 5 20,000 0.5 – 1.0 1.2 70 20026 BioAssist G3SWXL -NEW- 7.8 30 5 20,000 0.5 – 1.0 1.2 70 20027 BioAssist G4SWXL -NEW- 7.8 30 8 16,000 0.5 - 1.0 1.2 35
Pore Sizes: SuperSW2000, QC-PAK GFC 200, G2000SW, G2000SWXLand BioAssist G2SWXL= 125 Å; SuperSW3000, QC-PAK GFC 300, G3000SW, G3000SWXLand
Ordering Information
Analytical and preparative TSK-GEL Size Exclusion silica-based column products: typical properties (continued)
See Appendix A for total column volumes and void volumes for each column size
Part # Description ID Length Particle
(mm) (cm) Size (μm)
Guard columns
08805 SW Guard column, Glass 8.0 4.0 10 For all 8 mm ID SW and QC-PAK glass
14465 SW Guard column, Glass 20.0 4.0 20 For P/N 14464 SW glass
18762 SuperSW Guard column 4.6 3.5 4 For 4.6 mm ID SuperSW
(contains SuperSW3000 packing)
08543 SWXLGuard column 6.0 4.0 7 For all SWXLand P/Ns 16215 and 16049
(contains 3000SWXLpacking)
18008 SWXLGuard column, PEEK 6.0 4.0 7 For all BioAssist SWXL, PEEK columns
05371 SW Guard column 7.5 7.5 10 For all 7.5 mm ID SW
(contains 3000SW packing)
05758 SW Guard column 21.5 7.5 13 For all 21.5 mm ID SW
07427 SW Guard column 45.0 5.0 20 For 55 mm ID SW
Bulk packing
08544 SWXLTop-Off, 1g wet gel 5 For SWXLand QC-PAK
Polymeric TSK-GEL PW and TSK-GEL PWXLcolumns are designed for Gel Filtration Chromatography (GFC) of water soluble organic polymers, proteins, peptides, polysaccharides, oligosaccharides, DNA, and RNA.
Column Selection
The properties and molecular weight separation ranges for all TSK-GEL PW type columns are summarized in Table VIII. Resins with six pore sizes are available. Particle sizes of resins packed in TSK-GEL PW columns are 10 μm, 17 μm, 20 μm, or 22 μm. The resins in TSK-GEL PWXLcolumns are 6 μm, 10 μm, or 13 μm. Thus, PXXL resins are higher performance versions of the TSK-GEL PW resins due to the smaller particle sizes. Specialty resin-based columns
include the mixed-bed TSKgel GMPW and TSKgel GMPWXLfor samples with a broad molecular weight range. They also include TSKgel G-Oligo-PW and TSKgel G-DNA-PW columns for oligosaccharides and for DNA or RNA respectively.
The eluent plays an important role in determining the appropriate column for a separation. Since the structure of globular proteins is compact, the molecular weight exclusion limit for proteins is higher than for linear polymers such as polyethylene oxides, dextrans or double-stranded DNA. However, when denaturing eluents are used, the exclusion limit for proteins is comparable to the exclusion limit for linear polymers. Therefore, consult Table Vin the SW section for help in choosing a column. Use the molecular weight ranges for PEO in Table VIIIwhen choosing a column for linear molecules; dextran for branched molecules, and globular proteins for globular molecules. Calibration curves for polyethylene glycols chromatographed on TSK-GEL PW and TSK-GEL PWXLcolumns are shown in Figure 22. Protein calibration curves on TSKgel PWXL columns are presented in Figure 23. Although many methods for polymer analysis have been satisfactorily developed on TSK-GEL PW columns, higher resolution can be achieved with a TSK-GEL PWXLcolumn. The smaller particle sizes of the TSK-GEL PWXL columns provide almost 2.5 times the resolution of their TSK-GEL PW counterparts. In addition, with shorter TSK-GEL PWXLcolumns, higher resolution separations are possible in less than half the time, as shown in Figure 24with polyethylene glycol and polyethylene oxide standards.
For analytical purposes, the TSK-GEL PWXLcolumns are preferred. For preparative work, or for other cases in which large amounts of sample must be used, the 60 cm TSK-GEL PW columns are recommended because of their increased loading capacity.
Polymer-based TSK-GEL PW and TSK-GEL PW
XL
columns
for Gel Filtration Chromatography of water soluble polymers
Highlights
• -NEW- PEEK column hardware available for G6000PW
packings for ultra-low sample adsorption during virus analysis.
• Hydrophilic, rigid, spherical, porous methacrylate beads. • Excellent chemical and mechanical stability.
• pH range of 2 to 12, with up to 50% organic solvent • Temperatures up to 80˚C (50˚C for TSKgel G-DNA-PW). • Wide molecular weight separation range up to 8 x 10⁶Da
for linear polymers
• Available in analytical (7.5 mm & 7.8 mm ID), semi-preparative (21.5 mm ID) and semi-preparative (55 mm and 108 mm ID) columns.
Properties and molecular weight separation ranges for TSK-GEL PW packings
Molecular weight of sample (Da)
TSKgel column Particle Average Polyethylene Dextrans** Globular
Size*(μm) pore Size (Å) glycols & oxides proteins**
G1000PW 10 <100 up to 1,000 — <2,000 G2000PW 10, 17, 20 125 up to 2,000 — <5,000 G2500PWXL 6 <200 up to 3,000 — <8,000 G2500PW 10, 17, 20 G3000PWXL 6 200 up to 5 x 10 4 up to 6 x 10⁴ 500–8 x 10⁵ G3000PW 10, 17, 20 G4000PWXL 10 500 2,000–3 x 10 4 1,000–7 x 10⁵ 1 x 10⁴–1.5 x 10⁶ G4000PW 17, 22 G5000PWXL 10 1000 4,000–1 x 10 6 5 x 10⁴–2.5 x 10⁶ <1 x 10⁷ G5000PW 17, 20, 22 G6000PWXL/BioAssist G6PWXL 13 >1000 4 x 10 4–8 x 10⁶ 5 x 10⁵–5 x 10⁷ <2 x10⁸ G6000PW 17, 25 GMPWXL 13 <100–1000 500–8 x 10 6 <5 x 10⁷ <2 x 10⁸ GMPW 17 G-Oligo-PW 6 125 up to 3,000 — <3,000 G-DNA-PW 10 >1000 4 x 10⁴–8 x 10⁶ <5 x 10⁷ <2 x 10⁸
Column: TSK-GEL PW columns, 7.5 mm ID x 60 cm L; TSKgel PWXL, G-Oligo-PW & G-DNA-PW, 7.8 mm ID x 30 cm L Elution: Polyethylene glycols and oxides: distilled water; dextrans and proteins: 0.2 M phosphate buffer, pH 6.8 Flow Rate: 1.0 mL/min
Note: *Larger particle sizes of each group are for 21.5 mm ID x 60 cm L semi-preparative and 55 mm or 108 mm ID x 60 cm L preparative columns.
Column: 1. G3000PWXL 2. G4000PWXL 3. G5000PWXL 4. G6000PWXL 5. GMPWXL
Sample: a. thyroglobulin (660,000 Da) b.γ-globulin (150,000 Da) c. albumin (67,000 Da) d. ovalbumin (43,000 Da) e.β-lactoglobulin (36,000 Da) f. myoglobin (16,900 Da) g. cytochrome C (12,400 Da) Elution: 0.2 M phosphate buffer (pH 6.8) Flow Rate: 1.0 mL/min
Detection: UV @ 280 nm
Molecular weight (Da)
104 103 105 106 107 5 1 2 3 4 a b c d e f g 4 6 8 10 12 Elution volume (mL) Elution volume (mL) Column: Elution: Flow Rate: Detection: TSK-GEL PW columns: A. G2000PW, B. G2500PW, C. G3000PW, D. G4000PW, E. G5000PW, F. G6000PW, G. GMPW, all 7.5 mm ID x 60 cm L TSK-GEL PWXL columns: H. G2500PWXL, J. G3000PWXL, K. G4000PWXL, L. G5000PWXL, M. G6000PWXL, N. GMPWXL, all 7.8 mm ID x 30 cm L distilled water 1.0 mL/min RI 5
TSK-GEL PW Columns TSK-GEL PWXL Columns
Molecular weight (Da)
10 15 10 15 20 102 103 104 105 106 H J N K L M 102 103 104 105 106 G E F C D A B Elution volume (mL) Minutes Minutes Column: Sample: Elution: Flow Rate: Temperature: Detection: A. TSKgel G2500PW, two 10μm, 7.5 mm ID x 60 cm L columns in series B. TSKgel G2500PWXL, two 6μm, 7.8 mm ID x 30 cm L columns in series C. TSKgel G4000PW, 17μm, 7.5 mm ID x 60 cm L D. TSKgel G4000PWXL, 10μm, 7.8 mm ID x 30 cm L
A. & B.: polyethylene glycol 200
C. & D.: polyethylene oxide standards: SE-150, SE-15 and SE-2 in 100μL
A. & B.: distilled water; C. & D.: 0.1 M NaCl 1.0 mL/min A. & B.: 25˚C; C. & D.: 50˚C RI SE150 B. TSKgel G2500PWXL C. TSKgel G4000PW D. TSKgel G4000PWXL A. TSKgel G2500PW 30 40 10 15 20 15 20 5 10 15 SE15 SE2 SE150 SE15 SE2
Faster analysis and higher resolution with TSK-GEL PWXL columns
Figure 22 Figure 24
TSKgel Oligo PW
The specialty column TSKgel Oligo PW is designed for high resolution separations of nonionic and cationic oligomers. Because of the presence of residual cationic groups, this column is not recommended for separating anionic materials. The polyethylene glycol and polythylene oxide calibration curves for TSKgel G-Oligo-PW (not shown) are identical to TSKgel G2500PWXLshown in Figure 22.
TSKgel G-DNA-PW
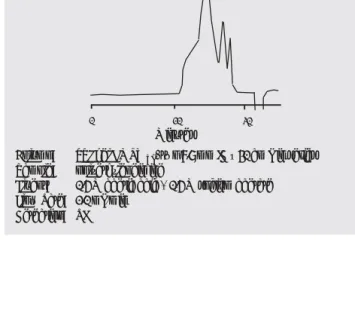
The TSKgel G-DNA-PW column is dedicated to the separation of large polynucleotides, such as DNA and RNA fragments of 500 to 5,000 base pairs. Figure 25shows a calibration curve for double-stranded DNA on the G-DNA-PW column. The exclusion limits for double-stranded DNA fragments are lower than those for rRNAs, indicating that double-stranded DNA fragments have a larger effective molecular weight in solution than rRNAs of the same molecular weight. The packing has very large pores (>1000 Å) and a small particle size (10 μm).
For the separation of large DNA fragments greater than 1,000 base pairs, a four-column system is typically required. Baseline resolution of DNA fragments up to 7,000 base pairs can be achieved, provided there is a two-fold difference in the chain length of the fragments. Figure 26shows the elution of double-stranded DNA fragments, obtained from pBR322 DNA cleaved by both EcoRI and BstNI, on four TSKgel G-DNA-PW columns in series. The eluted peaks were collected and subjected to polyacrylamide gel electrophoresis, which showed almost complete separation of the 1060, 1857, and 4362 base pair fragments. Although lower flow rates typically yield better separations of most fragments, the resolution of the 1857 and 4362 base pair fragments was slightly greater at the higher flow rate, as shown in Figure 26B.
TSKgel GMPW and TSKgel GMPWXL
When the molecular weight range of the sample is broad or unknown, Tosoh Bioscience offers two mixed-bed columns, TSKgel GMPW and TSKgel GMPWXL, for analysis. The TSKgel GMPW column and its high resolution counterpart, TSKgel GMPWXL, are packed with the G2500, G3000 and G6000 PW or corresponding PWXLresins. They offer a broad molecular weight separation range. As shown in Figure 22, the calibration curve for polyethylene glycols and oxides on these mixed-bed columns
is linear over the range of 100-1,000,000 Da.
The introduction of mixed-bed columns has made the problems of chromatographing polydisperse samples much easier. Previously, many two-column systems, such as TSKgel G3000PW and TSKgel G6000PW, were required to achieve good resolution with wide MW-range samples. The substitution of a TSK-GEL GMPW series column can save both time and money, compared with multi-column systems.
Elution volume (mL) Column: Sample: Elution: Flow Rate: Detection:
TSKgel G-DNA-PW, four 10μm, 7.8 mm ID x 30 cm L columns in series
Eco RI and Bst NI-cleaved pBR322 DNA, void volume determined with λ-DNA
0.3 M NaCl in 0.1 M Tris-HCl, pH 7.5, plus 1 mM EDTA 0.15 mL/min UV @ 260 nm 28 24 32 36 20 10 100 400 1000 2000 4000 8000 Base Pairs a 60 50 70 80 b c d e f Minutes Minutes Column: Sample: Elution: Flow Rate: Detection:
TSKgel G-DNA-PW, four 10 μm, 7.8 mm ID x 30 cm L columns in series
60μL of Eco RI and Bst NI - cleaved pBR322 DNA, base pairs: a. 4362, b. 1857, c. 1060 & 928, d. 383, e. 121, f. 13
0.3 M NaCl in 0.1 M Tris-HCl, pH 7.5, plus 1mM EDTA A. 0.15 mL/min, B. 0.5 mL/min UV @ 260 nm A. 0.15 mL/min B. 0.5 mL/min 210 180 240 270 150 a b c d e f Figure 25 Figure 26
Applications
Nucleic acids
Desalting of nucleosides can be accomplished using the TSKgel G2500PWXLas depicted in Figure 27. In this case secondary interaction effects induce adenosine and uridine to elute after the void volume in the unbuffered water mobile phase.
Polysaccharides
TSK-GEL PW columns are recommended for polysaccharide analysis, due to their ability to separate a wide molecular weight distribution. Nonionic polysaccharides are the least complicated molecules to analyze by size exclusion chromatography because they seldom exhibit secondary interactions with solid support. Two TSK-GEL PW columns (TSKgel G5000PW and TSKgel G3000PW) in series are effective for the characterization of clinical dextran. Cationic samples can be adsorbed on the resin by electrostatic interaction. If the polymer is strongly cationic, a fairly high salt concentration is required to prevent ionic interactions. Figure 28 demonstrates the effect of increasing sodium nitrate concentration on peak shapes for a cationic polymer, DEAE-dextran. A mobile phase of 0.5 M acetic acid with 0.3 M Na2SO4can also be used. An effective separation of the anionic hydrophilic gluco-saminoglycan, hyaluronic acid, is shown in Figure 29on a TSKgel G6000PW and TSKgel G4000PW column in series with 0.2 M sodium chloride. 30 45 Minutes Column: Sample: Elution: Flow Rate: Temperature: TSKgel G6000PW + G4000PW, two 7.5 mm ID x 60 cm L columns in series hyaluronic acid 0.2 M NaCl 0.9 mL/min 40˚C 15 0 1 2 3 1. Hyaluronic acid 2. Hyaluronic acid 3. Polyethylene oxide SE30 RI
LS
Column: TSKgel G2500PWXL, 7.8 mm ID x 30 cm L
Sample: A. 0.5 NaCl; B. uridine; C. adenosine Eluent: distilled water
Flow Rate: 1.0 mL/min Detection: UV @ 260 nm 0 10 20 Minutes 30 A B C 0.4 M NaNO3 80 60 Minutes 0.8 M NaNO3 Column: Sample: Elution: Flow Rate: Detection:
TSKgel GMPW, two 17μ m, 7.5 mm ID x 60 cm L columns in series 0.5 mL of 0.05-0.1% of the DEAE-dextran cationic polymer 0.1 M, 0.2 M, 0.4 M or 0.8 M NaNO3 in water 0.5 mL/min RI 0.1 M NaNO3 0.2 M NaNO3 Figure 27 Figure 28 Figure 29
Oligomers
The TSKgel G-Oligo-PW column is designed for high resolution separations of nonionic and cationic oligomers. Figure 30 demonstrates excellent resolution of chito-oligosaccharides obtained by using the smaller, 6 μm particle size packing in TSKgel G-Oligo-PW columns as compared with the resolution obtained with a TSKgel G2000PW column. The pore sizes in both TSKgel G-Oligo-PW and TSKgel G2000PW columns are about 125 Å and both resins bear approximately 0.2 μeq/mL of cationic groups. Because of the presence of cationic groups, neither column is
recommended for separating anionic materials. However, for nonionic oligomers, TSKgel G-Oligo-PW columns provide higher resolution than TSKgel G2500PWXLcolumns. The calibration curve for hydrolyzed β-cyclodextrin on two TSKgel G-Oligo-PW columns in series is shown in Figure 31.
Polymers
Sodium polyacrylate, an anionic polymer, is effectively separated on two TSKgel GMPW columns in Figure 32.The addition of 0.01 M NaNO3results in normal elution and peak shape overcoming the ionic repulsion between the anionic sample and the resin. Polyethyleneimine, a cationic polymer, is separated in Figure 33on two TSKgel GMPWXLcolumns with a 0.5 M acetic acid and 0.5 M sodium acetate as mobile phase.
Elution volume (mL) Column: Sample: Elution: Flow Rate: Detection:
TSKgel G-Oligo-PW, two 6μ m, 7.8 mm ID x 30 cm L columns in series hydrolyzedβ-cyclodextrin distilled water 1.0 mL/min UV @ 260 nm 18 16 14 Molecular weight (Da) 200
400 1000 2000 600 800 40 30 15 20 Minutes Column: Sample: Elution: Flow Rate: Detection:
A. TSKgel G2000PW, two 10μm, 7.5 mm ID x 60 cm L columns in series
B. TSKgel G-Oligo-PW, two 6μ m, 7.8 mm ID x 30 cm L columns in series
1. chitohexaose, 2. chitopentaose, 3. chitotetraose, 4. chitotriose, 5. chitobiose.
distilled water 1.0 mL/min RI
A. TSKgel G2000PW B. TSKgel G-Oligo-PW
4 5 3 1 2 1 2 3 4 5 Minutes Figure 30 Figure 31
Optimizing GFC with TSK-GEL PW and PW
XL
Selecting mobile phase buffers
In an ideal SEC separation, the mechanism is pure sieving, with no chemical interaction between the column matrix and the sample molecules. In practice, however, a small number of weakly charged groups on the surface of all TSK-GEL PW type packings can cause changes in elution order from that of an ideal system. Fortunately, the eluent composition can vary greatly with TSK-GEL PW columns, to be compatible with a wide range of neutral, polar, anionic and cationic samples. Table IX lists appropriate eluents for GFC of all polymer types on TSK-GEL PW type columns.
For some nonionic, nonpolar polymers, such as polyethylene glycols, normal chromatograms can be obtained by using distilled water. More polar ionic polymers may exhibit abnormal peak shapes or minor peaks near the void volume when eluted with distilled water, due to ionic interactions between the sample and residual charged groups on the resin surface. To eliminate ionic interactions, a neutral salt such as sodium nitrate or sodium sulfate is added to the aqueous eluent. Generally, a salt concentration of 0.1 M to 0.5 M is sufficient to overcome undesirable ionic interactions.
Hydrophobic samples
TSK-GEL PW-type resins are more hydrophobic than
polysaccharide gels such as cross-linked dextran. The extent of hydrophobic interaction increases as the salt concentration of the eluent increases, but it can be reduced by the addition of an organic solvent modifier such as acetonitrile. Water-soluble organic solvents are frequently used as modifiers to suppress hydrophobic interactions between the sample and the resin surface.
Modifiers are also used for optimizing the elution of both charged and neutral hydrophobic polymers. Typical examples for a variety of sample types are given in Table IX. All TSK-GEL PW-type column packings are compatible with 20% aqueous solutions of methanol, ethanol, propanol, acetonitrile, dimethyl formamide, dimethyl sulfoxide, formic acid, and acetic acid. In addition these columns can be run in 50% aqueous acetone.
80 40 Water Minutes Column: Sample: Elution: Flow Rate: Detection: TSKgel GMPW, two 17μ m, 7.5 mm ID x 60 cm L columns in series
0.5 mL of 0.05-0.1% of the sodium salt of polyacrylic acid, an anionic polymer
water, 0.01 M, 0.025 M, 0.05 M or 0.1 M NaNO3 in water 0.5 mL/min RI 0.01 M NaNO3 0.025 M NaNO3 0.05 M NaNO3 0.1 M NaNO3 60 100
Column: TSKgel GMPWXL, two 7.8 mm ID x 30 cm L in series Sample: polyethyleneimine
Eluent: 0.5 M acetic acid + 0.5 M sodium acetate Flow Rate: 1.0 mL/min
Detection: RI
0 10 20
Minutes
Recommended eluents for GFC of water-soluble polymers on TSK-GEL PW type columns
Type of polymer Typical sample Suitable eluent
Nonionic hydrophilic polyethylene glycol distilled water
soluble starch, methyl cellulose, pullulan 0.01 N NaOH
dextran, hydroxyethyl cellulose, 20% DMSO
polyvinyl alcohol, polyacrylamide Buffer or salt solution (e.g., 0.1– 0.5 M NaNO3)
Nonionic hydrophobic polyvinylpyrrolidone Buffer or salt solution with organic solvent
(e.g., 20% CH3CN in 0.1 M NaNO3)
Anionic hydrophilic sodium chondroitin sulfate, sodium alginate, Buffer or salt solution (e.g., 0.1 M NaNO3)
carboxymethyl cellulose, sodium polyacrylate, sodium hyaluronate
Anionic hydrophobic sulfonated lignin sodium salt, Buffer or salt solution with organic solvent
sodium polystyrenesulfonate (e.g., 20% CH3CN in 0.1 M NaNO3)
Cationic hydrophilic glycol chitosan, DEAE-dextran, poly(ethyleneimine), 0.5 M acetic acid with 0.3 M Na2SO4,
poly(trimethylaminoethyl methacrylate) iodide salt or 0.8 M NaNO3
Cationic hydrophobic poly(4-vinylbenzyltrimethylammonium chloride), 0.5 M acetic acid with 0.3 M Na2SO4
poly(N-methyl-2-vinylpyridinium) iodide salt
Amphoteric hydrophilic peptides, proteins, poly-and oligosaccharides, DNA, RNA Buffer or salt solution (e.g., 0.1 M NaNO3)
Amphoteric hydrophobic blue dextran, collagen, gelatin, hydrophobic proteins Buffer or salt solution with organic solvent
hydrophobic peptides (e.g., 20% CH3CN in 0.1 M NaNO3or
35–45% CH3CN in 0.1% TFA) Table IX
Ordering Information
Analytical and preparative TSK-GEL Size Exclusion polymer-based column products: typical properties
Part # Description ID Length Particle Min. Number Flow Rate (mL/min) Maximum (mm) (cm) Size (μm) Theoretical Range Max. Pressure
Plates Drop (kg/cm2)
Stainless steel columns
08031 G-Oligo-PW, 125 Å 7.8 30 6 14,000 0.5 – 0.8 1.0 40 08032 G-DNA-PW, >1.000 Å 7.8 30 10 10,000 0.2 – 0.5 0.6 20 08020 G2500PWXL, <200 Å 7.8 30 6 14,000 0.5 – 0.8 1.0 40 08021 G3000PWXL, 200 Å 7.8 30 6 14,000 0.5 – 0.8 1.0 40 08022 G4000PWXL, 500 Å 7.8 30 10 10,000 0.3 – 0.8 1.0 20 08023 G5000PWXL, 1.000 Å 7.8 30 10 10,000 0.3 – 0.8 1.0 20 08024 G6000PWXL, >1.000 Å 7.8 30 13 7,000 0.3 – 0.8 1.0 20 08025 GMPWXL, 100-1.000 Å 7.8 30 13 7,000 0.3 – 0.8 1.0 20 05760 G1000PW, <100 Å 7.5 30 10 5,000 0.5 – 1.0 1.2 20 05761 G2000PW, 125 Å 7.5 30 10 5,000 0.5 – 1.0 1.2 20 08028 G2500PW, <200 Å 7.5 30 10 5,000 0.5 – 1.0 1.2 20 05762 G3000PW, 200 Å 7.5 30 10 5,000 0.5 – 1.0 1.2 20 05763 G4000PW, 500 Å 7.5 30 17 3,000 0.5 – 1.0 1.2 10 05764 G5000PW, 1.000 Å 7.5 30 17 3,000 0.5 – 1.0 1.2 10 05765 G6000PW, >1.000 Å 7.5 30 17 3,000 0.5 – 1.0 1.2 10 08026 GMPW, 100-1.000 Å 7.5 30 17 3,000 0.5 – 1.0 1.2 10 05105 G2000PW, 125 Å 7.5 60 10 10,000 0.5 – 1.0 1.2 40 08029 G2500PW, <200 Å 7.5 60 10 10,000 0.5 – 1.0 1.2 40 05106 G3000PW, 200 Å 7.5 60 10 10,000 0.5 – 1.0 1.2 40 05107 G4000PW, 500 Å 7.5 60 17 6,000 0.5 – 1.0 1.2 20 05108 G5000PW, 1.000 Å 7.5 60 17 6,000 0.5 – 1.0 1.2 20 05109 G6000PW, >1.000 Å 7.5 60 17 6,000 0.5 – 1.0 1.2 20 08027 GMPW, 100-1.000 Å 7.5 60 17 6,000 0.5 – 1.0 1.2 20 05150 G2000PW, 125 Å 21.5 60 17 10,000 1.0 – 6.0 8.0 20 08030 G2500PW, <200 Å 21.5 60 17 10,000 1.0 – 6.0 8.0 20 05151 G3000PW, 200 Å 21.5 60 17 10,000 1.0 – 6.0 8.0 20 05152 G4000PW, 500 Å 21.5 60 22 6,000 1.0 – 6.0 8.0 20 05153 G5000PW, 1.000 Å 21.5 60 22 6,000 1.0 – 6.0 8.0 20 05154 G6000PW, >1.000 Å 21.5 60 25 6,000 1.0 – 6.0 8.0 20 07926 G3000PW, 200 Å 55.0 60 20 4,500 15.0 – 25.0 30.0 15 07927 G5000PW , 1.000 Å 55.0 60 20 4,500 15.0 – 25.0 30.0 15 Guard columns
08034 Oligo Guard column 6.0 4.0 12.0 For G-Oligo-PW
08033 PWXLGuard column 6.0 4.0 12.0 For 7.8 mm ID PWXLand G-DNA-PW
(contains 3000PW packing)
06763 PW-L Guard column 7.5 7.5 12.0 For 7.5 mm ID G1000PW and G2000PW
(contains 2000PW packing)
06762 PW-H Guard column 7.5 7.5 12.0 For 7.5 mm ID G2500PW - G6000PW + GMPW
(contains 3000PW packing)
06757 PW-L Guard column 21.5 7.5 17.0 For 21.5 mm ID G2000PW
06758 PW-H Guard column 21.5 7.5 17.0 For 21.5 mm ID G2500PW through G6000PW
07924 PW Guard column 45.0 5.0 20.0 For 55 mm ID G3000PW + G5000PW
Bulk packing
35,000 30,000 25,000 20,000 15,000 10,000 5,000 0
Theoretical Plates (TP/Column)
H2O Methanol/H 2 O Methanol Ethanol THF DMF HFIP DMSO 2-Propanol DMSO/H 2 O Acetonitrile THF/H 2 O Solvents TSKgel Alpha-3000 TSKgel G3000PWXL
Conditions of solvent change Flow Rate:
Temperature: Time for purge:
1.0 mL/min 25°C 8h
Conditions for TP measurement Sample: Flow Rate: Temperature: Detection: ethylene glycol 1.0 mL/min 25°C RI
Polymer based TSK-GEL Alpha and SuperAW columns for Gel Filtration and
Gel Permeation Chromatography of water soluble and organic soluble polymers
Figure 34
Highlights
• A unique hydrophilic, polyvinyl resin.
• Exhibits strong mechanical stability and minimal swelling characteristics.
• A wide range of solvent compatibility, from 100% water to 100% non-polar organic solvents (Figure 34 and Figure 35).
• The reduced particle size and shorter column length of TSK-GEL SuperAW columns provides equivalent resolution in1⁄
2the time for high throughput applications.
• Unlike polystyrene-divinylbenzene (PS-DVB) resins that may adsorb polymers due to hydrophobic interaction, both the TSK-GEL Alpha and SuperAW columns allow for the separation of polymers soluble in methanol.
• Provide accurate molecular weight (MW) determination of samples in dimethyl formamide and exhibit normal retention of polystyrene polymers.
• System peaks from salts in the eluent elute away from the oligomer of interest (Figure 36), providing accurate MW determinations.
Column: TSK-GEL SuperAW Series (6.0 mm ID x 15 cm L) Eluent: Water
Flow rate: 0.6 mL/min Temperature: 25°C
Detection: Refractive index detector Sample: Ethylene glycol Inj. volume: 5 μL (2.5 g/L) 0 5000 10000 15000 20000 25000 TP HFIP THF DMSO DMF MeOH MeOH/H 2 O=1/1 Original (H 2 O) CH3 CN CH3 CN/H 2O=1/1 SuperAW2500 SuperAW3000 SuperAW4000 SuperAW5000 SuperAW6000 SuperAWM-H Figure 35