Disposition Effect: Evidence from the Karachi Stock Exchange
Mubeen Ashraf, Fahim Waris, Sania SaeedMohammad Ali Jinnah University, Islamabad Pakistan
[email protected]; [email protected] ; [email protected] Abstract
The aim of this paper is to empirically investigate holding periods, illiquidity and disposition effect in Karachi Stock Exchange (KSE). KSE 100 Index daily data were collected for a period of five year i.e. 2008-2012. Daily returns, holding periods, illiquidity and volatility were calculated through this data. The results have revealed that Holding periods were found positively related to illiquidity and stock returns.
Keywords: Disposition effect, illiquidity, holding periods, Anomaly, KSE Introduction
Cut your losses and let your profits run! That is one of the most frequent pieces of advice given in stock market trading guides. Many investors seem to have difficulty following this advice. Instead, they tend to quickly sell stocks that have appreciated in price since purchase and hold on to losing stocks. Financial economists use the term disposition effect for this tendency. The disposition effect is the observation that investors tend to sell winning Stocks and hold losing stocks. It is one of the most robust behavioral regularities documented in studies of trading behavior. The prospect theory (Kahneman and Tversky, 1979) explains disposition effect. An investor with preferences given by prospect theory would become more risk-averse after experiencing gains and more risk-seeking after experiencing losses. This means that holding on to the investment becomes more attractive than selling if the value of the investment goes down because the investor is willing to tolerate more risk. This study examined the disposition effect on the KSE Index by using two stage least square and aims to provide further insights into the linkages between holding period of stock and illiquidity. The study is significant in the sense as there is less work done on disposition effect in our country. The findings can be used by practitioners to make trade decisions at right. More is that Understanding the disposition effect is useful in understanding market behavior. This can provide valuable information for financial advisers educating clients and for asset managers developing trading strategies. A full understanding of the underlying causes of the disposition effect is currently lacking, but investor psychology appears to play an important part.
Theory of disposition effect
The main theoretical basis of the disposition effect is the prospect theory developed by Kahneman and Tversky .In prospect theory, the value function is concave in the area of gains and convex in the area of loss. With a view different from that of traditional expected utility theory, prospect theory posits that most of the investors are loss averse. In other words, investors are risk seekers when facing a loss (and thus will try to hold losing investments) and risk avoiders when facing a gain (and thus will tend to realize winning investments). Shefrin and Statman (1985) compose a theoretical framework with four ingredients that underlie the disposition effect. The first ingredient is prospect theory (Kahneman and Tversky, 1979).
The second ingredient is mental accounting, a concept developed by Thaler (1980, 1985) and Tversky and Kahneman (1981). It describes people's tendency to organize some sources and uses of money in different psychological accounts in their mind. However, as people tend to consider these mental accounts separately, they may occasionally lose sight of what is best for their overall financial well-being. Shefrin and Statman (1985) argue that when investors buy a stock, they create a new mental account for that stock. Investors would then consider the value of each stock separately and compare it to the purchase price.
The third ingredient that Shefrin and Statman (1985) propose is regret aversion. Closing a stock position at a loss and thus having to admit a mistake may cause regret over the initial decision to buy the stock. The fourth ingredient is self-control. Self-control explains why the disposition effect is weaker at the end of the year. Investors may find getting rid of loss-making stocks easier when faced with explicit self-control mechanisms, such as the end of the tax year.
Literature review
According to Fama (1970), Efficient market hypothesis (EMH), efficient financial market as one in which prices are informationally efficient instantly reflect all relevant information. But behavioral finance argues that Capital markets in developing countries generally suffer from asymmetry in information. This difference in access to information, or ability to understand all the available information, also leads to disposition effect. The disposition effect is the tendency of investors to realize gains and reluctance to sell those that have losses due to regret avoidance which is derived from the prospect theory by Kahneman and Tversky (1979). This phenomenon
is also called loss aversion. Shefrin and Statman (1985) proposed that the disposition effect is a combination of mental accounting and S-shaped utility function in the domain of gains and losses, and it would lead investors to sell winning stocks too early and hold losing stocks too long. In recent years, the disposition effect has been documented in a number of studies either this exists or not and at what intensity in different markets and in different scenarios. Investors sell fewer shares when the price falls than when it rises. They also sell less when the price is below the purchase price than when it is above Martin and Colin (1998)
Odean (1998) says that Individual investor demonstrate significance preference for selling winners and hold losers .Costa Jr et.al (2006) studied Disposition effect on gender and found that girls shows less disposition effect as do not keep losing stocks and sell them early than winning stocks. Duque.L.R (2006) determined that, in bull markets, the disposition effect is stronger than in bear markets. Wen.H (2011) tested that disposition effect significantly exhibit in appreciation period, but not in depreciation period no matter during the global financial crisis or the Asian financial crisis. Silvaa.S.D (2013) found that the disposition effect is reduced as the years of experience grow.
Richards D et al (2011) examined that Demography of investor also contributes in disposition effect. Choi.D (2013) says that the effect of decreased price impact per sale and the effect of additional uninformed sales go in opposite directions. Their study concluded that if informed trading is more prevalent, good news travels quickly and bad news travels slowly if the disposition effect is strong. If informed trading is less prevalent vice versa. Han (2006) studied disposition effect and the stability of stock price of SSE (shanghai stock exchange) and found presence of disposition effect among Chinese investors on SSE and disposition effect can contribute stock price stability. Shumway & Wu (2006) pointed out that Investors that exhibit the disposition effect bias most strongly in one period have inferior investment performance in subsequent periods. They also trade less frequently and in smaller sizes and Institution investors exhibit less disposition effect than individual investors. David K. et.al (2004) that analysts display asymmetric behavior towards positive and negative earnings growth. Analysts forecast are found to be accurate during periods of positive earnings growth, but overly optimistic during periods of negative earnings growth.
Mark & Shannon (2009) argue that existing explanations for the stock-market investor’s disposition to “ride losers too long” are unsatisfactory because they abstract from any role for information processing. They propose instead that the disposition effect is a special case of “waning vigilance:” investors pay less attention to new information and analysis when making decisions about loss makers and are therefore slower to sell them when arguments in favor of holding cease to be valid. Jordan & Diltz (2010) tested Disposition Effect on Day Traders and found Day traders hold losing trades longer than profitable. Hung & Yuan (2007) studied higher cognitive reference price level, greater magnitude of irrational belief in mean reversion and less risk aversion attitude all strengthen the disposition effect they found that The grater disposition effect reduces the capital mobility from the stock market to the bond market and thus mitigates the dropping of the market interest rate.
Data and Methodology
KSE 100 index daily data obtained from KSE database for the period of January 2008 to December 2012. The rationale behind choosing KSE 100 index that it’s the benchmark for the rest of the industry.
Description of variables
Our dependent variable is Disposition effect which measure by computing average holding period of index. Average holding period of index for each year is computed by dividing the number of outstanding shares in KSE by the KSE annual trading volume
HP i,t = (Shares Outstanding i,t,d/VOLDbi,t,d)/N a. shares outstanding on day d of year t
b. respective daily volume for year t in terms of Pak rupee c. total number of trading days during year t
Our independent variable is illiquidity that calculated by using formula: ILLIQi,t = (׀Ri,t,d ׀/ VOLDi,t,d)/N
a. return on stock on day d of year t
b. respective daily volume in terms of Pak rupee in year t c. total number of trading days for during years
Control Variables
ILLIQi,t = βo + β1IILLIQai,t-1 + β2MVbi,t + β3Volatilityci,t + edi,t Eq.(1) a. is an estimate of the average percentage ILLIQ during year t-1
b. the average market capitalization during year t c. is the volatility of daily returns during year t d. error term.
The following regression employed to examine the relationship between investors’ holding periods and the illiquidity.
HPai,t = βo + β1IILLIQbi,t + β2MVci,t + β3Volatilitydi,t + ei,t Eq.(2) a. the average length of time that investors hold the stock during year t b. predicted value from the first-stage regression of equation 1 c. average market capitalization during year t
d. the variance of the daily stock returns e. error term
The two stage least square estimation results of equation -1 are reported in tables 1 and 2, which are discussed in depth in results and discussion section.
Results and Discussion
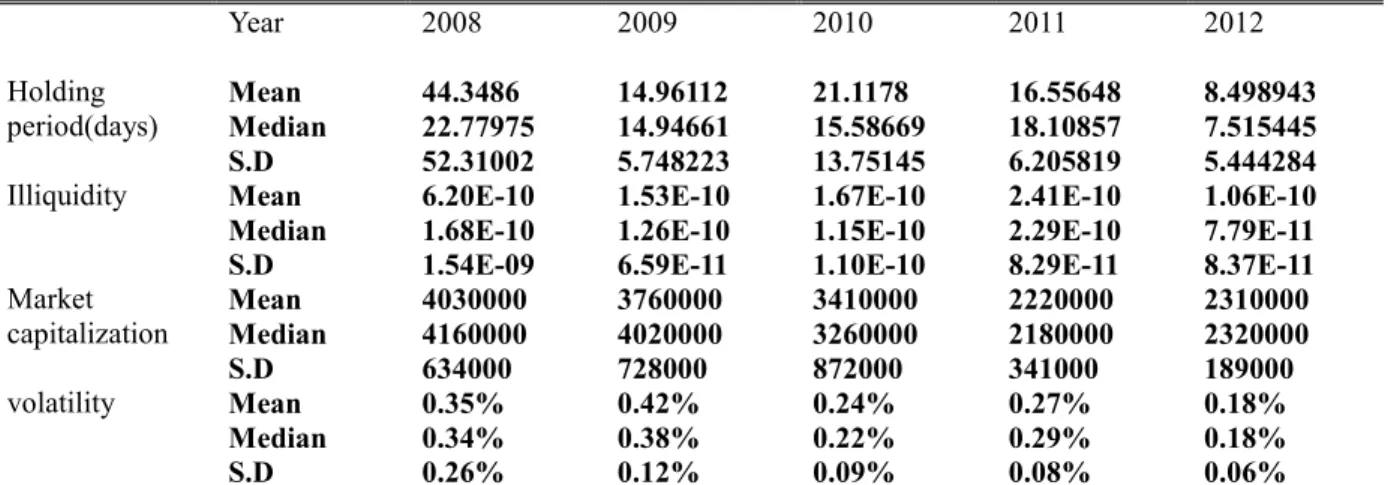
Descriptive Statistics of KSE indexare given in table-1. Holding period, illiquidity, market capitalization and volatility from 2008 to 2012 are shown with their respective mean, median and standard deviation. A huge difference between the mean and median of holding period, illiquidity and market capitalization shows that distribution of holding period, illiquidity and market capitalization for the KSE-100index was skewed. Median values were more indicative of holding period and illiquidity as they remained consistent over time. There was huge inconsistency within the mean and median of market capitalization over the period with increasing trend. The longest average holding period was 44.3486 days in 2008 and longest median period was 22.77975 days in 2008. The shortest average holding period was 8.498943 days in 2012 and shortest median holding period was 7.515445 days in 2012.
Table -1. Descriptive statistics:
Holding period(days) Year 2008 2009 2010 2011 2012 Mean 44.3486 14.96112 21.1178 16.55648 8.498943 Median 22.77975 14.94661 15.58669 18.10857 7.515445 S.D 52.31002 5.748223 13.75145 6.205819 5.444284
Illiquidity Mean 6.20E-10 1.53E-10 1.67E-10 2.41E-10 1.06E-10
Median 1.68E-10 1.26E-10 1.15E-10 2.29E-10 7.79E-11
S.D 1.54E-09 6.59E-11 1.10E-10 8.29E-11 8.37E-11
Market capitalization Mean 4030000 3760000 3410000 2220000 2310000 Median 4160000 4020000 3260000 2180000 2320000 S.D 634000 728000 872000 341000 189000 volatility Mean 0.35% 0.42% 0.24% 0.27% 0.18% Median 0.34% 0.38% 0.22% 0.29% 0.18% S.D 0.26% 0.12% 0.09% 0.08% 0.06%
The average market capitalization of KSE-100 index decreased from 4030000 million Pak Rupee to 2310000 million Pak Rupee from 2008 to 2012.The median market capitalization decreased from 4.16E+12 million Pak Rupee to 2.32E+12 million Pak Rupee from 2008 to 2012. The variance of return shows overall downward trend over the sample period between 2008and 2012.
Annual Holding Period Regression
Table -2A shows the annual estimated results of equation- 2 calculated for KSE-100 index. Table- 2B shows the estimated results of equation -2 calculated for the entire sample period (2008-2012) for the KSE-100 index. A two stage least square method was applied for the sample period. The coefficients on illiquidity are positive and significant over the whole period. These results are in line with literature. The regression coefficients for market capitalization were positive over the sample period except 2012. The regression coefficient of variance was negative all over the sample period. The R2 ranged from 0.760014 to 0.921479. The results showed that more the illiquidity, the longer the holding periods are.
Table- 2A. Annual holding period regression
Year 2008 2009 2010 2011 2012
coefficient Prob coefficient prob coefficient prob coefficient prob coefficient prob
constant -198.4089 0.0583 -3.548853 0.614 -3.23277 0.5536 -19.03896 0.0065 9.151808 0.1889
Illliquidiy 6.49E+10 0.007 1.29E+11 0.006 1.47E+11 0.0127 7.37E+10 0.0066 7.80E+10 0.0164
Firm Size 6.91E-11 0.0234 5.22E-12 0.006 5.85E-12 0.0054 1.17E-11 0.0002 -1.55E-12 0.5645
voltality -21584.28 0.0006 -5030.814 0.001 -8269.135 0 -3006.463 0 -2947.056 0
Adjusted R-squared
0.760014 0.670672 0.904439 0.890729 0.921479
F-statistic 15.10136 10.75878 37.86694 32.79836 46.41108
The coefficients on illiquidity are positive that shows that holding periods are related with the transaction costs. This means that because of transaction cost investors hold losing stocks long and sell winning stocks soon. Simply we can say when illiquidity increase and less trade in the market people start holding stocks long to avoid transaction cost.
Table- 2B. Holding period regression over the sample period
coefficient Prob
Constant -4.424828 0.5308
Illiquidity -8536.537 0
Firm Size 1.20E-11 0
Voltality 4.93E+10 0
Adjusted R-squared 0.670691
F-statistic 59.52799
Table 2A and 2B present the relation between holding periods, market capitalization, illiquidity and volatility for the Karachi Stock Exchange for the period 2008–20012. The results are from the following two-stage least squares regression:
HPi,t = βo + β1IILLIQi,t + β2MVi,t + β3Volatilityi,t + ei,t. Regret Avoiding and Pride Seeking:
To measure the disposition effect in Karachi Stock Exchange following equation was used. This equation has been prior used by Visaltanachoti et. al. (2007).
HPai,t = βo + β1Rbi,t + β2IILLIQci,t + β3MVdi,t + β4Volatilitye + efi,t Eq. (3) a. the average length of time that investors hold the stock during year t
b. annual return on stock
c. predicted value from the first-stage regression
d. average market capitalization of firm shares during year t e. the variance of the firm’s daily stock returns
f. error term.
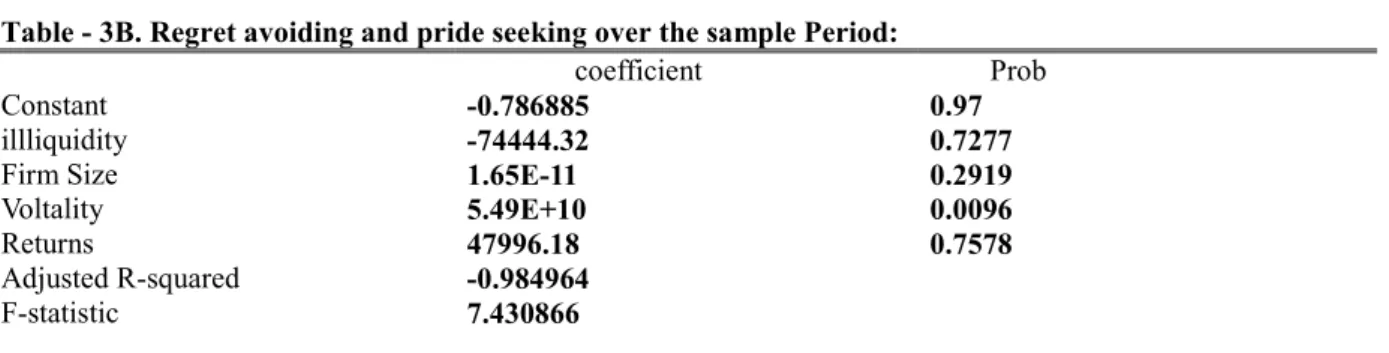
Table 3-A shows the results of estimation of equation 3 by applying two stage least square methodsfor KSE-100 index. Table 3-B shows the results of equation 3 over the whole period of sample from 2008 to 20012. The regression coefficients of returns are positive and insignificant each year except 2009 and 2012. This result concludes that because of regret avoidance disposition effect not exist in KSE.
Table - 3A. Regret avoiding and pride seeking:
Year 2008 2009 2010 2011 2012
Coefficient Prob coefficient prob coefficient prob coefficient prob coefficient prob
constant -724.0212 0.9469 -3.153797 0.6689 1.265406 0.833 -143.0688 0.8776 3.88637 0.5745
illliquidity -592625.1 0.9597 -171.1961 0.9736 2151.88 0.794 -41562.36 0.8854 -572.5967 0.7949
Firm Size 2.41E-10 0.9458 3.98E-12 0.0769 6.92E-12 0.007 4.77E-11 0.8596 6.86E-13 0.8091
Voltality 1.09E+11 0.9062 1.39E+11 0.0017 1.51E+11 0 1.24E+11 0.7492 7.93E+10 0
Return 425270.4 0.9611 -3086.4 0.3435 -11888.21 0.217 44364.07 0.8935 -1924.272 0.27
Adjusted R-squared
-49.064666 0.641015 0.921632 -11.892906 0.953123
Table - 3B. Regret avoiding and pride seeking over the sample Period:
coefficient Prob
Constant -0.786885 0.97
illliquidity -74444.32 0.7277
Firm Size 1.65E-11 0.2919
Voltality 5.49E+10 0.0096
Returns 47996.18 0.7578
Adjusted R-squared -0.984964
F-statistic 7.430866
Table 3A and 3B present the relation between holding periods, market capitalization, illiquidity and volatility for Karachi Stock Exchange for the period 2008-2012. The results are from the following two-stage least squares regression:
HPi,t = βo + β1Reti,t + β2IILLIQi,t + β3MVi,t + β4Volatility + ei,t Conclusion
This study investigated the disposition effect, holding periods and illiquidity in Karachi stock exchange for the period of 2008 to 2012. The results show that holding periods is positively associated with illiquidity and returns. In KSE index Disposition effect is evident because of transaction cost over the sample period. and in context of regret avoidance disposition effect not exist in KSE index .In current study because of market illiquidity people to avoid transaction cost start holding securities this shows disposition effect. This study suffers from a limitation in sense that it uses a short sample period Future research should be conducted on large sampling period.
References
1. Kahneman, D., & Tversky, A. (1979). Prospect theory: An analysis of decision under risk. Econometrica: Journal of the Econometric Society, 263-291.
2. Shefrin, H., & Statman, M. (1985). The disposition to sell winners too early and ride losers too long: Theory and evidence. The Journal of finance, 40(3), 777-790.
3. Weber, M., & Camerer, C. F. (1998). The disposition effect in securities trading: An experimental analysis.
Journal of Economic Behavior & Organization, 33(2), 167-184.
4. Odean, T. (1998). Are investors reluctant to realize their losses?. The Journal of finance, 53(5), 1775-1798. 5. Da Costa Jr, N., Mineto, C., & Da Silva, S. (2008). Disposition effect and gender. Applied Economics
Letters, 15(6), 411-416.
6. Lin, H. W. Does the Disposition Effect Exhibit during Financial Crisis?.
7. Da Costa, N., Goulart, M., Cupertino, C., Macedo, J., & Da Silva, S. (2013). The disposition effect and investor experience. Journal of Banking and Finance, 37(5), 1669-1675.
8. Dacey, R., & Zielonka, P. (2008). A detailed prospect theory explanation of the disposition effect. The Journal of Behavioral Finance, 9(1), 43-50.
9. Talpsepp, T. (2011). Reverse disposition effect of foreign investors. Journal of Behavioral Finance, 12(4), 183-200.
10. Talpsepp, T. (2013). Does Gender and Age Affect Investor Performance and the Disposition Effect?.
Research in Economics and Business: Central and Eastern Europe, 2(1).
11. Vollan, M. M. (2010). The Disposition Effect, a Behavioral Bias in the Financial Market.: A Survey of the Disposition effect.
12. Čekauskas, K., & Liatukas, V. (2011). BEHAVIOURAL BIASES OF THE DISPOSITION EFFECT. 13. Shumway, T., & Wu, G. (2005, March). Does disposition drive momentum. In AFA 2006 Boston Meetings
Paper.
14. Shefrin, H. (2007). How the disposition effect and momentum impact investment professionals. Journal of Investment Consulting, 8(2), 68-79.
15. Weber, M., & Welfens, F. (2007). An individual level analysis of the disposition effect: Empirical and experimental evidence. Univ., Sonderforschungsbereich 504.
16. Barberis, N., & Xiong, W. (2009). What Drives the Disposition Effect? An Analysis of a Long‐Standing Preference‐Based Explanation. the Journal of Finance, 64(2), 751-784.
17. Muermann, A., & Volkman, J. M. (2007). Regret, pride, and the disposition effect. Working Paper, University of Pennsylvania.
18. Hens, T., & Bachmann, K. (2011). Behavioural finance for private banking (Vol. 534). Wiley. com.
19. Richards, D., Rutterford, J., & Fenton-O’Creevy, M. (2011). Do stop losses work? The disposition effect, stop losses and investor demographics. Working Paper.
Stock Market. Journal of Economics and Development, 14(2), 52.
21. Ng, L., & Wu, F. (2007). The trading behavior of institutions and individuals in Chinese equity markets.
Journal of Banking & Finance, 31(9), 2695-2710.
22. Aftab, M., Ali Shah, Z., & Sheikh, R. A. (2012). Holding Periods, Illiquidity and Disposition Effect in a Developing Economy. Business and Economics Research Journal, 3(1).
23. Locke, P. R., & Mann, S. C. (2005). Professional trader discipline and trade disposition. Journal of Financial Economics, 76(2), 401-444.
24. Li, Y., & Yang, L. (2012). Prospect theory, the disposition effect, and asset prices. Journal of Financial Economics.
25. Ding, D. K., Charoenwong, C., & Seetoh, R. (2004). Prospect theory, analyst forecasts, and stock returns.
Journal of Multinational Financial Management, 14(4), 425-442. 26. Pasquariello, P. (2013). Prospect Theory and Market Quality.
27. Levy, H., & Wiener, Z. (2013). Prospect theory and utility theory: temporary versus permanent attitude towards risk. Journal of Economics and Business.
28. Singal, V., & Xu, Z. (2011). Selling winners, holding losers: Effect on fund flows and survival of disposition-prone mutual funds. Journal of Banking & Finance, 35(10), 2704-2718.
29. Bhootra, A., & Hur, J. (2012). On the relationship between concentration of prospect theory/mental accounting investors, cointegration, and momentum. Journal of Banking & Finance, 36(5), 1266-1275. 30. Yao, J., & Lib, D. (2013). Prospect theory and trading patterns. Journal of Banking & Finance.
31. Yao, J., & Li, D. (2012). Bounded rationality as a source of loss aversion and optimism: A study of psychological adaptation under incomplete information. Journal of Economic Dynamics and Control. 32. Oehler, A., Heilmann, K., Läger, V., & Oberländer, M. (2003). Coexistence of disposition investors and
momentum traders in stock markets: experimental evidence. Journal of International Financial Markets, Institutions and Money, 13(5), 503-524.
33. DeWeaver, M. A., & Shannon, R. (2010). Waning vigilance and the disposition effect: Evidence from Thailand on individual investor decision making. The Journal of Socio-Economics, 39(1), 18-23.
34. Ammann, M., Ising, A., & Kessler, S. (2011). Disposition Effect and Mutual Fund Performance. Available at SSRN 1858930.
35. Das, A. (2012). Estimating the Loss from the Disposition Effect: A Simulation Study. Journal of Behavioral Finance, 13(1), 1-10.
36. Roger, P. (2009). Does the consciousness of the disposition effect increase the equity premium?. The Journal of Behavioral Finance, 10(3), 138-151.
37. Chong, F. (2009). Disposition effect and flippers in the Bursa Malaysia. The Journal of Behavioral Finance,
10(3), 152-157.
38. Hung, M. W., & Yu, H. Y. (2006). A heterogeneous model of disposition effect. Applied Economics, 38(18), 2147-2157.
39. Chui, P. M. (2001). An experimental study of the disposition effect: Evidence from Macau. The Journal of Psychology and Financial Markets, 2(4), 216-222.
40. Jordan, D., & Diltz, J. D. (2004). Day traders and the disposition effect. The Journal of Behavioral Finance,