Oleksii Kuchaiev
2and Nataˇsa Prˇzulj
1∗1Department of Computing, Imperial College London; London, SW7 2AZ, UK
2Department of Computer Science, University of California, Irvine; Irvine, CA 92617, USA
ABSTRACT
Motivation: High-throughput methods for detecting molecular interactions have lead to a plethora of biological network data with much more yet to come, stimulating the development of techniques for biological network alignment. Analogous to sequence alignment, efficient and reliable network alignment methods will improve our understanding of biological systems. Network alignment is computationally hard. Hence, devising efficient network alignment heuristics is currently one of the foremost challenges in computational biology.
Results: We present a superior heuristic network alignment algorithm, called Matching-based GRAph ALigner (M-GRAAL), which
can process and integrate any number and type of similarity
measures between network nodes (e.g., proteins), including, but not limited to, any topological network similarity measure, sequence similarity, functional similarity, and structural similarity. This is efficient in resolving ties in similarity measures and in finding a combination of similarity measures yielding the largest biologically sound alignments. When used to align protein-protein interaction (PPI) networks of various species, M-GRAAL exposes the largest known functional and contiguous regions of network similarity. Hence, we use M-GRAAL’s alignments to predict functions of un-annotated proteins in yeast,
human, and bacteria C. jejuniand E. Coli. Furthermore, using
M-GRAAL to compare PPI networks of different herpes viruses, we reconstruct their phylogenetic relationship and our phylogenetic tree is the same as sequenced-based one.
Availability: Supplementary files and M-GRAAL executables are freely available for research use from:
http://www.ics.uci.edu/∼bio-nets/M-GRAAL
Contact:[email protected]
1 INTRODUCTION 1.1 Background
Many complex systems can be represented using networks. The most prominent examples are biological, social, informational, physical, and transportation networks. Huge amounts of biological network data of different types are increasingly becoming available. Examples include protein-protein interaction (PPI) networks, transcriptional regulation networks, signal transduction networks, and metabolic networks. PPI networks are of particular importance because proteins are crucial for almost all functions in the cell. Proteins almost never perform their functions alone, but they “cooperate” with other proteins by forming physical bonds and hence create huge networks of protein-protein interactions (PPIs). Understanding these complex networks is one of the foremost challenges of the post-genomic era.
∗To whom correspondence should be addressed
A PPI network is conveniently modeled as an undirected unweighted network (also called a graph), denoted byG(V, E), whereV is the set of proteins, ornodes, andEis the set of protein-protein interactions, or edges. For simplicity we do not consider self-loops. The interactions are usually obtained by high-throughput experimental bio-techniques, such as yeast-2-hybrid assays (Li et al., 2004; Rualet al., 2005; Simoniset al., 2009) and affinity purification coupled to mass spectrometry (Hoet al., 2002; Gavin et al., 2006; Kroganet al., 2006). The topology of PPI and other biological networks and its link to biological function is not random and has been the focus of many studies (Barabasi and Albert, 1999; Milo et al., 2002, 2004; Prˇzuljet al., 2004; Pinteret al., 2005; Suthramet al., 2005; Milenkovic and Prˇzulj, 2008).
Analogous to sequence alignment, network alignment can be vital for understanding the structure and function of complex biological networks.Network alignmentis the problem of finding the “best way” in which nodes in one network correspond to nodes in another (see Section 2.1 for formal definitions). Similar to sequence alignment, there existlocalandglobalnetwork alignment. Local network alignment algorithms aim to find small subnetworks corresponding to pathways, or protein complexes, conserved in PPI networks of different species. Such alignments can be ambiguous because the same node in one network can have different pairings in different local alignments. In contrast, a global network alignment provides a unique alignment from every node in the smaller network to exactly one node in the larger network, even though this may lead to inoptimal matchings in some local regions.
Several algorithms for local network alignment have been developed. One of the earliest examples is PathBLAST algorithm by Kelley et al.(2004). It searches for high-scoring alignments of pathways from two networks by taking into account both the probabilities that PPIs in a pathway are true PPIs rather than false-positives and the homology between the aligned proteins. A modification of PathBLAST, called NetworkBLAST-M (Sharan et al., 2005), was developed to perform identification of conserved protein complexes in multiple species. MaWISh (Maximum Weight Induced Subgraph) algorithm by Koyuturk et al.(2006) is based on the duplication/divergence models that focus on understanding the evolution of protein interactions. Using this model, it constructs a weighted global alignment graph and tries to find a maximum induced subgraph it it. Graemlin, by Flannick et al. (2006), scores a possibly conserved module between different networks by computing the log-ratio of the probability that the module is subject to evolutionary constraints and the probability that the module is under no constraints, while taking into account phylogenetic relationships between species whose networks are being aligned.
The first global network alignment algorithm, IsoRank, by Singh et al. (2007), is guided by the intuition that two nodes should be matched only if their neighbors can also be matched. This is formulated as an eigenvector problem, so spectral graph theory is
used to compute scores of topologically aligning pairs of nodes from different networks. Also, it includes BLAST scores (Altschulet al., 1990) for sequence similarity between nodes (proteins) into the node alignment by having a user-defined weightλthat controls for the relative contribution of topological similarity, whereas1−λcontrols for the contribution of sequence similarity. IsoRank constructs the node alignment based on these scores using a greedy strategy. Later, IsoRank was extended to perform multiple local and global alignments between networks (Singhet al., 2008; Liaoet al., 2009). Global network alignment algorithms based purely on network topology, called GRAAL (Kuchaievet al., 2010) and H-GRAAL (Milenkovicet al., 2010), have also been designed. They can align networks of any type, not only biological ones, since they do not rely on sequence similarity information between nodes. Instead, both algorithms heavily rely on “graphlet degrees,” which give a highly constraining quantification of the topological similarity between nodes (Milenkovic and Prˇzulj, 2008). GRAAL is a seed-and-extend approach, while H-GRAAL is based on the Hungarian algorithm (Kuhn, 1955) for solving the assignment problem.
1.2 Our contribution
We present a novel algorithm for global network alignment, called Matching-based GRAph ALigner (M-GRAAL), that outperforms all previous approaches. The unique feature of this algorithm is its ability to integrate and automatically process, without any user specified parameters, several different sources of node similarity information and use it to construct the alignment. M-GRAAL treats each information source as an independent “agent” that gives its confidence about aligning a particular pair of nodes. Then, M-GRAAL takes the “majority vote” of these “agents” to decide which nodes should be matched together (the details are given in the Section 2.2). Such an approach has many advantages. First, it is very flexible and can integrate different types of node similarity information, including various topological similarity measures between nodes (e.g., node degree, clustering coefficient), sequence and structural information, ontology information, and any other type of information we choose. Second, by integrating a large number of node similarity measures, this approach easily resolves ties in different similarity measures. For example, there may be many nodes with the same degree or clustering coefficient in the network and therefore, other node similarity measures need to be consulted to resolve these ties. Usually, if there are ties in node similarity, an algorithm break them randomly. This results in different alignments for different runs of the algorithm. To avoid this, M-GRAAL uses a large number of similarity measures on nodes in order to uniquely resolve as many ties as possible. When all ties are resolved, we say that we have astablealignment, an alignment that is the same in all runs of the algorithm. Finally, our approach does not require the user to adjust any weight parameters before running the algorithm. Instead, it allows the user to explore the effects of many different node similarity information sources and to determine those that give optimal alignments.
We test the biological relevance of M-GRAAL by using it to align PPI networks of baker’s yeast and human, as well as those of bacteria C. jejuni and E.Coli, and bacteria Mesorhizobium loti and Synechocystis sp. PCC6803. We demonstrate that our alignments have superior topological and biological quality over other approaches, as well as that they can successfully be used
for predicting function of unannotated proteins. Furthermore, we perform an all-to-all solely topological alignment of five different herpesviral PPI networks and use the network alignment similarity scores to exactly reconstruct the phylogenetic relationship between these species. Thus, we confirm our previous observation that network topology can be used as a new and independent source of phylogenetic information (Kuchaievet al., 2010; Milenkovicet al., 2010).
2 ALGORITHM
2.1 Global Network Alignment
Several different formulations of the global network alignment problem have been proposed (Flannicket al., 2008; Liaoet al., 2009; Zaslavskiyet al., 2009). Unfortunately, unlike with the sequence alignment, any reasonable formulation of this problem makes it computationally hard. The reason for this is the underlyingsubgraph isomorphismproblem: given two graphs, subgraph isomorphism asks if one graph exists as an exact subgraph of the other. This problem is NP-complete meaning that no efficient algorithm for it is likely to be found.
We define global alignment between two networks G1(V1, E1)and
G2(V2, E2), where|V1| ≤ |V2|, as a total injective functionf:V1→V2.
Hence, the alignment isglobalin the sense that each node in the smaller network is aligned to some node in the larger network. Also, no two nodes from the smaller network can be aligned to the same node in the larger network. To measure the topological quality of the alignmentf, we use the edge correctness (EC)measure (Kuchaievet al., 2010) :
EC=|{(u, v)∈E1∧(f(u), f(v))∈E2}|
|E1| ∗
100% (1)
This measure quantifies how topologically similar two networks are. Naturally, when aligning two networks, we want to achieve as highEC as possible, hence maximizing the number of aligned edges between two networks. Note thatEC is equal to100%if and only ifG2contains an
isomorphic copy ofG1 which implies the solution to the corresponding
subgraph isomorphism problem. Therefore, maximizing edge correctness is an NP-hard problem and heuristic approaches must be devised. M-GRAAL is one such heuristic.
2.2 M-GRAAL
M-GRAAL is a substantial improvement to GRAAL (Kuchaiev et al., 2010) and H-GRAAL (Milenkovicet al., 2010) algorithms, with the only conceptual similarity between GRAAL and M-GRAAL being that both of these algorithms are, analogous to BLAST, seed-and-extend approaches, while H-GRAAL is not a seed-and-extend approach at all. In this section, we describe the computational principles of M-GRAAL. In subsequent sections, we describe the biological results obtained by M-GRAAL and discuss its superiority over all other known global alignment methods.
M-GRAAL works as follows. During its first step, M-GRAAL builds the “confidence scores” matrix,C, of size|V1| × |V2|. The entryC(i, j)in this
matrix reflects the “confidence” with which the algorithm can align nodei fromG1 to nodejfromG2. The matrixCof confidence scores can be
built based onany number and typeof similarity (or equivalently, distance) measures between nodes (e.g., proteins in a PPI network), including, but not limited to, any topological network similarity measure, sequence similarity, functional similarity, and structural similarity. Since the number of similarity measures can be very large, as a proof of concept, we implement M-GRAAL to use the following four topological similarities between nodes in two networks (the definitions are given below), along with the fifth measure being the sequence similarity given by the BLAST (Altschulet al., 1990) E-valuescore between protein sequences:
1. Graphlet degree signature distance (SD) (Milenkovic and Prˇzulj, 2008) 2. Relative degree difference (DD)
3. Relative clustering coefficient difference (CD) 4. Relative eccentricity difference (ED)
5. BLASTE-valuefor protein sequence similarity (SeqD)
The reasons for which we chose these particular measures in our first proof of concept implementation of M-GRAAL are as follows. The graphlet degree signature distance has already been shown to work very well for aligning biological networks (Kuchaiev et al., 2010; Milenkovicet al., 2010). Degrees, clustering coefficients and eccentricities are some of the most common simpler topological measures of nodes in a network. BLAST E-values are a standard measure for deciding whether two proteins are orthologs. We emphasize again that M-GRAAL can easily be extended to use any other topological distance measure between nodes (e.g., proteins) in a network and any number of topological distances, not only the four chosen in the current implementation described above. Also, it can use any normalized protein distance information, such as sequence, structural, and ontology information, and any number of such distance measures as well, not just BLAST E-values chosen in the current implementation described above. Hence, M-GRAAL is very flexible in processing any type and number of information on the networks being aligned.
Thegraphlet degree signature distancebetween two nodes is a weighted distance between their graphlet degree vectors, or node signatures (Milenkovic and Prˇzulj, 2008). Agraphletis a small connected induced subgraph of a large network (Prˇzuljet al., 2004). Asignatureof a node is a 73-component vector which summarizes the number ofautomorphism orbitsof all2- to5-node graphlets that the node touches. This vector is a generalization of thedegreeof a node, which measures the number of edges that the node touches, into larger subgraphs instead of just an edge, such as triangles, 3-node linear paths, squares, pentagons etc. We count how many times a node touches a graphlet forallgraphlets on up to 5 nodes. The signature distance between nodesuandv,SD(u, v), is normalized to be a number between 0 and 1, where 0 means that the two nodes have identical signatures (Milenkovic and Prˇzulj, 2008). Therelative degree differencebetween nodesuandvin the network is simplyDD(u, v) =
|degree(u)−degree(v)|
max{degree(u),degree(v)}. Similarly, we define the relative clustering
coefficient and eccentricity differences between nodes u and v to be CD(u, v) = max|c({uc)(−u)c,c(v()v|)}andED(u, v) = max|eccen{eccen(u)(−ueccen),eccen(v()v|)}
respectively, wherec(u)is the clustering coefficient of nodeuandeccen(u)
is the eccentricity of u in the network. For completeness, we give the definitions of these simple network concepts as well. The clustering coefficient of nodeu is defined as c(u) = 2∗Eu
degree(u)∗(degree(u)−1),
where Euis a number of edges between neighbors of u; it is set to 0
if degree(u) ≤ 1(Newman, 2003). Theeccentricityof nodeu is the maximum shortest path distance from it to any other node in the connected component of the network that containsu(Newman, 2003).
We compute the four topological distance measures between all pairs of nodes from networksG1andG2and obtain fourV1×V2-sized matrices,
SD,DD,CDandED, of topological distances between their nodes. To compute confidence scores of aligning nodes fromG1 to nodes fromG2,
M-GRAAL treats each of these four topological cost matrices, as well as the sequence alignment cost matrix, SeqD(and others in other possible implementations of M-GRAAL), as independent “agents” that “tell” how confident they are about aligning nodei ∈ V1with nodej ∈ V2. Note
that the “perfect” alignment should minimize signature, degree, clustering, eccentricity and sequence differences between nodes. Hence, the confidence score between nodesiandj,C(i, j), is computed as follows:
C(i, j) =confSD(i, j) +confDD(i, j) +confCD(i, j)+
+confED(i, j) +confSeqD(i, j)
(2)
whereconfX(i, j)is a fraction of elements in theithrow of matrixX
which are strictly greater thenX(i, j); here, X stands for SD, DD, CC, ED, orSeqDmatrix. Hence, if for some pair of nodesiand j, X(i, j) is the smallest element in rowi of matrixX, that means that matrix X is 100% “confident” that nodeishould be aligned with node j. This definition of the confidence scores matrix,C, allows us to handle ties in the scores of one matrix, as well as contradictions between different matrices (e.g.,i,j may be the best pair to align according to degrees, but not according to sequences), without any a priori, user input parameter adjustments, simply by taking the “majority vote”. While building the matrix of confidence scores, M-GRAAL simultaneously constructs a priority queue of node pairs in decreasing order of their confidence scores. The priority queue is used to quickly identify seed node pairs when necessary (the details are below). It is possible that several seed node pairs can have the same confidence scores, in which case the ties are broken randomly. Algorithm 1 and Algorithm 2 present the pseudocode for M-GRAAL algorithm and its subroutinealign neighborhoods, respectively. Below, we define the specific concepts used in them.
Algorithm 1M-GRAAL(G1, G2)
Construct, or read in the cost matrices and build the matrix of confidence scores,C, as well as the priority queue of node pairs ordered by their confidence scores.
Initialize alignmentAto an empty set.
whilethere are unaligned nodes inG1do
Use the priority queue to find a seed pair of nodes,(u, v),u∈ G1, v∈G2, i.e., the pair of nodes that can be aligned with the highest confidence,C(u, v). Break ties randomly.
Add(u, v)to alignmentA.
for allk∈ {1, ...,min{eccen(u), eccen(v)}}do
Construct thekthneighborhood ofuinG1, NGk1(u), and
thekthneighborhood ofvinG2,NGk2(v). align neighborhoods(Nk G1(u), N k G2(v), C, A) end for
If there are still unaligned nodes inG1, raise both graphs to the next power (up to the 3rd power).
end while
return alignmentA.
GraphGraised to powerpis defined asGp = (V(G), Ep), where
Ep = {(u
1, u2) : distG(u1, u2) ≤ p}and thedistancebetweenu1
andu2,distG(u1, u2), is the length of the shortest path betweenu1and
u2inG. This allows us to model insertions and deletions of nodes in the
paths conserved between two networks. Similarly, thekthneighborhood of
nodeuin networkG1,NGk
1(u), is defined to be the set of nodes ofG1that are at distance≤kfromu. Hence,Nk
G1(u)can be thought of as the “ball” of nodes arounduup to and including nodes at distancek.
A bipartite graph, BP(V1, V2, E), is a graph with a node set V
consisting of two partitions, V = V1∪V2, so that every edge e ∈ E
connects a node fromV1with a node fromV2; that is, there are no edges
between nodes ofV1and there are no edges between nodes ofV2– all the
edges “go across” the node partition. Amatchingin a graphGis a set of edges such that no two edges from this set share a common endpoint. In a weighted bipartite graph, theMaximum Weight Bipartite Matching Problem is a problem of finding a matching of maximum weight. It can be solved in O(|V|2log(|V|) +|V||E|)time using a modified shortest path search in
the augmenting path algorithm (West, 2001).
Algorithm 2align neighborhoods(NGk1(u), N
k
G2(v), C, A)
1. Construct a bipartite graphBP(Nk G1(u), N
k
G2(v), E)with
node partitions beingNGk1(u)andN
k
G2(v)as follows: • Check the current alignmentAand add an edge(u′, v′)
toE,u′ ∈Nk G1(u), v
′∈Nk
G2(v), if and only if nodes u′andv′have aligned neighbors. Hence, aligning them will increaseECby at least 1.
• To each edge(n, m)inE, assign the weightC(n, m), the confidence with which we can alignnandm. 2. Solve theMaximum Weight Bipartite Matching Problemfor
bipartite graphBP constructed above.
3. Add the optimal matching found in Step 2 above to the current alignmentA.
2.3 Computational complexity of M-GRAAL
Let us assume that the cost matricesSD, DD, CD, ED, andSeqD are given. Constructing confidence matrixCand priority queue with seeds based on the information in these five matrices can be done inO(|V1| ∗
|V2| ∗log|V2|)time with the help of any O(n∗log(n))time sorting
procedure, whereV1andV2are node sets of the networks we are aligning.
Solving theMaximum Weight Bipartite Matchingproblem for bipartite graph BP(N1, N2, E)takesO(|N1+N2|∗(|E|+|N1+N2|∗log(|N1+N2|)))
time, and hence, the complexity ofalign neighborhoods(N1, N2, C, A)
is alsoO(|N1+N2| ∗(|E|+|N1+N2| ∗log(|N1+N2|))). Therefore,
the total time complexity of M-GRAAL algorithm for aligning networks G1(V1, E1)andG2(V2, E2)isO(|V1| ∗(E1 +|V1| ∗log(|V1|))and
the space complexity is clearlyO(|V1| × |V2|+|E1|+|E2|).
Computing signature similarities for nodes of networkG(V, E)has the worst case running time of O(|V|5); however, in practice, for sparse
networks such as biological ones, this is done very quickly (Prˇzulj, 2007). Also, the problem is embarrassingly parallel and thus can be easily distributed over a compute cluster. Computing any other topological scoring matrix discussed above requires no more thanO(|V| ∗ |E|)time. Note that for a graph with|V|nodes and|E|edges, the time complexity of O(|V|(|E|+|V|log|V|))is bounded above byO(|V|3), since the number
of edges in such a graph is at mostO(|V|2). In practice, however, all
PPI networks are sparse, meaning that|E| = O(|V|) and therefore, this time complexity isO(|V|2log|V|). For the networks of the size of
yeast and human (analyzed in Section 3.1) this results in a huge running time improvement. H-GRAAL algorithm (Milenkovicet al. (2010)) has a running time ofΘ(|V|3)and it takes about 2 days to align yeast and
human networks on the Intel Xenon X3350 (2.66GHz) CPU. On the same machine, M-GRAAL aligns these two networks in about 1.5 hours. This makes M-GRAAL more scalable for future, larger, more complete, PPI networks.
3 RESULTS AND DISCUSSION
In this section, we use M-GRAAL to do comparative analyses of biological networks and demonstrate the potential for its biological application. Clearly, we cannot and do not explore every possible application. In Section 3.1, we align PPI networks of eukaryotes baker’s yeast and human, while in Sections 3.2 and 3.3 we align prokaryotic PPI networks, of bacteria and viruses, respectively. We demonstrate that M-GRAAL exposes large subnetworks common across species. Also, it aligns proteins of the same function, hence enabling function prediction of unannotated proteins. Also, its edge
correctness scores can be used for successful reconstruction of phylogenetic relationships between species based purely on their PPI network topology.
3.1 Yeast-human PPI network alignment
We align with M-GRAAL the high-confidence yeastS. cerevisiae PPI network (Collinset al., 2007) with the high-confidence human PPI network (Radivojacet al., 2008), henceforth denoted as “yeast” and “human,” respectively. The former has 16,127 interactions amongst 2,390 proteins and the latter has 41,456 interactions amongst 9,141 proteins. To construct alignments, we exploreall possible25= 32combinations of the five topological and sequence measures discussed in Section 2.2. To account for a possible randomness in the algorithm caused by randomly breaking ties, we run each of the32tests 30 times and compute the statistics.
The highest edge correctness of 23.26%, comprised of 3,751 aligned interactions amongst 2,255 proteins, is obtained by an alignment that uses only signatures to score node pairs. We call this particular alignmentAlignment 1.However, using only signatures does not resolve all possible ties and leads to different alignments for different runs with the average EC of19.73%and the standard deviation of1.39%for the30runs. That is, such an alignment is not stable (see Section 1.2). Using only BLASTE-valuesdoes not resolve all possible ties either and also leads to different alignments for different runs with the average edge correctness of 13.30% and the standard deviation of 0.23% over the 30 runs. The best alignment obtained using only BLAST E-values has the EC of 13.73%and it consists of 2,215 aligned interactions amongst 2,208 proteins. We call this particular alignmentAlignment 2.When we use signatures, degrees, clustering coefficients and BLAST scores, we obtain alignments that are99.95%identical amongst the 30 runs and that always have the edge correctness of18.68%, consisting of 3,012 aligned interactions amongst 2,280 proteins. Therefore, using these four cost functions resolves almost all ties and leads to almost stable alignments differing only in one or two aligned pairs. We pick one of them at random and call itAlignment 3.Experiments with all other possible combinations of node distance measures either result in smaller edge correctness scores, or lead to very different alignments across different runs.
We further analyze the topological quality of Alignments 1, 2 and 3 by examining the size of their largest common connected subgraphs (LCCSs). The largest common connected subgraph is the largest connected subgraph that each of the aligned networks have as an exact copy. We examine this, since we prefer to align large and contiguous subgraphs rather than a number of small disconnected network regions (e.g., aligning only isolated edges would not give much insight into common topology of two networks). The size of the LCCS in Alignment 1 is 1,858 nodes and 3,467 edges, which is about77.7%and21.5%of the yeast’s nodes and edges, respectively. The LCCS uncovered by Alignment 2 has 1,659 nodes and 1,837 edges. Alignment 3, that uses both sequence and topology, has the LCCS with 1,853 nodes and 2,490 edges. Thus, all of these alignments expose large contiguous common network regions (also see Section 3.1.2).
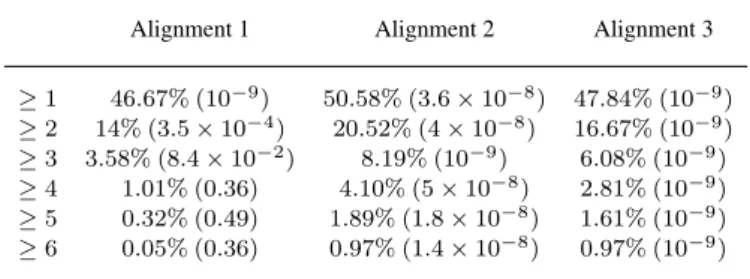
To measure the biological quality of the Alignments 1, 2 and 3, we count the fraction of aligned pairs that have at least 1, 2, 3, or more GO terms (Consortium, 2000) in common. The statistics and p-values are presented in Table 1. Alignment 1 that uses only
Table 1. Fraction of protein pairs in the alignment of yeast and human that share GO terms.
Alignment 1 Alignment 2 Alignment 3
≥1 46.67% (10−9) 50.58% (3.6×10⁻⁸) 47.84% (10−9) ≥2 14% (3.5×10⁻⁴) 20.52% (4×10⁻⁸) 16.67% (10−9) ≥3 3.58% (8.4×10⁻²) 8.19% (10−9) 6.08% (10−9) ≥4 1.01% (0.36) 4.10% (5×10⁻⁸) 2.81% (10−9) ≥5 0.32% (0.49) 1.89% (1.8×10⁻⁸) 1.61% (10−9) ≥6 0.05% (0.36) 0.97% (1.4×10⁻⁸) 0.97% (10−9)
Alignment 1 is purely topological. Alignment 2 is obtained when only sequence information is used to score node pairs. Alignment 3is obtained when signatures, degrees, clustering coefficients and BLAST E-values are used together to score node pairs. Numbers in brackets represent p-values.
signature similarities to score node pairs has the highest EC, but consists of aligned pairs statistically significant fraction of which share at least 1, 2, or 3, but no more GO terms. As expected, using BLAST E-value information improves these p-values (Alignments 2 and 3). Alignment 3 seems to be the best in terms of GO score enrichment in the aligned pairs, since it consists of pairs of proteins statistically significant fraction of which share up to 6 GO terms. This alignment also has a high edge correctness and it is the most stable alignment being 99.95% identical across different runs of the algorithm. For these reasons, we chooseAlignment 3to make protein function predictions for yeast and human proteins.
3.1.1 Protein function prediction. We construct our predictions as follows. To make the “Biological Process” predictions, we scan our yeast-human alignment to identify protein pairs where one protein is annotated with the root GO term GO:0008150 (biological process unknown) and the other protein is annotated with known biological process GO terms. Then we simply transfer the annotations from the annotated protein to the one which is not annotated. Predictions for “Molecular Function” and “Cellular Component” are done in the same fashion. We make “Biological Process” predictions for 45 human proteins, “Molecular Function” predictions for 32 human proteins and “Cellular Component” predictions for 64 human proteins. For yeast we make “Biological Process” predictions for 169 proteins, “Molecular Function” predictions for 446 proteins and “Cellular Component” predictions for 54 proteins. The Alignment 3 and predictions for yeast and human proteins are presented in Supplementary File 1.
For validating our predictions, we use the literature search and text-mining web-service CiteXplorer (Labarga et al., 2007) to perform automatic search of all published articles indexed in MEDLINE. For human proteins, this tool finds at least one article mentioning the protein of interest in the context of our predicted “Biological Process” for 42.22% of our predictions. Similarly, we validate 50% and 53.13% of our “Molecular Function” and “Cellular Component” human predictions, respectively. For yeast, we validate 10.06% of our “Biological Process” predictions, as well as 45.41% and 11.11% of our “Molecular Function” and “Cellular Component” predictions, respectively.
3.1.2 Comparison with other methods. The topological qualities ofAlignments1, 2 and 3 produced by M-GRAAL are impressive in comparison with alignments of the same networks with IsoRank (Singh et al., 2007), GRAAL (Kuchaiev et al., 2010) and H-GRAAL (Milenkovicet al., 2010). We ran IsoRank for allλfrom 0 to 1 in increments of0.1 using the same sequence similarity scores that we used in M-GRAAL. The alignments produced by this algorithm have edge correctness between0.632%and3.89%. The LCCS uncovered with the best alignment by IsoRank has just 261 interactions amongst 116 proteins. The best alignment produced by GRAAL algorithm has an edge correctness of11.72% with the LCCS of 900 interactions between 267 proteins. The best alignment of yeast and human, produced by H-GRAAL has an edge correctness of10.92%with the LCCS of 1,290 interactions between 317 proteins. In comparison, M-GRAAL’s Alignment 1 has EC of23.26%and the LCCS consisting of 3,467 interactions amongst 1,858 proteins. Thus, it exposes a common connected subgraph with an order of magnitude more nodes than any previous method. Furthermore, unlike IsoRank, M-GRAAL does not require the sequence score contribution to be adjusted manually by the user specified parameterλ; instead, this is done automatically by using the confidence scores matrix (see Section 2.2 for details).
We do not compare M-GRAAL to Graemlin 2 (Flannicket al., 2008) because Graemlin 2 requires a variety of other input information, including phylogenetic relationships between the species being aligned. In contrast, we can use the output from M-GRAAL to reconstruct the phylogenetic relationship between species (see Section 3.3). Recently, a new algorithm IsoRankN was published by Liaoet al.(2009). However, its output is many-to-many mapping between nodes in the network, whereas we define the global network alignment as a one-to-one mapping (see Section 2.1). Therefore, strictly speaking, IsoRankN does not solve the global alignment problem as we define it and its output can not be quantified using edge correctness scores. Thus, it is not comparable with M-GRAAL.
3.2 Aligning Bacterial PPI networks
3.2.1 Campylobacter jejuni vs Escherichia coli. We analyze the high-confidence “functional” interaction network of E. coli that integrates high quality experimental PPI and computational data (Peregrin-Alvarez et al., 2009). It consists of 3,989 interactions amongst 1,941 proteins. We analyze the high confidence C. jejuniPPI network consisting of 2,988 interactions amongst 1,111 proteins produced by yeast-2-hybrid experiments (Parrish et al., 2007). Similar to our yeast-human alignments, we use M-GRAAL to perform alignments using all possible combinations of costs functions (see Section 2.2 for details). We obtained protein sequences and GO annotation data for these bacteria from the European Bioinformatics Institute (EMBL-EBI) website of March 2010.
The best edge correctness of26.14%(or 781 aligned interactions) is achieved when we use only topological parameters, signatures and degrees, to score node pairs. The LCCS for this alignment has 629 nodes and 693 edges. However, this alignment does not contain statistically significant fraction of protein pairs sharing GO terms. Moreover, using only signatures and degrees does not resolve all possible ties and thus leads to different alignments for different M-GRAAL runs, with the average EC of24.44% and the standard
deviation of0.61%. Hence, using only these two topological scores is not enough to construct unambiguous high-quality alignments.
The alignment constructed using signatures, clustering coefficients and BLASTE-valuesis the most stable, more than99%the same across different runs, and it has a high edge correctness of24.16% with the LCCS consisting of 630 interactions amongst 579 proteins. Interestingly, this combination of cost functions is very similar to the one found to be the best for the yeast-human alignment (see Section 3.1). Also, this alignment is of high biological quality: out of the aligned pairs with both proteins being annotated with GO terms, 43.01%, 21.24%, 11.40%, and 6.22% share at least 1, 2, 3 or 4 terms, respectively, with the p-values for these GO terms enrichments being4.45×10−6, 4.86×10⁻⁹, 6.9×10⁻⁹ and 1.49×10⁻⁸, respectively. Since this alignment has statistically significant fraction of aligned protein pairs with 4 or more GO terms in common, we use it to predict function of unannotated proteins. As before, by using CiteXplorer (Labargaet al., 2007), we perform automatic search of articles indexed in MEDLINE to validate our predictions. ForC. jejuni, we predict “Biological Process” for 219 proteins, 3.65% of which we validated. Also, we validate 20% of 30 and 10.88% of 377 our predictions of “Molecular Function” and “Cellular Component,” respectively. For E. coli, we predict “Biological Process” for 26 proteins, 38.46% of which we validate. Also, we validate 50% and 43.69% of our 48 “Molecular Function” and 103 “Cellular Component” predictions, respectively. Clearly, the validation rates forE. coliare much higher. This is due to the fact thatE. coliis much more studied thenC. jejuniand thus, there are more articles discussing the function of its proteins. The alignment and the predictions for the bacteria are presented in Supplementary File 2.
3.2.2 Mesorhizobium vs Synechocystis. TheE. coliandC. jejuni, as well as the yeast and human PPI networks analyzed in the previous sections are all produced by different research groups, sometimes using different experimental techniques. This implies different and hard to estimate levels of noise and incompleteness of the data. To estimate the level of edge correctness that can be achieved by M-GRAAL for PPI networks, we align networks produced by the same lab and by the same experimental technique: PPI networks ofMesorhizobium lotiandSynechocystis sp. PCC6803PPI networks1. These networks contain about 24% and 52% of the protein coding genes from these organisms, respectively. The interactions were identified using a modified high-throughput yeast two-hybrid system (Shimodaet al., 2008; Sato et al., 2007). The Mesorhisobium network contains 3,094 interactions amongst 1,804 proteins and Synechocystis network contains 3,102 interactions amongst 1,920 proteins.
Again, we use all possible combinations of cost functions described above. The protein sequences and GO annotations were downloaded from Kazusa DNA Research Institute1on March 2010. The largest EC of 41.79% and was obtained when signatures, degrees, clustering coefficients, and eccentricities were used. This alignment has a tree-like LCCS with 1,142 nodes and 1,148 edges. Since interactions in these networks were detected by the same group and the same experimental technology, we obtain substantially higher edge correctness than in our previous
1 http://genome.kazusa.or.jp/
experiments in which we align networks published by different research groups. As before, to measure the biological quality of the alignments, we count how many of the aligned protein pairs share GO terms. The alignments based only on topological similarities between nodes do not have statistically significant enrichment in pairs that share GO terms. When we use all possible node scoring metrics described in Section 2.2), we obtain alignments with small drops in EC scores to the average of 39.75% that are almost stable, being 89% the same across different runs. In these alignments, a significant fraction of aligned pairs has at least 1, 2 or 3 GO terms in common, with p-values less than10−5. Hence, we use one of these alignments to predict functions of unannotated proteins (presented in Supplementary File 3). However, possibly due to different protein or gene naming schemes and also since these bacteria are not as well studied asE. ColiandC. jejuni, we were not able to validate these predictions in the literature.
3.3 Aligning viral PPI networks
All PPI networks discussed above contain only a fraction of proteins in each species and therefore, their alignment should not be used to reconstruct their phylogenetic relationship. The story is different for viral PPI networks described below.
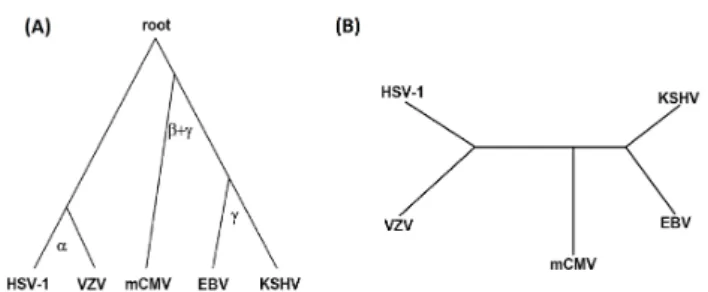
We analyze herpesviral protein interaction networks of five herpesviruses: varicella-zoster virus (VZV), Kaposis sarcoma-associated herpes virus (KSHV), herpes simplex virus 1 (HSV-1), murine cytomegalovirus (mCMV) and Epstein-Barr virus (EBV) (Fossum et al., 2009). Although these networks contain false positives and negatives due to noise in experimental techniques, they contain genome-wide PPIs, meaning that all possible protein pairs in each virus were tested for interaction. We have shown that topological alignments of metabolic networks can be used to reconstruct phylogenetic relationships between species (Kuchaiev et al., 2010). For these viruses, Fossum et al., 2009 has reconstructed phylogenetic relationships by counting the number of conserved interacting orthologous pairs in these species. We perform all-to-all solely topological global alignment of these PPI networks (based on signatures, degrees, and clustering coefficients) and use M-GRAAL’s edge correctness scores as distances between species in the neighbor-joining algorithm of the PHYLIP package (Felsenstein, 1989) to exactly reconstruct the phylogenetic tree of these viruses (Figure 1). The phylogenetic tree does not change over different runs of M-GRAAL. Note that, unlike Fossumet al., 2009, we did not use any type of sequence or orthology information. Hence, this is a strong evidence in support of our previous claim that network alignment may be used to reconstruct the species phylogeny (Kuchaievet al., 2010; Milenkovicet al., 2010).
3.4 Concluding Remarks
Aligning biological networks of different species is expected to be a valuable tool, since such comparisons may lead to knowledge transfer and exciting discoveries in evolutionary biology. In the light of forthcoming accumulation of huge amounts of biochemical and other domain network data, network alignment methods are expected to become increasingly valuable in improving our understanding and control of not only biological, but also social and technological networks.
Fig. 1. Phylogeny of the five investigated herpesviruses. (A)The “gold standard” tree (McGeoch and Gatherer, 2005; McGeochet al., 2006);(B)
Unrooted phylogenetic tree reconstructed from edge correctness scores of topological alignments produced by M-GRAAL.
ACKNOWLEDGMENTS
We thank Prof. Wayne Hayes and Dr. Tijana Milenkovi´c from Department of Computer Science at University of California, Irvine for helpful discussions and suggestions.
Funding: This project was supported by NSF CAREER IIS-0644424 grant.
REFERENCES
Altschul, S. F., Gish, W., Miller, W., and Lipman, D. J. (1990). Basic local alignment search tool.Journal of Molecular Biology,215, 403–410.
Barabasi, A.-L. and Albert, R. (1999). Emergence of scaling in random networks.
Science,286, 509–512.
Collins, S., Kemmeren, P., Zhao, X., Greenblatt, J., Spencer, F., Holstege, F., Weissman, J., and Krogan, N. (2007). Toward a comprehensive atlas of the physical interactome of saccharomyces cerevisiae.Molecular and Cellular Proteomics,6:3, 439–450.
Consortium, T. G. O. (2000). Gene ontology: tool for the unification of biology.Nature Genetics,25, 25–29.
Felsenstein, J. (1989). Phylip-phylogeny inference package (version 3.2). Cladistics, 5.
Flannick, J., Novak, A., Srinivasan, B. S., McAdams, H. H., and Batzoglou, S. (2006). Graemlin: General and robust alignment of multiple large interaction networks.
Genome Res.,16(9), 1169–1181.
Flannick, J., Novak, A., Do, C., Srinivasan, B., and Batzoglou, S. (2008). Automatic parameter learning for multiple network alignment.RECOMB.
Fossum, E., Friedel, C. C., Rajagopala, S. V., Titz, B., Baiker, A., Schmidt, T., Kraus, T., Stellberger, T., Rutenberg, C., Suthram, S., Bandyopadhyay, S., Rose, D., von Brunn, A., Uhlmann, M., Zeretzke, C., Dong, Y.-A., Boulet, H., Koegl, M., Bailer, S. M., Koszinowski, U., Ideker, T., Uetz, P., Zimmer, R., and Haas, J. (2009). Evolutionarily conserved herpesviral protein interaction networks.PLoS Pathog,5, e1000570.
Gavin, A., Aloy, P., Grandi, P., Krause, R., Boesche, M., Marzioch, M., Rau, C., Jensen, L., Bastuck, S., Dumpelfeld, B., Edelmann, A., Heurtier, M., Hoffman, V., Hoefert, C., Klein, K., Hudak, M., Michon, A., Schelder, M., Schirle, M., Remor, M., Rudi, T., Hooper, S., Bauer, A., Bouwmeester, T., Casari, G., Drewes, G., Neubauer, G., Rick, J., Kuster, B., Bork, P., Russell, R., and Superti-Furga, G. (2006). Proteome survey reveals modularity of the yeast cell machinery.Nature,440(7084), 631–636. Ho, Y., Gruhler, A., Heilbut, A., Bader, G. D., Moore, L., Adams, S. L., Millar, A., Taylor, P., Bennett, K., Boutilier, K., Yang, L., Wolting, C., Donaldson, I., Schandorff, S., Shewnarane, J., Vo, M., Taggart, J., Goudreault, M., Muskat, B., Alfarano, C., Dewar, D., Lin, Z., Michalickova, K., Willems, A. R., Sassi, H., Nielsen, P. A., Rasmussen, K. J., Andersen, J. R., Johansen, L. E., Hansen, L. H., Jespersen, H., Podtelejnikov, A., Nielsen, E., Crawford, J., Poulsen, V., Sorensen, B. D., Matthiesen, J., Hendrickson, R. C., Gleeson, F., Pawson, T., Moran, M. F., Durocher, D., Mann, M., Hogue, C. W., Figeys, D., and Tyers, M. (2002). Systematic identification of protein complexes in saccharomyces cerevisiae by mass spectrometry.Nature,415(6868), 180–3.
Kelley, B. P., Bingbing, Y., Lewitter, F., Sharan, R., Stockwell, B. R., and Ideker, T. (2004). PathBLAST: a tool for alignment of protein interaction networks. Nucl. Acids Res.,32, 83–88.
Koyuturk, M., Kim, Y., Topkara, U., Subramaniam, S., Szpankowski, W., and Grama, A. (2006). Pairwise alignment of protein interaction networks.
Krogan, N., Cagney, G., Yu, H., Zhong, G., Guo, X., Ignatchenko, A., Li, J., Pu, S., Datta, N., Tikuisis, A., Punna, T., Peregrin-Alvarez, J., Shales, M., Zhang, X., Davey, M., Robinson, M., Paccanaro, A., Bray, J., Sheung, A., Beattie, B., Richards, D., Canadien, V., Lalev, A., Mena, F., Wong, P., Starostine, A., Canete, M., Vlasblom, J., Wu, S., Orsi, C., Collins, S., Chandran, S., Haw, R., Rilstone, J., Gandi, K., Thompson, N., Musso, G., St Onge, P., Ghanny, S., Lam, M., Butland, G., Altaf-Ul, A., Kanaya, S., Shilatifard, A., O’Shea, E., Weissman, J., Ingles, C., Hughes, T., Parkinson, J., Gerstein, M., Wodak, S., Emili, A., and Greenblatt, J. (2006). Global landscape of protein complexes in the yeast saccharomyces cerevisiae.Nature,440, 637–643.
Kuchaiev, O., Milenkovic, T., Memisevic, V., Hayes, W., and Prˇzulj, N. (2010). Topological network alignment uncovers biological function and phylogeny.
Journal of the Royal Society Interface.
Kuhn, H. W. (1955). The hungarian method for the assignment problem. Naval Research Logistics Quarterly, (2), 83–97.
Labarga, A., Valentin, F., Andersson, M., and Lopez, R. (2007). Web services at the european bioinformatics institute. Nucleic Acids Research,35(Web Server issue), W6–W11.
Li, S., Armstrong, C., Bertin, N., Ge, H., Milstein, S., Boxem, M., Vidalain, P.-O., Han, J.-D., Chesneau, A., Hao, T., Goldberg, D., Li, N., Martinez, M., Rual, J.-F., Lamesch, P., Xu, L., Tewari, M., Wong, S., Zhang, L., Berriz, G., Jacotot, L., Vaglio, P., Reboul, J., Hirozane-Kishikawa, T., Li, Q., Gabel, H., Elewa, A., Baumgartner, B., Rose, D., Yu, H., Bosak, S., Sequerra, R., Fraser, A., Mango, S., Saxton, W., Strome, S., van den Heuvel, S., Piano, F., Vandenhaute, J., Sardet, C., Gerstein, M., Doucette-Stamm, L., Gunsalus, K., Harper, J., Cusick, M., Roth, F., Hill, D., and Vidal, M. (2004). A map of the interactome network of the metazoan c. elegans.
Science,303, 540–543.
Liao, C.-S., Lu, K., Baym, M., Singh, R., and Berger, B. (2009). Isorankn: spectral methods for global alignment of multiple protein networks.Bioinformatics,25(12), i253–258.
McGeoch, D., Rixon, F., and Davison, A. (2006). Topics in herpesvirus genomics and evolution.Virus Res.
McGeoch, D. J. and Gatherer, D. (2005). Integrating Reptilian Herpesviruses into the Family Herpesviridae.J. Virol.,79(2), 725–731.
Milenkovic, T. and Prˇzulj, N. (2008). Uncovering biological network function via graphlet degree signatures.Cancer Informatics,6, 257–273.
Milenkovic, T., Leong Ng, W., Hayes, W., and Prˇzulj, N. (2010). Optimal network alignment with graphlet degree vectors.Cancer Informatics. to appear.
Milo, R., Shen-Orr, S. S., Itzkovitz, S., Kashtan, N., Chklovskii, D., and Alon, U. (2002). Network motifs: simple building blocks of complex networks. Science, 298, 824–827.
Milo, R., Itzkovitz, S., Kashtan, N., Levitt, R., Shen-Orr, S., Ayzenshtat, I., Sheffer, M., and Alon, U. (2004). Superfamilies of evolved and designed networks.Science, 303, 1538–1542.
Newman, M. E. J. (2003). The structure and function of complex networks. SIAM Review,45, 167.
Parrish, J., Yu, J., Liu, G., Hines, J., Chan, J., Mangiola, B., Zhang, H., Pacifico, S., Fotouhi, F., DiRita, V., Ideker, T., Andrews, P., and Finley, R. (2007). A proteome-wide protein interaction map for campylobacter jejuni.Genome Biology,8(7), R130. Peregrin-Alvarez, J. M., Xiong, X., Su, C., and Parkinson, J. (2009). The modular organization of protein interactions in escherichia coli. PLoS Comput Biol,5(10), e1000523.
Pinter, R. Y., Rokhlenko, O., Yeger-Lotem, E., and Ziv-Ukelson, M. (2005). Alignment of metabolic pathways.Bioinformatics,21(16), 3401–3408.
Prˇzulj, N. (2007). Biological network comparison using graphlet degree distribution.
Bioinformatics,20, e177–e183.
Prˇzulj, N., Corneil, D., and Jurisica, I. (2004). Modeling interactome: Scale-free or geometric?Bioinformatics,20, 3508–3515.
Radivojac, P., Peng, K., Clark, W. T., Peters, B. J., Mohan, A., Boyle, S. M., and D., M. S. (2008). An integrated approach to inferring gene-disease associations in humans.Proteins, page in press.
Rual, J., Venkatesan, K., Hao, T., Hirozane-Kishikawa, T., Dricot, A., Li, N., Berriz, G., Gibbons, F., Dreze, M., Ayivi-Guedehoussou, N., Klitgord, N., Simon, C., Boxem, M., Milstein, S., Rosenberg, J., Goldberg, D., Zhang, L., Wong, S., Franklin, G., Li, S., Albala, J., Lim, J., Fraughton, C., Llamosas, E., Cevik, S., Bex, C., Lamesch.P., Sikorski, R., Vandenhaute, J., Zoghbi, H., Smolyar, A., Bosak, S., Sequerra, R.,
Doucette-Stamm, L., Cusick, M., Hill, D., Roth, F., and Vidal, M. (2005). Towards a proteome-scale map of the human protein-protein interaction network. Nature, 437, 1173–1178.
Sato, S., Shimoda, Y., Muraki, A., Kohara, M., Nakamura, Y., and Tabata, S. (2007). A Large-scale Protein protein Interaction Analysis in Synechocystis sp. PCC6803.
DNA Res,14(5), 207–216.
Sharan, R., Suthram, S., Kelley, R. M., Kuhn, T., McCuine, S., Uetz, P., Sittler, T., Karp, R. M., and Ideker, T. (2005). Conserved patterns of protein interaction in multiple species. Proceedings of the National Academy of Sciences of the United States of America,102(6), 1974–1979.
Shimoda, Y., Shinpo, S., Kohara, M., Nakamura, Y., Tabata, S., and Sato, S. (2008). A Large Scale Analysis of Protein-Protein Interactions in the Nitrogen-fixing Bacterium Mesorhizobium loti.DNA Res,15(1), 13–23.
Simonis, N., Rual, J.-F., Carvunis, A.-R., Tasan, M., Lemmens, I., Hirozane-Kishikawa, T., Hao, T., Sahalie, J. M., Venkatesan, K., Gebreab, F., Cevik, S., Klitgord, N., Fan, C., Braun, P., Li, N., Ayivi-Guedehoussou, N., Dann, E., Bertin, N., Szeto, D., Dricot, A., Yildirim, M. A., Lin, C., Smet, A.-S. D., Kao, H.-L., Simon, C., Smolyar, A., Ahn, J. S., Tewari, M., amd Stuart Milstein, M. B.,
Yu, H., Dreze, M., Vandenhaute, J., Gunsalus, K. C., Cusick, M. E., Hill, D. E., Tavernier, J., Roth, F. P., and Vidal, M. (2009). Empirically controlled mapping of the caenorhabditis elegans protein-protein interactome network. Nature Methods, 6(1), 47–54.
Singh, R., Xu, J., and Berger, B. (2007). Pairwise global alignment of protein interaction networks by matching neighborhood topology. In Research in Computational Molecular Biology, pages 16–31. Springer.
Singh, R., Xu, J., and Berger, B. (2008). Global alignment of multiple protein interaction networks.Proceedings of Pacific Symposium on Biocomputing 13, pages 303–314.
Suthram, S., Sittler, T., and Ideker, T. (2005). The plasmodium protein network diverges from those of other eukaryotes.Nature,438(7064), 108–12.
West, D. B. (2001).Introduction to Graph Theory. Prentice Hall, Upper Saddle River, NJ., 2nd edition.
Zaslavskiy, M., Bach, F., and Vert, J. P. (2009). Global alignment of protein-protein interaction networks by graph matching methods. Bioinformatics,25(12), i259– i267.