City University of New York (CUNY)
CUNY Academic Works
Dissertations, Theses, and Capstone Projects Graduate Center
2-2018
Social Capital and Analyst Forecasts
Jing Dai
The Graduate Center, City University of New York
How does access to this work benefit you? Let us know!
Follow this and additional works at:https://academicworks.cuny.edu/gc_etdsPart of theAccounting Commons
This Dissertation is brought to you by CUNY Academic Works. It has been accepted for inclusion in All Dissertations, Theses, and Capstone Projects by an authorized administrator of CUNY Academic Works. For more information, please [email protected].
Recommended Citation
Dai, Jing, "Social Capital and Analyst Forecasts" (2018).CUNY Academic Works.
SOCIAL CAPITAL AND ANALYST FORECASTS
by
JING DAI
A dissertation submitted to the Graduate Faculty in Business in partial fulfillment of the requirements for the degree of Doctor of Philosophy, The City University of New York
ii
© 2018 JING DAI All Rights Reserved
iii
Social Capital and Analyst Forecasts by
Jing Dai
This manuscript has been read and accepted for the Graduate Faculty in Business in satisfaction of dissertation requirement for the degree of Doctor of Philosophy.
Date Carol Marquardt
Chair of Examining Committee
Date Karl Lang Executive Officer Supervisory Committee: Carol Marquardt Rong Huang Min Shen Lin Peng
iv
ABSTRACT
Social Capital and Analyst Forecasts by
Jing Dai
Advisor: Carol Marquardt
This study examines the effect of social capital on analyst forecast accuracy. Using a county-level measure of social capital, I find that firms headquartered in counties with high social capital have greater forecast accuracy than firms headquartered in low social capital counties. In addition, I conduct two cross-sectional tests under conditions where social capital facilitates analyst forecast information collection and where social capital provides more assurance of information reliability. I find that the effect of social capital is more pronounced when firms’ headquarters are close to analyst brokerage firms. This is because geographically proximate analysts may have more channels to collect information. I also show that since high social capital can reduce analysts’ time and effort to verify the reported earnings when a firm has complicated operation, effect of social capital is more pronounced when a firm’s operation is complex. I also find that investors react more strongly to analyst forecast for firms headquartered in counties with low social capital, suggesting that the analyst’s role as an information intermediary is more valuable in this setting. Additionally, I employ the relocation of firms headquarters to better establish causality. The results are robust to regional fixed effect, accounting quality, management guidance, analyst fixed effect, and alternative measure of social capital. In sum, these findings suggest that social capital is an important factor that affects analysts forecast accuracy and informativenesss.
v
Acknowledgments
I would like to express my greatest gratitude to everyone who supported me throughout my time at The City University of New York. First and foremost I would like to thank the co-chairs of my dissertation committee: Professor Carol Marquardt and Professor Rong Huang for their valuable guidance, encouragement, and kindness during my doctoral studies. They set excellent examples as successful professors and prolific researchers which would inspire me in my whole career. I am also grateful for my dissertation committee members: Professor Min Shen and Professor Lin Peng. The dissertation would have been impossible for their suggestive comments and insights.
In addition to my committee, I would also like to thank faculty and staff in Accounting Department at Baruch College for providing a knowledgeable, supportive, and constructive work environment. Without the tremendous time and effort they devote to doctoral program, I would not make all the progress during my doctoral studies. Their willingness and availability of working with doctoral students witness every step of my progress on conducting research, improving teaching skills, and developing academic personnel. A very special thank you to my coauthors in all the other research projects for their enormous and valuable inspiration, endeavor, and support. I am also thankful to my fellow doctoral students and previous cohorts for their friendship, help, and collaborative discussions of research issues.
Last but not least, I am extremely grateful to my beloved parents and close friends. It is your love and support that lead me to where I am today.
vi
Table of Contents
Abstract ... iv
Acknowledgments ... v
Table of Contents………..………..vi
List of Tables……… ………vii
1 Introduction ... 1
2 Background ... 8
2.1 Social Capital ... 8
2.2 Benefits of Social Capital ... 9
2.3 Hypothesis Development ... 11
2.3.1 Social Capital and Analyst Forecast ... 11
2.3.2 Impact of Geographic Proximity on the Effect of Social Capital ... 13
2.3.3 Impact of Operation Complexity on the Effect of Social Capital ... 14
2.3.4 Social Capital and Analyst Forecast Informativeness ... 15
3 Research Design ... 17
3.1 Measure of Social Capital ... 17
3.2 Research Design ... 19 3.3 Sample Selection ... 24 3.4 Descriptive Statistics ... 25 4 Empirical Results ... 27 4.1 Main Results ... 27 4.2 Cross-Sectional Tests ... 29
4.3 Test of Analyst Forecast Informativeness... 31
5 Robustness ... 32
5.1 Headquarters Relocation Shock ... 32
5.2 Region Fixed Effect ... 34
5.3 Accounting Quality ... 34
5.4 Management forecast ... 35
5.5 Analyst fixed effect ... 36
5.6 Alternative measure of social capital ... 36
vii
References ... 39
List of Tables Appendix A ... 46
Appendix B ... 50
Figure 1a: Social capital by state ... 53
Figure 1b: Analyst forecast error by state ... 54
Figure 1c: Analyst forecast informativeness by state ... 55
Table 1: Sample Selection and Descriptive Statistics………...….54
Panel A: Sample Selection………...…………..56
Panel B: Descriptive Statistics………57
Table 3: The effect of social capital on analyst forecast accuracy ... 60
Table 4: The impact of geographic proximity on the effect of social capital ... 62
Table 5: The impact of operation complexity on the effect of social capital ... 64
Table 6: Social capital and analyst forecast informativeness ... 66
Table 7: Firms’ headquarters relocation ... 68
Table 8: Regional fixed effect... 70
Table 9: Controlling for accounting quality ... 72
Table 11: Analyst fixed effect... 76
1 1 Introduction
As important information intermediaries, financial analysts play a vital role in capital markets in interpreting and disseminating all kinds of information and in educating investors. The accuracy of analyst forecasts significantly affects investors’ decisions and aggregate market efficiency. Prior studies find that analyst forecasts predict future earnings more accurately than time-series statistical models (Brown, Hagerman, and Zmijewski 1987b), facilitate more accurate pricing of accruals (Barth and Hutton 2004), and convey information to the capital market (Lys and Sohn 1990; Francis and Soffer 1997; Gleason and Lee 2003). To better identify analysts who can more accurately forecast earnings, many studies have explored the role of analyst or firm characteristics (e.g., Bhushan 1989; O’Brien and Bhushan 1990; Lang and Lundholm 1996; Barth, Kasznik, and McNichols 2001; Lang, Lins, and Miller 2004; Tan, Wang, and Welker 2011). However, there are no extant studies examining the influence of firms’ local social environment on analyst forecast accuracy. This study intends to shed light on the black box of analyst forecast process by focusing on the impact of county-level social capital on analyst forecast accuracy.
As applied in the social science and economics literature, the term “social capital” generally encompasses notions of trust, cooperative norms, and association within groups. In the economics literature, researchers typically view social capital as a set of beliefs and values that foster cooperation, such as propensities to honor obligations, mutual trust, altruism and community-centric attitudes (Knack and Keefer 1997; Whiteley 2000; Rupasingha, Goetz, and Freshwater 2000; Guiso, Sapienza, and Zingales 2004). In the management literature, social capital is usually viewed as social networks from which
2
interest parties can obtain benefit (Baker 1990; Burt 1995; Adler 2009). In the political science literature, Putnam (1995) defines social capital as the features of social organizations, such as networks, norms, and social trust, that facilitate coordination and cooperation for mutual benefit. In the accounting literature, studies find that social capital improves financial reporting quality (Jha 2013), reduces audit fees (Jha and Chen 2015), lowers loan spread (Cheng, Wang, and Zhao 2016) and municipal bond yields (Li, Tang, and Jaggi 2016), facilitates tax filing compliance (Alm, Clark, and Leibel 2011), and enhances the likelihood of issuing a management earnings forecast (Lu 2014). Accounting researchers typically adopt the definition of Woolcock (2001) that social capital is the set of norms and networks that facilitate collective action. Consistent with this definition, I also adopt Woolcock (2001) definition and emphasize several vital aspects of social capital, namely, mutual trust, propensities to honor obligations, altruism, and civic and social associations.
According to social identity theory, a portion of a person’s self-concept is based upon the perception of his social group (Turner and Oakes, 1986), which provides support to the argument that a firm’s culture is consistent with its regional culture. Therefore, managers in high social capital counties are expected to value mutual trust and altruism and honor legitimacy and obligation. As such, they are less likely to manage earnings, commit financial fraud, or release misleading management forecasts (Jha 2013). In addition, they are more likely to disclose and disclosure tend to be more sepcific (Lu 2014). Therefore, the information analysts rely on to predict earnings is more reliable and useful. Dense social networks in high social capital counties can also facilitate information collection. Thus, I expect firms headquartered in counties with high social
3
capital will have more accurate analyst forecasts. It is possible, however, that since managers in high social capital counties are less likely to manipulate earnings or smooth earnings over time to meet analyst forecasts, firms headquartered in high social capital counties may have less accurate analyst forecasts.1 How social capital affects analyst forecast accuracy thus becomes an open empirical question.
To construct a comprehensive county-level index to measure social capital, I follow steps in Rupasingha and Goetz (2008). Using principal component analysis, I build the county-level social capital index based on four factors: the census response rate, the voter rate, the number of social and civic associations, and the number of nongovernment organizations in each county. Consistent with the argument of Guiso et al. (2004), Jha (2015), and Cheng et al. (2016), this index captures the resources that accrue to people as a result of participation in social networks. Following Dhaliwal and Radhakrishnan (2012), I also use analyst forecast error as an inverse measure of forecast accuracy. Analyst forecast error (Forecast Error) is defined as the average of all absolute
value of differences between analyst forecast and its target earnings, divided by the stock price at the beginning of the year.
I employ a sample of 28,005 firm-years from 1990 to 2009 to examine the effect of social capital on analyst forecast accuracy. I find that social capital is significantly and positively associated with analyst forecast accuracy after controlling for firm, analyst, and county characteristics. One standard deviation increase in the county-level social capital index increases analyst forecast accuracy by 6.656%, indicating that my results are also
1 The analysts’ consensus earnings forecast is an important target for public firms (Brown and Caylor 2005). Therefore, managers exert considerable effort to meet or beat this benchmark (Graham, Harvey, and Rajgopal 2005).
4
economically significant. Overall, these results provide evidence that firms headquartered in high social capital counties have more accurate analyst forecasts.
I next conduct two cross-sectional tests to examine whether the effect of social capital on analyst forecast accuracy is relatively more or less pronounced when social norms and social connections play important roles. First, I examine the role of social connections by testing the effect of social capital on analyst forecasts when analysts are close to the firms. On the one hand, analysts located close to a firm may enjoy an information advantage, which suggests that geographically proximate analysts can more accurately predict earnings. On the other hand, when analyst brokerage firms locate close to firms, analysts can collect information through alternative sources (e.g., local media and direct observation of firms’ operations). Therefore, it is unclear whether the effect of social capital on analyst forecast accuracy varies systematically with geographical proximity to analyst brokerage firms. Second, I examine the role of social norms by comparing the forecasts of firms with high operation complexity to those with low operation complexity. When a firm’s operation is complex, analysts are more likely to fail to incorporate all available information into their earnings forecasts due to the limitation on time and ability. An increase in operation complexity may thus reduce analyst forecast accuracy (Gu and Wang 2005; Plumlee 2003). High social capital, however, may mitigate the effect of operation complexity by increasing credibility of the reported numbers. Alternatively, when information is complex, it is well known that managers will issue more voluntary disclosure to increase the average precision of investors’ beliefs about future cash flow (Kim and Verrecchia 1991; Verrecchina 1990; Guay, Samuels, and Taylor 2016), which may supersede the role of social capital.
5
Therefore, it is also unclear whether the effect of social capital on analyst forecast accuracy is affected by a firm’s operations complexity.
Employing the spatial distance between the firm and the analyst brokerage firm as the proxy for geographic proximity, I find that the effect of county-level social capital on analyst forecast accuracy is more pronounced when analyst brokerage firms are close to firms, suggesting that social capital facilitates geographically proximate analysts’ information collection through intense social connection with local employees, suppliers, customers, bankers, and competitors. Following prior studies, I use the number of business segments as a measure of a firm’s operation complexity because the more business segments a firm operates, the more uncertain environment the firm faces, the more technical supports the firm needs, the more stakeholders the firm copes with, and the more difficult for managers to make decision (Markarian and Parbonetti 2007; Barinov, Shawn, and Yildizhan 2016). I find that the effect of county-level social capital is more pronounced when a firm’s operations are more complex, indicating that social capital facilitates analyst information collection and makes managers less likely to use complexity as a cover to manipulate earnings.
Since analyst forecasts represent a primary information resource for investors, it is important to understand whether information conveyed to capital market by analyst forecasts varies with social capital. I therefore examine whether social capital affects the analyst forecast informativeness. Following prior studies (e.g., Asquith, Mikhail, and Au 2004; Frankel, Kothari, and Weber 2006), I calculate informativeness as the sum of the absolute market adjusted returns on the analyst forecasts revision dates for a firm in a given fiscal year, scaled by the number of analyst forecast revision days for the firm in
6
the fiscal year. I find that analyst forecasts are more useful and informative to investors for firms headquartered in low social capital counties where managers’ credibility is also low, which suggests that analyst forecasts serve as a substitutional role for managers’ credibility (Holthausen and Verrecchia 1988, Subramanyam 1996).
The empirical tests thus far suggest that social capital and analyst forecast accuracy are significantly associated. Following Cheng et al. (2016), I employ firms’ headquarters relocations to better establish causality. Using a sample of firms’ relocating their headquarters, I dichotomize the sample into firms that move to a county with higher social capital and those that move to a county with lower social capital. I find that analyst forecast error and informativeness decrease when a firm relocates to a higher social capital county and vice versa. These results further provide the evidence that increase in
social capital results in the decrease in analyst forecast errors and informativess and vice
versa. Then I conduct several robustness tests and find that my results are robust to
regional fixed effect, accounting quality, management guidance, analyst fixed effect, and alternative measure of social capital.
This study makes several contributions to the literature. My study extends an emerging stream of accounting literature that documents the effect of social capital on firms’ behaviors (Alm, Clark, and Leibel 2011; Jha 2013; Jha 2014; Jha and Chen 2015; Cheng et al. 2016; Li, Tang, and Jaggi 2016). To my knowledge, it is the first study examines that effect of social capital on analyst forecast accuracy. I find that the social environment in which a firm’s headquarter is located can improve the firm’s analyst forecast accuracy through social norms and social connections.
7
Second, this study sheds light on the black box of analyst forecast process. Although analysts are important information intermediaries, prior literature has not thoroughly examined the black box of how analysts process their forecasts. Ramnath, Rock, and Shane (2008), Bradshaw (2011), and Brown, Call, Clement, and Sharp (2015) conclude that research on the black box of analysts’ decision process is required for further studies to progress. This study provides evidence that social capital is an important factor that influences analysts’ ability to obtain reliable information, and, in turn, more accurately forecast earnings.
Thirdly, this study provides evidence of how the information conveyed to investors by analysts varies with social capital. In prior literature, it is unclear whether analyst forecasts serve a substitutional role (Holthausen and Verrecchia 1988, Subramanyam 1996) or complementary role for financial reporting quality (Lang and Lundholm 1996; Francis, Schipper, and Vincent 2002; Frankel, Kothari, and Weber 2006). Consistent with Holthausenand Verrecchia 1988 and Subramanyam 1996, the results in my tests show that analyst forecasts are more useful for investors when firms are headquartered in low social capital locales where managers’ credibility is low, indicating that analyst forecasts serve a substitutional role for managers’ credibility.
The rest of the paper is structured as follows. Section 2 reviews the prior literature and develops hypotheses. Section 3 develops the measure of social capital and research methodology and discusses sample selection and descriptive statistics. Section 4 presents the empirical results. Section 5 reports robustness tests and section 6 concludes.
8
2 Background
2.1 Social Capital
Since Coleman (1988) first paralleled social capital with other types of capital, such as financial, physical, and human, it has attracted increasing attention in economics, management, and political science (Putnam 2000; Woolcock 2001; Payne, Moore, Griffis, and Autry 2011). Although the definition of social capital has varied, it is generally perceived as encompassing notions of trust, cooperative norms, and associations within groups. In the economics literature, researchers view social capital as a set of beliefs and values that foster cooperation, such as propensities to honor obligations, mutual trust, altruism, and community-centric attitudes (Knack and Keefer 1997; Whiteley 2000; Rupasingha, Goetz, and Freshwater 2000; Guiso, Sapienza, and Zingales 2004). In the management literature, social capital is usually regarded as a social network from which interest parties can obtain benefit. For example, Burt (1992) defines social capital as “through friends, colleagues, and more general contacts the player receives opportunities to use his or her financial and human capital.” Baker (1990) describes social capital as “a resource that actors derive from specific social structures and then use to pursue their interests.” Adler (2009) views social capital as “a resource for individual and collective actors created by the configuration and content of the network of their more or less durable social relations.” In the political science literature, Putnam (1995) defines it as features of social organizations, such as networks, norms, and social trust, that facilitate coordination and cooperation for mutual benefit.
Since Jha (2013) introduced social capital into the accounting literature, several studies have examined the impact of social capital on stakeholders. Prior studies find that
9
social capital improves financial reporting quality (Jha 2013), reduces audit fees (Jha and Chen 2015), lowers loan spread (Cheng, Wang, Zhang, and Zhao 2016) and municipal bond yields (Li, Tang, and Jaggi 2016), facilitates tax filing compliance (Alm, Clark, and Leibel 2011), and enhances the likelihood of issuing a management earnings forecast (Lu 2014). Researchers typically take the definition of social capital by Woolcock (2001) that social capital is norms and networks that facilitate collective action. Taking the core concepts of social capital and conventional agreements on social capital into consideration, I also adopt the definition of Woolcock (2001) and emphasize several vital aspects of social capital, namely, mutual trust, propensities to honor obligations, altruism, and civic and social associations.
2.2 Benefits of Social Capital
Social capital fosters economic growth through facilitating information sharing, reducing transaction costs, and increasing investments in public goods, thereby making contracts more efficient and enhancing cooperation. Rupasingha, Goetz, and Freshwater (2000) argue that “good” social capital reduces information and transaction costs and increase investments in public goods and find that social capital has a statistically significant and positive effect on the rate of per-capita income growth. Whiteley (2000) shows that social capital can enhance economic growth through both direct and indirect mechanisms. The direct mechanism works via reducing transaction costs, creating a high trust society in which principal-agent problems are much less significant. The indirect mechanism works via interaction between social and human and physical capital. Using indicators of trust and civic norms from the World Values Surveys, Knack and Keefer
10
(1997) document that trust and civic cooperation are two important dimensions of social capital that are associated with stronger economic performance.
In management studies, researchers have documented that social capital is conducive to the development of both organizations and individuals within those organizations. Burt (1992) and Podolny and Baron (1997) find that an individual’s career advancement is enhanced by a network for acquiring information and resources. Using data from multiple respondents in all the business units of a large multinational electronics company, Tsai and Ghoshal (1998) shows that social capital increases the extent of interunit resource exchange and product innovation. Nahapiet and Ghoshal (1998) documents that social capital facilitates the creation of new intellectual capital and firms with high social capital have an advantage over markets in creating and sharing intellectual capital. Walker, Kogut, and Shan (1997) demonstrates that social capital can nurture the network formation of start-ups firms.
Social capital also plays a vital role in financial markets. Jha (2013) shows that financial reporting quality is higher when a firm is headquartered in a high social capital region because both the altruistic norms and the dense networks in a high social capital region induce the managers to report financial conditions truthfully. Jha and Chen (2015) focuses on the dimension of mutual trust in social capital and finds that auditors judge the trustworthiness of their clients based on where the firm is headquartered and charge a premium when they trust the firm less. Cheng et al. (2016) documents that firms with higher social capital are associated with lower loan spread as firms headquartered in high social capital counties are more likely to honor obligations and less likely to default. Other studies also document that firms headquartered in high social capital counties have
11
better tax filing compliance (Alm, Clark, and Leibel 2011), higher likelihood of issuing a management earnings forecast (Lu 2014), higher corporate social responsibility (Jha and Chen 2015), and lower municipal bond yields (Li, Tang, and Jaggi 2016).
2.3 Hypothesis Development
2.3.1 Social Capital and Analyst Forecast
Social identity theory provides support to the argument that a firm’s culture is consistent with its regional culture. According to social identity theory, a portion of person’s self-concept is based upon the perception of his social group (Turner and Oakes 1986). Therefore, the thinking, values, and actions of firm managers and other employees are influenced by their regional culture, resulting in an alignment between whole firm culture and regional culture. As such, a firm headquartered in county with high social capital also has high social capital and congruent social values and vice versa.
Based on social identity theory, I expect that a firm headquartered in a county with high social capital will have more accurate analyst forecasts. Analysts forecast firms’ earnings based on two main information resources, namely, management guidance and annual reports (Lang and Lundholm 1996; Barker and Imam 2008). Due to managers’ reporting incentives and stock based compensation, managers may report annual reports and disclose management guidance in a way to satisfy their own self-interest through accrual-based earning management, real earnings management, and misleading management forecast, inducing bias into these two information resources (e.g., Summers and Sweeney 1998; Nagar, Nanda, and Wysocki 2003; Cheng and Lo 2006). Managers in
12
a high social capital locale, however, value mutual trust and altruism and honor legitimacy and obligation. Therefore they are less likely to manage earnings, commit financial fraud, and disclose misleading management forecasts (Jha 2013; Lu 2014), which reduce the management-induced bias in the information conveyed to the market. Therefore, social capital enhances the credibility of the information on which analysts rely.2 In addition, dense social networks in the high social capital county can reduce information asymmetry between firms and analysts by facilitating information collection in terms of cost, timeliness, and volume. To the extent that social capital enhances the precision, timeliness, and volume of information that analysts have received, analysts’ uncertainty about firms’ operations and financial position will decrease, and in turn analyst forecast accuracy is expected to increase with social capital.
Alternatively, it is possible that firms headquartered in high social capital locales have less accurate analyst forecasts. Analysts’ consensus earnings forecast is an important target for public firms (Brown and Caylor 2005). Therefore, managers exert considerable effort to meet or beat these targets (Graham, Harvey, and Rajgopal 2005). Since managers’ altruism and honor of legitimacy and obligation can reduce earnings management (Jha 2013), managers may be less likely to manipulate earnings or smooth earnings over time to meet analyst forecasts. Because smooth earnings can facilitate analyst forecasts, high social capital may lead to more variable reported earnings and reduce analyst forecast accuracy. For this reason, I state my first hypothesis in null form.
2 It is possible that bias in annual financial reports and management guidance could result from unintentional errors. This type of bias can also be mitigated by the influence of social capital on managers’ behaviors. Since managers in a high social capital locale are more likely to truthfully report their firms’ financial position and business operations, once material discrepancy between their previous disclosures and most recent expectation is revealed, they are also more likely to disclose updated expectation through forecast revisions, press releases and all other possible channels and tools. As such, analysts can predict earnings based on more timely information.
13
H1: There is no effect of social capital on analyst forecast accuracy.
2.3.2 Impact of Geographic Proximity on the Effect of Social Capital
Geographic proximity between firms and their analysts may play an important role on the effect of social capital on analyst forecast accuracy. On the one hand, analysts located close to a firm may enjoy an information advantage through social connections. Analysts who join the same clubs as their following firms’ managers or have common friends or families with the managers are more likely to obtain valuable “soft” information and incorporate this information into their earnings forecast. In addition, Malloy (2005) and Bae, Stulz, and Tan (2008) point out that geographically proximate analysts may have better access to information via personal connections to management, local employees, customers, and competitors. Therefore, analysts can collect more information in a timelier and less costly way through dense social connections, reducing the information asymmetry between firms and analysts. As such, social capital is conducive for the geographically proximate analysts to more accurately predict earnings. On the other hand, when analysts locate close to a firm, they can collect information through alternative sources, e.g., local media and newspapers. In addition, they can directly observe firm’s day-to-day operations. For instance, if a firm is unusually busy, analysts might observe many trucks being loaded (Bae et al. 2008). Therefore, these alternative channels of information gathering may supersede the role of social capital. If so, I conjecture that the effect of social capital on analyst forecast accuracy is less
14
pronounced when analysts locate close to a firm. I therefore state my second hypothesis in null form:
H2: The effect of social capital on analyst forecast accuracy is not affected by the
geographic proximity between a firm and its analyst brokerage firms.
2.3.3 Impact of Operation Complexity on the Effect of Social Capital
Li (2008) finds that managers use operation complexity to hide or obfuscate information, such as poor performance. Analysts’ time and energy are limited when they perform their tasks. Therefore, when a firm’s business transaction and operation are complicated, it takes analysts more time and effort to process and analyze business model. In addition, analysts are more likely to fail to incorporate all available information into their earnings forecasts due to limitations of time and ability. As a result, analyst forecast accuracy is more likely to be compromised. Guay, Samuels, and Taylor (2016) also show that the complexity of the firm’s business transactions can lead to financial reporting complexity. When financial reporting is complex, it is harder for analysts to verify the information. Therefore, an increase in a firm’s operation complexity will reduce its analyst forecast accuracy (e.g., Plumlee 2003; Lehavy, Li, and Merkley 2011; Bozanic and Thevenot 2015). Social capital, however, may mitigate the effect of operation complexity on analyst forecast accuracy. Because managers in high social capital counties usually value mutual trust and altruism and honor legitimacy and obligation, they are more likely to truthfully report their operations and less likely to intentionally
15
use the complexity to hide and obfuscate information. If so, the effect of social capital on analyst forecast would be strong when the social capital is high.
Alternatively, managers’ voluntary disclosure due to information asymmetry may supersede the role of social capital. Guay, Samuels, and Taylor (2016) also documents that managers issue more voluntary disclosure to mitigate information asymmetry when information is complicated. When information is complex, information processing costs increases, which result in a decrease in the average precision of investors’ beliefs about future cash flow (Kim and Verrecchia, 1991). Verrecchina (1990) shows that a decrease in average precision of investors’ beliefs about future cash flow leads to an increase in voluntary disclosure. With sufficient information supplied by managers, analyst forecasts may be more accurate. Therefore, the increase in analyst forecast accuracy may be caused by managers’ voluntary disclosure instead of social capital.3 If so, I conjecture that the effect of social capital on analyst forecast accuracy is less pronounced when firms’ operations are complex. I therefore state my third hypothesis in null form:
H3: The effect of social capital on analyst forecast accuracy is not affected by
a firm’s operations complexity.
2.3.4 Social Capital and Analyst Forecast Informativeness
Since analyst forecasts are one of the main resources investors rely upon making investment decisions, it is important to understand whether and how the information
3
Although Lu (2014) shows that social capital also increases voluntary disclosure, it is because managers are more likely to be concerned about their reputation of providing transparent information in the high social capital locales where social connections are dense and people have greater propensities to honor legitimacy and obligations. This concern is different from the incentive of increasing the average precision of investors’ beliefs about future cash flow.
16
conveyed to investors by analyst varies with social capital. Jha (2013) documents that social capital has a statistically significant and positive effect on financial reporting quality because the altruistic norms and dense networks in high social capital region are more likely to induce managers to truthfully report financial conditions. However, it is unclear how financial reporting quality influences analyst forecasts informativeness. One stream of studies shows that analyst forecasts and firms’ financial reporting quality are substitutes because investors demand alternative information when firms’ information is obscure (Holthausen and Verrecchia 1988, Subramanyam 1996). In contrast, another stream of studies posits that analyst forecasts and firms’ financial reporting quality are complements because high financial reporting quality will reduce analysts’ cost of supplying informativeness (Lang and Lundholm 1996; Francis, Schipper, and Vincent 2002; Frankel, Kothari, and Weber 2006).
If analyst forecasts are substitutes for financial reporting quality, analyst forecasts of firms headquartered in low social capital locales are expected to be more informative and valuable for investors. This argument is also consistent with the idea of Cheng and Jha (2015) and Li, Tang, and Jaggi (2016), i.e., social capital plays an important role in substituting for managers’ credibility and providing more insights to interested parties, namely auditors, creditors, and investors. Moreover, if analyst forecasts are complements for financial reporting quality, analyst forecasts of firms headquartered in low social capital locales are expected to be less informative because low financial reporting quality makes it harder and more costly for analysts to supply informativeness.
17
H4: Social capital has no effect on analyst forecast informativeness.
3 Research Design
3.1 Measure of Social Capital
Different methods have been used to measure social capital in the prior studies: the level of trust from survey data (e.g., Whiteley 2000), indicators of norms from the World Values Surveys (e.g., Knack and Keefer 1997), tax filing compliance (e.g., Alm, Clark, and Leibel 2011), and the number of associations (e.g., Laursen, Masciarelli, and Prencipe 2012). Although these measures have been successfully used to varying degrees, it is difficult for a single measure to completely capture the multiple dimensions of social capital. In recent accounting studies, researchers typically follow Rupasingha and Goetz (2008) to use a comprehensive county-level index of social capital. In this study, I also adopt this method to measure social capital. Specifically, I construct a county-level social capital index using principal component analysis of four factors: the census response rate, the voter rate, the number of social and civic associations; and the number of nongovernment organizations in each county.
The census response rate and voter rate are used to capture social norms. Since there are only very small economic incentives or legal incentives for people to vote and engage in this civic activity, the decision to participate in these voluntary activities is mainly motivated by social pressure and internal norms. Higher values of the census response rate and voter rate represent higher social norms. The census response rate is the response rate to the U.S. Census Bureau’s decennial census. The voter rate is the number of votes cast, scaled by the population above 18 years old (times 100).
18
The number of social and civic associations and the number of nongovernment organizations in each county are used to capture social networks. Social capital manifests itself in individuals through their participation in associational activities (Rupasingha, Goetz, and Freshwater 2006). In particular, Putnam (1995) points out that individuals’ participation in associational activities instills in their members’ habits of economic cooperation, solidarity, and public spiritedness. Such activities facilitate information sharing through repeated interactions and these interactions promote reciprocity (Rupasingha, Goetz, and Freshwater 2006). The higher the number of social and civic associations and the number of nongovernment organization in each county, the denser the social networks. Specifically, the number of social and civic associations is the sum of the religious organizations, civic and social associations, business associations, political organizations, professional organizations, labor organizations, bowling centers, physical fitness facilities, public golf courses, sport clubs, managers and promoters, membership sports and recreation clubs, and membership organizations. As in prior studies (Rupasingha and Goetz 2008, Jha and Chen 2015), the total amount is divided by 12 because there are 12 different categories and then scaled by the population. The number of nongovernment organizations is the sum of nongovernment organizations, excluding those with an international focus, divided by population (multiplied by 10,000).
As in prior studies (Rupasingha and Goetz 2008, Jha and Chen 2015), because the four input variables are only available in 1990, 1997, 2005, and 2009, I calculate the social capital index by principal component analysis for these four years and then linearly interpolate values to fill the missing years. After constructing the social capital index, I match it to each firm’s headquarter through zip codes. Since Compustat does not provide
19
the historical zip code of a firm’s headquarter, I perform a textual analysis on firms’ 10-K filings downloaded from SEC’s EDGAR system to extract firms’ historical zip code. Therefore, I match county-level social capital index to firms’ headquarters using a dynamic zip code.
3.2 Research Design
Hypothesis H1 examines the effect of social capital on analyst forecast accuracy. County-level social capital index is constructed as described above. Following Dhaliwal and Radhakrishnan (2012), I use analyst forecast error as an inverse measure of forecast accuracy. Analyst forecast error (Forecast Error) is defined as the mean of the absolute
differences between an analyst’s most recent forecast and its actual target earnings, divided by the stock price at the beginning of the year, as follows4:
𝐹𝐸𝑅𝑅𝑂𝑅𝑖,𝑡 = 1 𝑛∑ |𝐹𝐶𝑖,𝑡,𝑚−𝐸𝑃𝑆𝑖,𝑡| 𝑛 𝑚=1 𝑃𝑖,𝑡 . (1)
where 𝐹𝐶𝑖,𝑡,𝑚 denotes the most recent forecast m issued for firm i in year t, 𝐸𝑃𝑆𝑖,𝑡 is the actual earnings of firm i in year t, 𝑃𝑖,𝑡 is the stock price of firm i at the beginning of the
year t, and n is the number of analyst’s forecasts issuing for firm i.
To test hypothesis H1, I employ the following ordinary lease squares (OLS) regression model:
20
𝐹𝐸𝑅𝑅𝑂𝑅𝑖,𝑡 = 𝛼0+ 𝛼1𝑆𝑜𝑐𝑖𝑎𝑙 𝐶𝑎𝑝𝑖𝑡𝑎𝑙𝑖,𝑡−1+ 𝐹𝑖𝑟𝑚 𝐶ℎ𝑎𝑟𝑎𝑐𝑡𝑒𝑟𝑖𝑠𝑡𝑖𝑐𝑠 + 𝐴𝑛𝑎𝑙𝑦𝑠𝑡 𝐶ℎ𝑎𝑟𝑎𝑐𝑡𝑒𝑟𝑖𝑠𝑡𝑖𝑐𝑠 + 𝐶𝑜𝑢𝑛𝑡𝑦 𝐶ℎ𝑎𝑟𝑎𝑐𝑡𝑒𝑟𝑖𝑠𝑡𝑖𝑐𝑠
+ 𝐼𝑛𝑑𝑢𝑠𝑡𝑟𝑦 𝐹𝑖𝑥𝑒𝑑 𝐸𝑓𝑓𝑒𝑐𝑡 + 𝑌𝑒𝑎𝑟 𝐹𝑖𝑥𝑒𝑑 𝐸𝑓𝑓𝑒𝑐𝑡 + 𝜀.5 (2)
The independent variable of interest in this specification is the county-level social capital index. Since H1 is in null form, I do not make a prediction regarding the sign of the coefficient 𝛼1.
I control for firm-level, analyst-level and county-level characteristics that may affect analyst forecast accuracy. For firm characteristic, I control for firm size, market-to-book, intangible assets, annual stock return, stock turnover, security issuance, and five-year stock return volatility. These variables are drawn from the prior literature that shows that they affect analyst forecast accuracy in at least some circumstances (e.g., Bhushan 1989; O’Brien and Bhushan 1990; Lang and Lundholm 1996; Barth, Kasznik, and McNichols 2001; Lang, Lins, and Miller 2004; Tan, Wang, and Welker 2011).
Analyst characteristic controls include the number of analysts following the firm, forecast horizon, the number of firms analysts cover, analyst general experience, analyst firm-specific experience, and brokerage size. All of these variables are aggregated to firm-level. The number of analysts represents the intensity of competition in the market and is used to control for incentives to forecast accurately (Lys and Soo 1995). Jacob, Lys, and Neale (1999) shows that the length of forecast horizon is negatively associated with analyst forecast accuracy because greater forecast horizon is more likely to lead the
5 In an expanded specification, corporate governance measures are added but limit the sample to S&P 1,500 firms because all corporate governance measures come from ISS (formerly RiskMetrics). ISS only includes S&P 1,500 firms.
21
information collected by analysts to be less accurate. Since analysts who cover more firms, have greater general and firm-specific experience, and work for larger brokerage firm are more likely to be capable analysts and have more information resources (Clement 1999), their forecasts are also likely to be more accurate due to their outstanding ability. Moreover, the heavy workload may also stretch analysts’ time and effort, making the forecast less accurate. Therefore, I do not make a prediction on the association between these variables and analyst forecast accuracy.
To ensure that my findings are not driven by county characteristics, I add county controls to the model. Recent studies show that a religious culture leads to more ethical and less risky behavior (McGuire, Omer, and Sharp 2012; Jiang, Li and Qian 2013; Omer, Sharp, and Wang 2016). Although religiosity is overlapped with social capital, social capital captures social norms and social connections more comprehensively than religiosity. Religiosity is therefore included in all model specification to show that social capital has incremental explanatory power over religiosity. To control for the economic characteristic in a county, I include income per capita, population, population growth, education level, and rurality.
Better corporate governance induces stronger monitoring of firms’ financial reporting and disclosure behavior, which in turn may increase analyst forecast accuracy. To mitigate the concern that my results are driven by variation in corporate governance practices, I add corporate governance measures to an expanded specification: Litigation
risk is an indicator variable equal to one if the firm belongs to high-risk industry and zero otherwise. Dual is an indicator variable equal to one if the CEO is also the chair of the
22
independent directors on the board. Financial expert is the number of directors with
financial or accounting expertise divided by the total number of directors on the board. Corporate governance measures come from ISS (formerly RiskMetrics), which only
includes S&P 1500 firms and therefore limits my sample size. Year and industry fixed effects are included to control for other unobservable or missing characteristics across years and industries. Standard errors are clustered at the county level to control for potentially correlated error terms.
In H2, I examine whether the effect of social capital on analyst forecast accuracy is affected by the average geographic proximity between a firm and its analyst brokerage firms. To calculate the distance, I first obtain brokerage firm codes and analysts codes and merge them to the I/B/E/S Broker Translation File to identify brokerage firms’ names. I then manually match each brokerage firm name with entries from Nelson’s Directory of Investment Research, which provides the zip code of the brokerage firm headquarter.6 With the firm headquarter historical zip code extracted from its annual 10-K filing from EDGAR and brokerage firms’ zip code, I calculate the spatial distance between the firm headquarter and its brokerage firms. The average value of all distances between a firm and its analyst brokerage firms is used to measure the analyst geographic proximity. I add the interactive term of social capital and distance into models and test whether the effect of social capital on analyst forecast accuracy varies the analyst geographic proximity.
Hypothesis H3 examines whether a firm’s operation complexity affect the effect of social capital on analyst forecast accuracy. Similar to prior studies, I use the number of
6Since I can only get access to Nelson’s Directory of Investment Research from 2002-2008, I end up a sample with 5,855 observations after eliminating observations with missing data.
23
business segments as a measure of a firm’s operation complexity because the more business segments a firm operates, the more uncertain environment the firm faces, the more technical supports the firm needs, the more stakeholders the firm copes with, and the more difficult it is for managers to make decisions (Markarian and Parbonetti 2007; Barinov, Shawn, and Yildizhan 2016). The number of business segments is obtained from Compustat-Segments. I add the number of business segments and the interactive term of social capital and the number of business segments into equation 2 and test whether the effect of social capital on analyst forecast accuracy is affected by a firm’s operation complexity.
Hypothesis H4 is intended to provide insight into how market participants perceive the effect of social capital the informativeness of on analyst forecasts. To test hypothesis H4, I employ the following ordinary least square (OLS) regression:
𝐼𝑁𝐹𝑂𝑖,𝑡 = 𝛼0+ 𝛼1𝑆𝑜𝑐𝑖𝑎𝑙 𝐶𝑎𝑝𝑖𝑡𝑎𝑙𝑖,𝑡−1+ 𝐹𝑖𝑟𝑚 𝐶ℎ𝑎𝑟𝑎𝑐𝑡𝑒𝑟𝑖𝑠𝑡𝑖𝑐𝑠
+ 𝐴𝑛𝑎𝑙𝑦𝑠𝑡 𝐶ℎ𝑎𝑟𝑎𝑐𝑡𝑒𝑟𝑖𝑠𝑡𝑖𝑐𝑠 + 𝐶𝑜𝑢𝑛𝑡𝑦 𝐶ℎ𝑎𝑟𝑎𝑐𝑡𝑒𝑟𝑖𝑠𝑡𝑖𝑐𝑠
+ 𝐼𝑛𝑑𝑢𝑠𝑡𝑟𝑦 𝐹𝑖𝑥𝑒𝑑 𝐸𝑓𝑓𝑒𝑐𝑡 + 𝑌𝑒𝑎𝑟 𝐹𝑖𝑥𝑒𝑑 𝐸𝑓𝑓𝑒𝑐𝑡 + 𝜀. (3)
Following prior studies (e.g., Asquith, Mikhail, and Au 2004; Frankel, Kothari, and Weber 2006), I calculate INFO as the sum of the absolute market adjusted returns (𝑅𝑚)
on the analyst forecasts revision dates (m) for a firm (i) in a given fiscal year (t), scaled
by the number of analyst forecast revision days for the firm in the fiscal year (𝑁𝑓𝑜𝑟𝑒𝑐𝑎𝑠𝑡𝑠𝑖,𝑚).7 Similar to Frankel, Kothari, and Weber 2006, I delete all analyst
7
Untabulated table show that the results are robust when the market adjusted returns on a single analyst forecast revision date(𝑅𝑚) is replaced as a 3-day market adjusted returns centered at analyst forecast
24
report dates within a 3-day window centered on quarterly and annual earnings announcement dates to avoid contamination by earnings announcement period volatility. INFO is constructed to measure the average informativeness of an analyst report date for a firm.
INFO𝑖,𝑡 =
∑𝑁𝑓𝑜𝑟𝑒𝑐𝑎𝑠𝑡𝑠𝑡=1 |𝑅𝑚| 𝑁𝑓𝑜𝑟𝑒𝑐𝑎𝑠𝑡𝑠𝑖,𝑡
. (4)
If the coefficient on social capital is significantly negative, it indicates that market participants perceive that analyst forecasts for firms headquartered in low social capital counties are more informative, which is consistent with analyst forecasts’ substitutional role for financial reporting quality. In contrast, if the coefficient on social capital is positive, it suggests that investors perceive that analyst forecasts for firms headquartered in high social capital counties are more informative, which is consistent with analyst forecasts’ complementary role for financial reporting quality.
3.3 Sample Selection
I obtain sample data from the Northeast Regional Center for Rural Development (NERCRD), Compustat, SEC’s online EDGAR system, I/B/E/S, CRSP, ISS (formerly RiskMetrics), and Nelson’s Directory of Investment Research for 2002-2008. I first construct the county-level social capital index using the data from NERCRD and the procedures described earlier. Then I match the social capital index to firms’ headquarters through historical zip codes extracted from 10-K filings restored on SEC’s EDGAR system. Since NERCRD survey are only available for 1990-2009 and controls are one
25
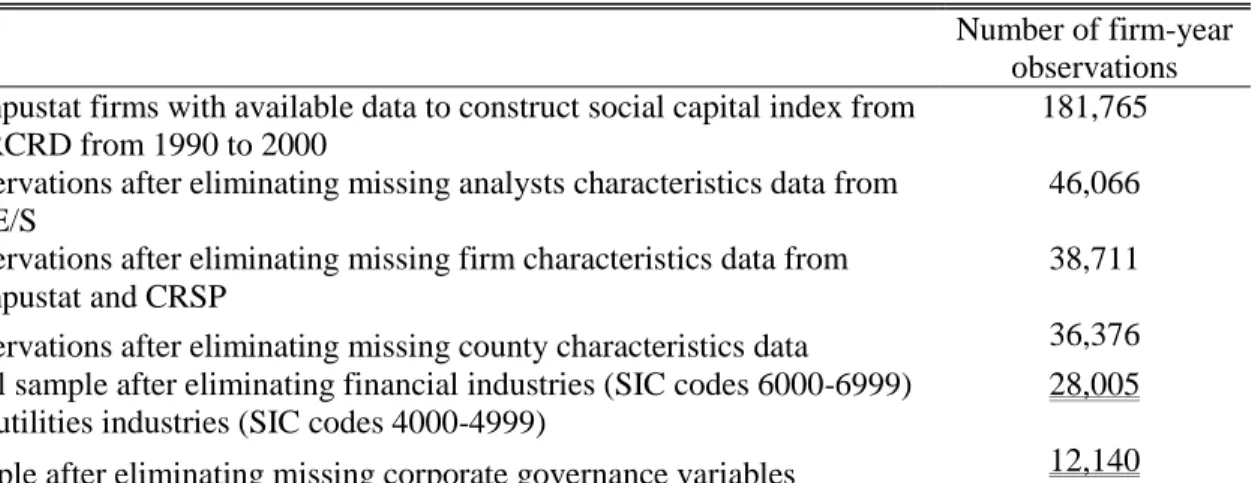
year lagged, my sample spans years 1989 to 2009. All firm-level financial characteristics are obtained from Compustat and CRSP and analyst forecast data is from I/B/E/S. Firms in financial industries (SIC codes 6000-6999) and utilities industries (SIC codes 4000-4999) are excluded because their financial reporting and capital structure are likely to be different from those of other firms. After omitting observations due to missing values, my final sample consists of 28,005 firm-years. Since ISS only provides director characteristics for S&P 1500 firms, the models that include corporate governance variables are estimated using a smaller sample comprised of 12,140 firm-years. Panel A of Table 1 panel shows the sample selection procedure.
3.4 Descriptive Statistics
Panel B of Table 1 presents descriptive statistics (means, standard deviations, and medians) for my sample. To minimize the impact of outliers, I winsorize all continuous variables at the 1st and 99th percentile values. The mean value for social capital is -0.54, which is similar to prior studies (Jha and Chen 2015; Cheng et al. 2016; Li, Tang, and Jaggi 2016). The top three states and territory with highest social capital are North Dakota, South Dakota, and District of Columbia. The three states with lowest social capital are Nevada, Arizona, and Georgia. Average forecast error is 0.06, which is also consistent with prior studies (Hope 2003; Dhaliwal and Radhakrishnan 2012). Informativeness averaged across all firms is 0.05. Firms in the sample have 2.64 segments on average. The average distance between firms and analysts is 1128.63 kilometers. The statistics for all of my measures are similar to those in the prior literature.
26
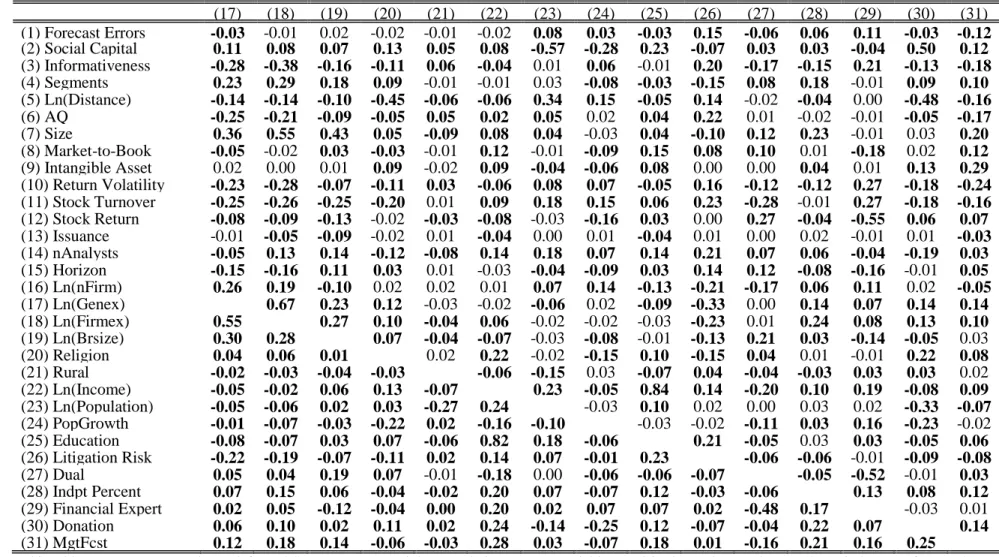
Table 2 reports correlation coefficients for all variables. It shows that county-level social capital is significantly and negatively correlated with analyst forecast error, indicating that a higher county-level social capital is associated with less analyst forecast error (higher analyst forecast accuracy). Informativeness is also significantly and negatively correlated with social capital, suggesting that analyst forecasts are more useful and informative to investor when firms are headquartered in low social capital locales. Most of the correlations are less than 0.4, which is far less than the 0.8 threshold beyond which multicollinearity may be a concern (Gujarati 2003). I also calculate the Variance Inflation Factor (VIF) for variable pairs with a correlation coefficient higher than 0.4 to further detect multicollinearity issues. Untabulated results show that none of the values for VIF is greater than the 10 threshold that would suggest multicollinearity. Pearson and Spearman correlations are similar in magnitudes, indicating that there are no obvious outliers.
[INSERT TABLE 2 HERE]
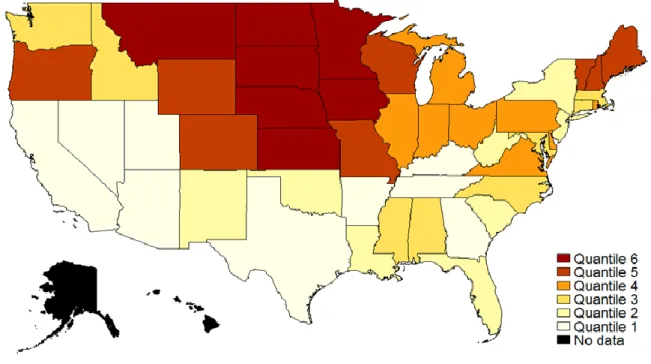
To more vividly and directly demonstrate the relationship between social capital and analyst forecast error and the relationship between social capital and analyst forecast informativeness, I graphically plot the social capital, analyst forecast errors, and analyst forecast informativeness of 2009 for each state in Figure 1a, Figure 1b and Figure 1c, respectively. For brevity, I do not present the figures for other years. In Figure 1a, I take the average value of all county-level social capitals in each state to represent state-level social capital. Then I plot the state-level social capital and show the variations in social
27
capital at the state level.8 A darker color represents a higher social capital. It shows that states in the Midwest and the Northeast have higher social capital than other areas. Social capital does not change much over time. The correlation between the 1990 and the 2009 social capital index is 0.96, which is consistent with the idea that unlike physical and human capital, social capital is “sticky” (Anheier and Gerhards 1995). In Figure 1b, I aggregate the analyst forecast errors to the state level and take the average value to measure the state-level analyst forecast errors. A darker color represents a more accurate analyst forecast (less analyst forecast errors). Firms headquartered in the Midwest and the Northeast have more accurate analyst forecasts. Taking Figure 1a and Figure 1b together, I find that the states with high social capital generally have more accurate analyst forecast. In Figure 1c, I plot the state-level average analyst forecast informativeness. The darker the color, the more informative the analyst forecast. Taking Figure 1a and Figure 1c together, I find that low social capital states generally have more informative analyst forecast, indicating analyst forecast is more useful to investor when social capital is low.
[INSERT Figure 1a, Figure 1b, and Figure 1c HERE]
4 Empirical Results
4.1 Main Results
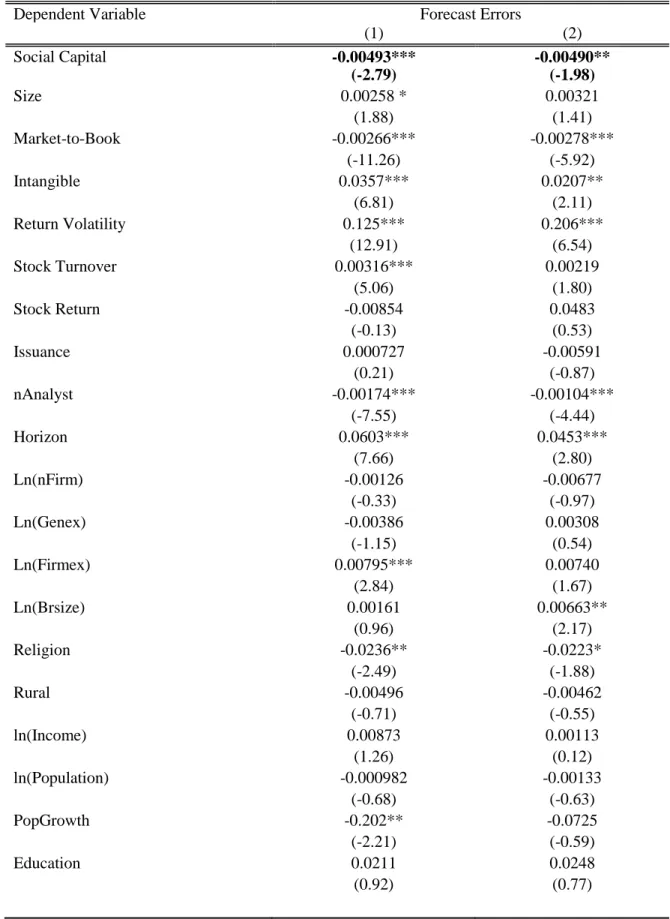
Table 3 presents my tests of H1, the effect of county-level social capital on analyst forecast accuracy. Column 1 presents the result for the main model in equation (1) and Column 2 shows the result for the expanded model, which adds corporate governance
28
controls to the main model. In both columns, the coefficient on Social Capital is negative
and significant at p-value of 0.01 and 0.05 respectively, suggesting that firms headquartered in counties with high social capital have smaller analyst forecast errors, i.e., more accurate analyst forecasts. The coefficient on Social Capital in Column 1 (Column
2) shows that one standard deviation increase in the county-level social capital index reduces the absolute value of analyst earning forecast error by 0.399% (0.397%) of stock price.9 Since the average absolute value of forecast errors of the base price is 6%, 0.399% (0.397%) reduction in forecast error increases the forecast accuracy by 6.656% (6.615%), indicating my results are also economically significant. To mitigate my results are driven by the increased financial reporting and improved disclosure behavior associated with better corporate governance, I control for corporate governance in Column 2. The coefficient on Social Capital is still negative and significant, suggesting that social capital
still exhibits an incremental effect on analyst forecast accuracy.
The results for the firm characteristic control variables show that size, intangible assets, return volatility, and stock turnover are significantly and negatively associated with analyst forecast accuracy. The results suggest that these variables may capture complexity and uncertainty in firm’s operation, making the prediction of future earnings more difficult. Market-to-book ratio is significantly and positively related to analyst forecast accuracy, indicating profitable firms have more accurate analyst forecasts. With regard to analyst characteristics, firms with lower analyst following and longer forecast horizons have larger analyst forecast errors, which is consistent with prior studies (e.g., Lang, Lins, and Miller 2004; Tan, Wang, and Welker 2011). Unlike prior studies, the
9
It is calculated as the estimated coefficient on social capital (-0.00493) times the standard deviation of social capital (0.81).
29
coefficient on firm-specific experience is significant and positive. This may be because analysts with greater firm-specific experience are likely to be capable analysts who have more workload and thus be too busy to perform their task well. Regarding the county-level characteristics, population growth in Column 1 is negatively associated with analyst forecast errors, suggesting that large population leads to denser social connections and, in turn, provides analysts more channels to obtain soft information to help them forecast earnings. The coefficient on Religion is negative and significant, indicating that my
results are robust to religious effect. The other control variables are not statistically significant. Overall, these results provide evidence that social capital can increase analyst forecast accuracy after controlling for firm, analyst, and county characteristics.
[INSERT TABLE 3 HERE]
4.2 Cross-Sectional Tests
Table 4 presents the results of H2, the effect of geographic proximity on the association between social capital and analyst forecast accuracy. Column 1 and Column 2 show the effect of county-level social capital on analyst forecast accuracy conditional on average physical distance between firms and their analyst brokerage firms. Column 1 (Column 2) are based on the main model (model with corporate governance controls). In Column 2, coefficient on social capital is still negative and significant at p-value of 0.1. In Column 1, Log (Distance) is positively and significantly associated with analyst forecast errors, consistent with prior studies that geographically proximate analysts are more accurate than other analysts (Malloy 2005; Bae et al. 2008). In both Column 1 (Column 2), the coefficient on the interactive term of county-level social capital with
30
logarithm of distance (Social Capital✕Log(Distance) is 0.0305 (0.0237) and statistically
significant at the 10% (5%) level. These results provides evidence that the effect of county-level social capital on analyst forecast accuracy is less pronounced when analyst brokerage firms are far away from the firm headquarters, indicating that when analyst brokerage firms are far away from the firms, it is harder for analysts to collect information through social connections with local people. As a result, the effect of social capital on analyst forecast accuracy diminishes with the distance between analyst brokerage firms and their following firms.10
[INSERT TABLE 4 HERE]
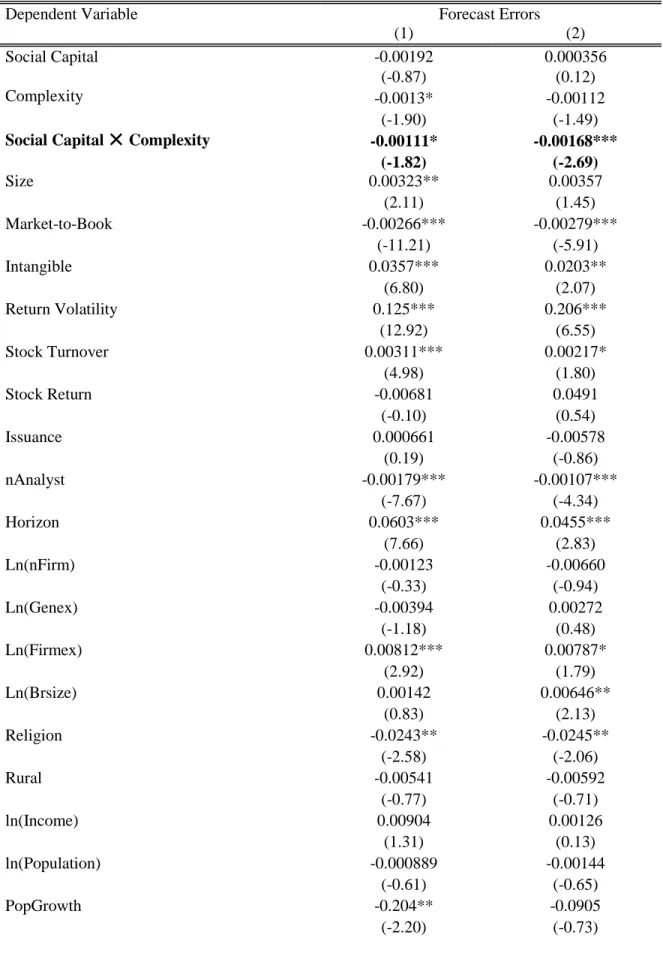
Table 5 presents the results of H3, the effect of firm operation complexity on the association between social capital and analyst forecast accuracy. The firm’s operation complexity is negatively and significantly related to analyst forecast errors. Guay, Samuels, and Taylor (2016) shows that managers issue more voluntary disclosure to mitigate information asymmetry when information is complicated. If so, analysts may have better information resources and can more accurately forecast earnings. The number of the business segments is used as the proxy for operation complexity. For both the main model (Column1) and model controlling for corporate governance (Column 2), I find that
10 In an untabulated test, I use a dummy variable (Close )as a proxy for geographic proximity. It is defined
as one when the average physical distance between a firm and its analyst brokerage firms is smaller than 100 miles, otherwise zero. It shows that the coefficient on the interaction (Social Capital✕Close) is significantly and negatively associated with forecast errors, indicating that the effect of social capital on analyst forecast is more pronounced when the distance is small. This result is also consistent with these presented in table 4.
31
coefficient on Social Capital ✕ Segments is negative and statistically significant.11 In
Column 1(Column 2), the coefficient is -0.00111 (-0.00168) and statistically significant at the 10% (5%) level, indicating that the effect of county-level social capital is more pronounced when firm’s operation is complex. These results support the argument that social capital facilitates analyst information collection and makes managers less likely to use complexity as a cover to manipulate earnings.
[INSERT TABLE 5 HERE]
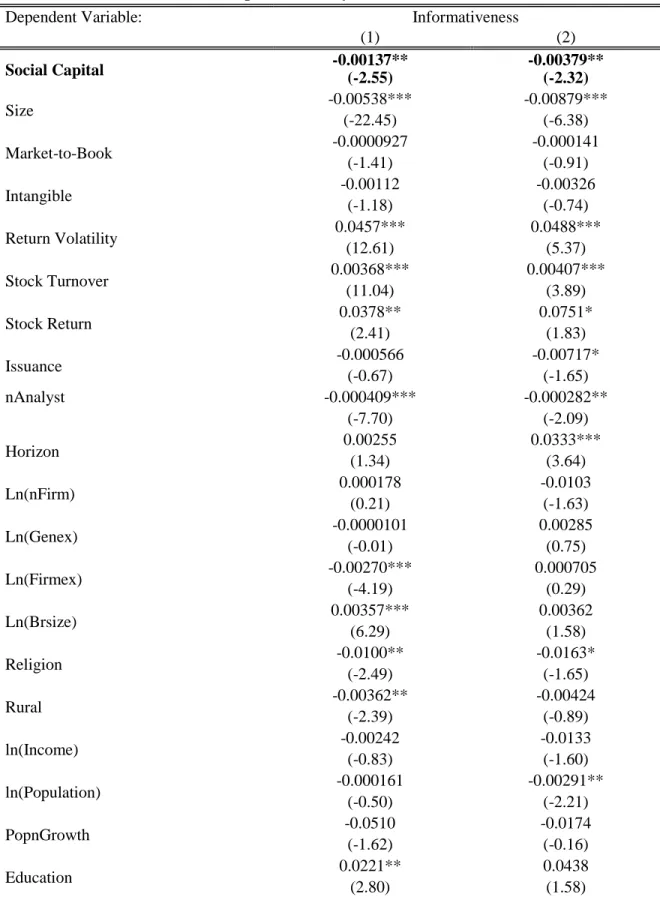
4.3 Test of Analyst Forecast Informativeness
Table 6 examines the results of H4, the effect of social capital on analyst forecast informativeness. Column 1 (Column 2) are based on the main model (model with corporate governance controls). It shows that social capital is negatively and significantly associated with informativeness, suggesting that investors respond to analyst forecasts and this response decreases with social capital. The coefficient on Social Capital in
Column 1 (Column 2) shows that one standard deviation increase in the county-level social capital index reduces the analyst forecast informativeness by 0.111% (0.307%). These results are consistent with the argument that analyst forecasts serve a substitutional role for financial reporting quality.
These results suggests that analyst forecasts in low social capital county is less accurate but more informative to investors. This is because managers in the low social
11 Untabulated tables show that the results are robust to the measure in Markarian and Parbonetti (2007),
where they use the number of business segments multiplied by the number of geographic segments to measure a firm’s complexity.
32
capital county are more likely to manipulate earnings, but analyst can correct perceived earnings management and bring the forecasts closer to unmanaged earnings. Therefore, although analyst forecasts are less accurate, they are still valuable to investors, indicating that analyst forecasts are viewed as an alternative resource to verify managers’ credibility.
[INSERT TABLE 6 HERE]
5 Robustness
5.1 Headquarters Relocation Shock
Following Cheng et al. (2016), I employ firms’ headquarters relocations to better explore the causality. I extract firms’ historical zip code from their 10-K filings downloaded from SEC’s EDGAR system through textual analysis. The first year with a different zip code from the previous year is identified as the year when a firm moves its headquarters. I divide the sample into firms who relocate to counties with higher social capital and those who relocate to counties with lower social capital. Then I estimate the following model separately for these two groups to exam the effect of social capital on analyst forecast error and analyst forecast informativeness when a firm relocates the headquarter.
33 𝐹𝐸𝑅𝑅𝑂𝑅𝑖,𝑡(𝐼𝑛𝑓𝑜𝑟𝑚𝑎𝑡𝑖𝑣𝑒𝑛𝑒𝑠𝑠𝑖,𝑡) = 𝛼0+ 𝛼1𝑃𝑜𝑠𝑡 + 𝐹𝑖𝑟𝑚 𝐶ℎ𝑎𝑟𝑎𝑐𝑡𝑒𝑟𝑖𝑠𝑡𝑖𝑐𝑠 + 𝐴𝑛𝑎𝑙𝑦𝑠𝑡 𝐶ℎ𝑎𝑟𝑎𝑐𝑡𝑒𝑟𝑖𝑠𝑡𝑖𝑐𝑠 + 𝐶𝑜𝑢𝑛𝑡𝑦 𝐶ℎ𝑎𝑟𝑎𝑐𝑡𝑒𝑟𝑖𝑠𝑡𝑖𝑐𝑠 + 𝐼𝑛𝑑𝑢𝑠𝑡𝑟𝑦 𝐹𝑖𝑥𝑒𝑑 𝐸𝑓𝑓𝑒𝑐𝑡 +𝑌𝑒𝑎𝑟 𝐹𝑖𝑥𝑒𝑑 𝐸𝑓𝑓𝑒𝑐𝑡 + 𝜀. (5)
where post is an indicator variable that is equal to one if it is two years after the firm relocates its headquarter and zero otherwise.
Table 7 presents the results of the effect of social capital on analyst forecast accuracy and informativeness for a five year window centered at firms’ headquarters relocation.12 Column 1(Column 3) shows that the coefficient on Post is statistically
significant and negative for firms moving to counties with better social capital. This indicates that analyst forecast errors (informativeness) decrease when a firm relocates to a higher social capital county. In contrast, Column 2 (Column 4) shows that the coefficient on Post is significant and positive for firms moving to counties with lower social capital.
This suggests that analyst forecast errors (informativeness) increase when a firm relocates to a lower social capital county. These results further provide causal evidence that increases in social capital results in a decrease in analyst forecast errors and informativeness and vice versa.
[INSERT TABLE 7 HERE]
12
I use a five-year window instead of a three-year window because it takes time for the firms to adjust their culture to align with culture in new counties.