Student Performance Prediction Model Based on
Discriminative Feature Selection
https://doi.org/10.3991/ijet.v13i10.9451 Haixia Lu(*), Jinsong Yuan
Shijiazhuang Preschool Teachers College, Shijiazhuang, China
Abstract—It is a hot issue to be widely studied to determine the factors af-fecting students' performance from the perspective of data mining. In order to find the key factors that significantly affect students' performance from complex data, this paper proposes an integrated Optimized Ensemble Feature Selection Algorithm by Density Peaks (DPEFS). This algorithm is applied to the education data collected by two high schools in China, and the selected discriminative fea-tures are used to construct a student performance prediction model based on sup-port vector machine (SVM). The results of the 10-fold cross-validation experi-ment show that, compared with various feature selection algorithms such as mRMR, Relief, SVM-RFE and AVC, the SVM student performance prediction model based on the feature selection algorithm proposed in this paper has better prediction performance. In addition, some factors and rules affecting student per-formance can be extracted from the discriminative features selected by the feature selection algorithm in this paper, which provides a methodological and technical reference for teachers, education management staffs and schools to predict and analyze the students’ performances.
Keywords—data mining; feature selection; support vector machine (SVM); student performance prediction model
1
Introduction
With the rapid development of modern technology, the application of a large number of new computers, cloud computing and Internet of Things has allowed large amounts of data to be accumulated and preserved, such as videos, photos, texts, voices and data obtained from social relationships. Data mining is the process of mining interesting patterns and knowledge from large amounts of data [1]. Big data contains huge knowledge values, and data mining methods can be used to mine information with po-tential values from massive amounts of data and extract effective knowledge and pat-terns from it. In recent years, our country has paid more attention to education. Educa-tion informaEduca-tion platforms have developed rapidly, the availability of educaEduca-tion data has increased rapidly, and the types of data are complex and diverse. How to extract the implicit and useful education management model from the education data, and pro-vide methodological and technical references for teachers, education management
staffs and schools to predict and analyze the students’ performances is a difficult prob-lem to be solved by data science researchers.
Feature selection method is a necessary link in data mining and machine learning, it is widely used in the classification analysis of text data, image and video data and bio-omics data, and plays an important role in the construction of highly sensitive classifi-cation system [2, 3]. According to whether the feature selection process is independent of subsequent models to train the learning process, the feature selection algorithms can be divided into two categories: Filter and Wrapper. The Filter method [4] is independent of the subsequent models to train the learning process, and selects the best feature sub-set according to the specific feature importance evaluation criteria, and the selection process of the Wrapper method [5] depends on the specific classification model, gen-erally, it selects the discriminative features that are better than the Filter method and have fewer numbers. Formally speaking, feature selection is a high-dimensional data dimension reduction method. The selected feature is a subset of the original features, with clear physical meaning and explanations, it can effectively eliminate redundant features unrelated to the data classification task, retain a small number of key features, improve the accuracy of data classification while reducing the complexity of subse-quent computational tasks, and thus have attracted the attention of many researchers.
Education data mining is one of the hotspots of current data mining and machine learning technology research. Kotsiantis et al. [6] used the feature selection algorithm of information gain to determine the attributes related to student performance, and bas-ing on this, they had established the Naive Bayes performance prediction model. The study found that the Naive Bayes model can be used to predict the performance of stu-dents with satisfactory accuracy before the final exam. Hijazi and Naqvi [7] conducted a linear regression analysis of the education data of 300 students (225 males, 75 fe-males) and found that factors such as “mother's educational level” and “student's family income” will have influence on the student’s study performance. Bhardwaj and Pal [8] used the Naive Bayes classification method to model and analyze the education data of 300 students from five universities, and found that factors of “high school students’ test scores”, “living place”, “teaching media”, “mother's educational level” and “yearly family income” are highly correlated with the student’s performance. Chen Zijian et al. [9] used the integrated learning idea to establish a learning performance prediction model for the e-Learning academic achievement data of Jordan University, and per-formed nested integration on the built Naive Bayes network, decision tree, artificial neural network and support vector machine SVM model, providing references for per-formance influencing factors and perper-formance prediction analysis of online learners. Al-Shehri et al. [10] used two models, the K-nearest neighbor model and the SVM prediction model to estimate the students’ mathematics scores in the final exam. The results showed that the prediction model constructed by SVM had better performance than the K-nearest neighbor model. All the above studies have carried out mining anal-ysis of student education data in the hopes of screening out the key factors affecting students' performance and carrying out modelling and prediction analysis. However, most of the research only models and analyzes the data using machine learning algo-rithms, but does not consider the impact of redundant and irrelevant features in the data on the performance of the classification prediction model. In some studies, although the
feature selection algorithm is considered to propose the influence of irrelevant features on the model, the adopted feature selection algorithm cannot identify the redundant features in the data, that is, the influence of partial redundancy factors in the data on the performance of the prediction model is ignored.
In order to find the key factors that significantly affect students' performances from complex education data, this paper takes the education data related to the mathematics scores of some students in the second grade of two high schools in China as the research object, and proposes an integrated DPEFS. Basing on this, it establishes a performance prediction analysis model based on SVM [11]. Compared with mRMR [12], LLEScore [13], algorithms that are suitable for binary-class problems such as SVM-RFE [14], Relief [15], ARCO [16], AVC [17], algorithms that are suitable for multi-class prob-lems such as MSVM-RFE [18], ReliefF [19], MUACD [20], MAVC, and other feature selection algorithms, the DPEFS-based algorithm has better performance in the student performance prediction model. At the same time, it can also screen out the key factors affecting students' performance and some interesting student performance associated rules, allowing students to recognize their shortcomings, improving their own learning methods, making teachers get to know their students better so as to teach accordingly; the SVM student performance prediction model constructed by these key factors can provide methodological and technical support for the prediction and analysis of student performance for teachers, education management staffs and schools, so that schools can strengthen their education and teaching management in a more targeted manner and continuously improve the quality of education and teaching.
2
DPEFS feature selection algorithm
The essence of feature selection is to select some features from the original features to form a feature subset, which makes a certain criterion reach the optimal. Therefore, from the perspective of combinatorial optimization, feature selection is an NP problem. Guyou pointed out through research that the ideal feature subset is not only highly cor-related with the class label, but also has low redundancy. The DPEFS feature selection algorithm proposed in this paper first uses the Pearson correlation coefficient and Eu-clidean distance to measure the correlation between features and class label and the redundancy between features, and then integrates the feature subsets obtained multiple times to get the final optimal feature subset. The DPEFS algorithm considers the cor-relation between features and class label and the redundancy between features at the same time and integrates multiple feature subsets to ensure that the selected features have rich category information and the redundancy is as small as possible. The perfor-mance prediction model established by the feature subset has the best classification prediction performance.
For ease of description, the training data sample set is represented in the form of a data matrix. Set there are m samples in the sample set, the data matrix consisting of samples with n dimensional features can be recorded as D= {X1; X2; …; Xm}ÎRm×n, where each row represents a sample, each column represents a feature (attribute); the class label Y={y1;y2;…;ym}; fi represents the i-th feature of the data set D. The goal of
feature selection is to select the most important k features from the original n features according to a certain feature importance criterion, and the redundancy between the k features is minimal and contains almost all the information of the original feature set. 2.1 Feature relevance and redundancy
Definition 1 Feature relevance: The relevance Reli between a feature fi and a class
label Y is measured using the absolute value of the Pearson correlation coefficient. The calculation method is shown as formula (1).
(1)
Where, xji is the i-th eigenvalue of the j-th sample and 𝑥𝑥$$$∙# is the mean of the i-th
feature. yi and 𝑌𝑌$ represent the class label value of the j-th sample and the mean of the
entire training data set class label, respectively.
It can be known from definition 1 that the greater the relevance measure Reli of the
feature fi, the higher the relevance between the feature and the class label Y, and the
greater the class discrimination ability of the feature fi, that is, the more important the
feature.
Definition 2 Feature redundancy: The redundancy Redi of feature fi is defined as the
Euclidean distance between features, and its calculation formula is shown as formula (2).
(2)
Where, dit represents the Euclidean distance between the i-th feature and the t-th
feature, as shown in formula (3).
(3) It can be seen from formula (2) that the redundancy Reli of feature fi is expressed as
the Euclidean distance between fi and the nearest feature ft whose feature relevance is
greater than fi. The greater the distance, the less redundant the feature is. In particular,
if a feature fi has a global maximum relevance, its feature redundancy is defined as the
largest Euclidean distance from other features, as shown in formula (4).
(4)
(
)(
)
(
) (
)
1 2 2 1 1 m ji i j j i m m ji i j j j x x y Y Rel x x y Y = = = - -= --å
å
å
! !( )
(
)
:mint i , if max i t Rel Rel it i t tRed = d Rel ¹ Rel
!
(
)
1 m it ji jt j d x x = =å
-( )
(
)
max , if max i t it i t tIt can be seen from definition 1 feature relevance and definition 2 redundancy that the stronger the class discrimination ability of the feature fi, the larger the Pearson
rel-evance Reli; the greater the distance Redi between feature fi and other features, the
smaller the redundancy. Therefore, the larger feature between the Pearson relevance Reli and the Euclidean distance Redi is selected as the final feature subset, which is the
original meaning of feature selection.
2.2 Feature score
From the above analysis, the optimal feature subset we selected is not only highly correlated with the class label, but also has less redundancy between features. There-fore, we define the product of definition 1 the feature relevance and definition 2 the feature redundancy as the definition of the importance of feature, the Score.
Definition 3 Feature score: The importance of a feature, the Scorei, is defined as the
product of feature relevance and feature redundancy, as shown in formula (5).
(5) 2.3 Feature subset integration method
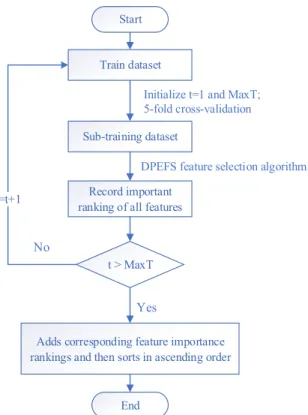
Fig. 1. Flow chart of the feature subset integration method in this paper
i i i
Score Rel Red
=
´
Start Train dataset
t > MaxT Sub-training dataset
Initialize t=1 and MaxT; 5-fold cross-validation
Record important ranking of all features
DPEFS feature selection algorithm
t=t+1
Yes No
Adds corresponding feature importance rankings and then sorts in ascending order
In order to obtain feature subsets with good classification performance and high sta-bility, this paper uses the integrated method idea to integrate the feature subset which is obtained by multiple times. The specific idea is: each time the dataset is divided into training set and test set, basing on this, perform 5-fold random division on the training dataset samples, take 4 folds as the sub-training set to perform DPEFS feature selection algorithm, record the score ranking of all current features, and the most important fea-ture is ranked as 1. The process is repeated multiple times, and then the corresponding score ranking of each feature is added and sorted in ascending order. The higher the ranking of the feature is, the higher the importance is, that is, the feature of smaller ranking number sum is highly related to the class label and the redundancy is smaller. The specific feature subset integration method in this section is shown in Figure 1. 2.4 Algorithm description
The DPEFS feature selection algorithm first uses the relevance between the Pearson correlation coefficient and the class label to measure the feature relevance, and uses the Euclidean distance to measure the redundancy between the features, and then the prod-uct of the two is used as the evaluation criterion of the final feature score. At the same time, in order to obtain feature subsets with good classification performance and high stability, the integrated feature method is used to integrate the feature subsets obtained multiple times to get the final optimal feature subset. The detailed steps of the DPEFS feature selection algorithm proposed in this paper are as follows.
Input: training data set D (m*n, m is the number of samples, n is the number of features), Y is the class label, and the maximum number of iterations is MaxT
Output: optimal feature subset S BEGIN
Initialize all feature sets as F, temporary feature subset S’=Ø, and the final selected feature subset S=Ø;
The training dataset is divided into 5 folds by 5-fold cross-validation method, and 4 folds are selected as sub-training set;
FOR t = 1 to MaxT DO BEGIN
FOR i = 1 to n DO BEGIN
Calculate the relevance Reli and the redundancy Redi of each feature on the
sub-training set according to formula (1), (2) or (4), respectively;
Calculate the importance Scorei of each feature according to formula (5);
END of FOR
Record the importance ranking of all current features and save to S’, the most im-portant feature ranking number is 1;
END of FOR
Add the corresponding MaxT-th importance rankings for each feature obtained by iteration and sort in ascending order, and the first k features are selected to form the final selected feature subset S;
3
Experimental data and methods
3.1 Data information
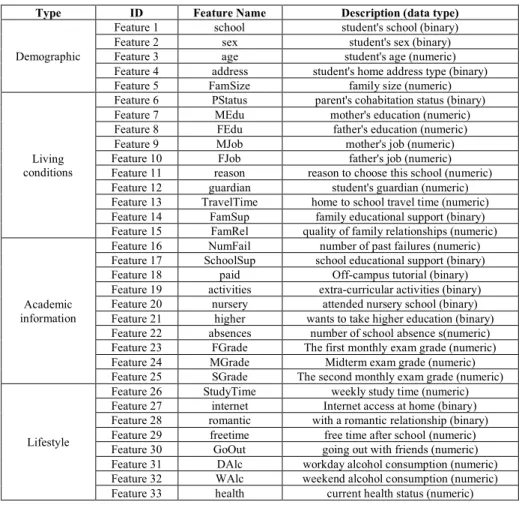
We randomly selected 1,296 students from all the students in the second grade of 2016 in two high schools in China, including 771 students from high school A and 525 students from high school B. The collected student education data includes 4 types of demographics, living conditions, academic information and lifestyle data. The specific information contained in each type is shown in Table 1.
Table 1. Student education data description
Type ID Feature Name Description (data type)
Demographic
Feature 1 school student's school (binary)
Feature 2 sex student's sex (binary)
Feature 3 age student's age (numeric)
Feature 4 address student's home address type (binary)
Feature 5 FamSize family size (numeric)
Living conditions
Feature 6 PStatus parent's cohabitation status (binary)
Feature 7 MEdu mother's education (numeric)
Feature 8 FEdu father's education (numeric)
Feature 9 MJob mother's job (numeric)
Feature 10 FJob father's job (numeric)
Feature 11 reason reason to choose this school (numeric)
Feature 12 guardian student's guardian (numeric)
Feature 13 TravelTime home to school travel time (numeric)
Feature 14 FamSup family educational support (binary)
Feature 15 FamRel quality of family relationships (numeric)
Academic information
Feature 16 NumFail number of past failures (numeric)
Feature 17 SchoolSup school educational support (binary)
Feature 18 paid Off-campus tutorial (binary)
Feature 19 activities extra-curricular activities (binary)
Feature 20 nursery attended nursery school (binary)
Feature 21 higher wants to take higher education (binary)
Feature 22 absences number of school absence s(numeric)
Feature 23 FGrade The first monthly exam grade (numeric)
Feature 24 MGrade Midterm exam grade (numeric)
Feature 25 SGrade The second monthly exam grade (numeric)
Lifestyle
Feature 26 StudyTime weekly study time (numeric)
Feature 27 internet Internet access at home (binary)
Feature 28 romantic with a romantic relationship (binary)
Feature 29 freetime free time after school (numeric)
Feature 30 GoOut going out with friends (numeric)
Feature 31 DAlc workday alcohol consumption (numeric)
Feature 32 WAlc weekend alcohol consumption (numeric)
Feature 33 health current health status (numeric)
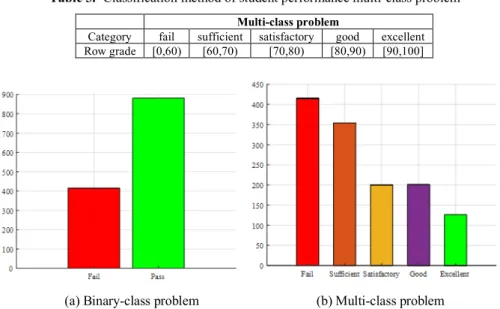
In order to study the influence of various factors on the students' final mathematics scores and construct the student performance prediction model, we model the binary-class problems and the multi-binary-class problems based on the feature selection algorithm proposed in this paper. For the binary-class problem, we divide the final mathematics scores of 1,296 students in the two high schools into fail and pass, two categories, to
construct the binary-class performance prediction model; for the multi-class problem, we divide the final mathematics scores into five categories of fail, sufficient, satisfac-tory, good and excellent to construct the performance prediction model. The specific binary-class and multi-class problem division methods are shown in Table 2 and Table 3. The statistics of the number of people in each category under the binary-class prob-lem and the multi-class probprob-lem are shown in Figure 2(a) and Figure 2(b).
Table 2. Classification method of student performance binary-class problem
Binary-class problem
Category fail pass
Row grade [0,60) [60,100]
Table 3. Classification method of student performance multi-class problem
Multi-class problem
Category fail sufficient satisfactory good excellent
Row grade [0,60) [60,70) [70,80) [80,90) [90,100]
(a) Binary-class problem (b) Multi-class problem
Fig. 2. Statistics of the number of people in each category under binary-class problem and multi-class problem
3.2 Data preprocessing
In the experiment, for the features of the binary type, ‘1’ and ‘2’ are used for mark-ing. For instance, for the gender feature, male marks as '1' and female marks as ‘2’. For features of the numeric type, such as the feature of ‘mother's education’, no education at all is marked as '1', primary school education level is marked as '2', middle school education level is marked as '3', high school education level is marked as '4', college education level is marked as '5'. For categories under the binary-class problem, fail is marked as '1' and pass is marked as '2'; for multi-class problems, fail, sufficient, satis-factory, good, and excellent are marked as '1', '2', '3 ', '4' and '5'. respectively.
In addition, in order to avoid the influence of different features of the data set on the experiment, we standardized the data set using the maximum and minimization method.
The standardized calculation method is shown as formula (6). In which, xjirepresents
the value of the j-th feature of the i-th observed sample, max (𝑥𝑥∙+) and min (𝑥𝑥∙+) are the maximum and minimum values of the i-th feature on all observed samples, respectively.
(6)
3.3 Student performance model construction method and model evaluation
criteria
The data features, model kernel function selection and its parameters that the perfor-mance prediction model relies on have a crucial impact on the perforperfor-mance of the model. In this paper, the DPEFS feature selection algorithm can select feature subsets that are highly correlated with the class label and have low redundancy between fea-tures, which lays a foundation for establishing a high-performance student performance prediction model based on SVM. In addition, the number of education data samples collected in this paper is much larger than the feature dimension, so the RBF kernel function is selected and the penalty factor C and kernel function parameter γare opti-mized by the grid search method [21]. The specific steps of the grid search method used in this section are as follows:
Step1: Set the search space of parameter C and γ as log2CÎ{-5, -4,…,15} and log2γÎ{-15,-14,…,8}, and the search steps are all 1;
Step 2: For each group of parameters (C, γ), perform a 10-fold cross-validation ex-periment on the training set;
Step3: Select the parameter group (C, γ) with the highest accuracy in the 10-fold cross-validation as the best parameter group;
Step4: Construct the SVM prediction model in the training set using the best param-eter group (C, γ).
The complete steps of construction of SVM-based student performance prediction model are as follows: First, the data set is divided into training set and test set by 10-fold cross-validation method; then the DPEFS feature selection algorithm proposed in this paper is run on the training set to obtain a training set that only contains the optimal subset of features; at last, the optimal parameters of the SVM model based on the train-ing set are obtained by grid search method and the final student performance prediction model is constructed.
After the SVM-based student performance prediction model is established, we also need to verify the test set divided by the 10-fold cross-validation method. This paper uses the mean accuracy of the test set to evaluate the performance of the model.
4
Experimental results and analysis
This section uses the feature selection algorithms mRMR, LLEScore and SVM-RFE, Relief, ARCO, AVC for binary-class problems, and MSVM-RFE, ReliefF, MUACD,
min( )
'
max( ) min( )
ji i ji i i xx
x
=
x
-
x
-
! ! !MAVC for multi-class problems as comparison algorithms to verify the performance of the SVM student performance prediction model based on the DPEFS feature selec-tion algorithm proposed in this paper, and it attempts to analyze the associaselec-tion rules between the attributes included in the model based on each feature selection algorithm when achieving optimal performance, so as to further analyze the impact of these at-tributes on student performance, providing methodological and technical support for teachers and schools to predict and analyze the students’ performances. In the experi-ment, in order to obtain more statistically significant results, we run the 10-fold cross-validation experiment for 5 times and evaluate the performance of SVM model based on the selected subset of features of each algorithm with a mean accuracy of 5*10=50 times.
(a) Binary-class problems
(b) Multi-class problems
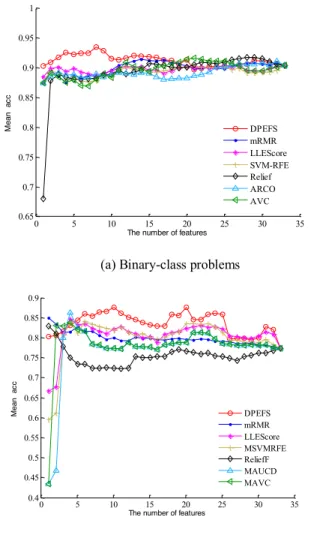
Fig. 3. Variation curve of the 7-feature selection algorithm-based SVM model with the feature subset size 0 5 10 15 20 25 30 35 0.65 0.7 0.75 0.8 0.85 0.9 0.95 1
The number of features
M ean ac c DPEFS mRMR LLEScore SVM-RFE Relief ARCO AVC 0 5 10 15 20 25 30 35 0.4 0.45 0.5 0.55 0.6 0.65 0.7 0.75 0.8 0.85 0.9
The number of features
M ean ac c DPEFS mRMR LLEScore MSVMRFE ReliefF MAUCD MAVC
Figure 3 shows the classification prediction performance of the SVM student per-formance prediction models on different feature subset sizes, the models are con-structed based on the feature selection algorithm DPEFS proposed by this paper and several other comparison algorithms, Figure 3(a) and Figure 3(b) are the performance of the model on binary-class problems and multi-class problems, respectively. It can be seen from Figure 3 that the SVM performance prediction model based on the DPEFS feature selection algorithm is optimal in both binary-class data and multi-class data, and is far superior to the performance of the SVM model established using all features. Figure 3(a) reveals that the SVM model based on the DPEFS algorithm is optimal when the feature subset size is small, and when the feature subset size is 8, the performance of the SVM model reaches the global optimal, and the mean classification accuracy is 93.5% at this time. As the feature subset size increases, due to the addition of some redundant features and unrelated features, the performance of the model becomes worse, not as good as the AVC algorithm and the Relief algorithm. At last, when the feature subset size is the complete set, the performance of the classification model es-tablished using all the seven features is 90.48%.
It can be seen from the SVM performance prediction model established on the multi-class dataset based on the seven feature selection algorithms in Figure 3(b) that, when the feature subset size is only 1, the SVM model based on the comparison algorithm mRMR achieves an excellent performance of 85%, while the performance of the DPEFS algorithm proposed by this paper is only about 80%. However, with the addi-tion of some features that are highly related to the class label, the performance of the model based on the DPEFS algorithm increases steadily and achieves a global optimal performance of 87.6% when the feature subset size is 10.
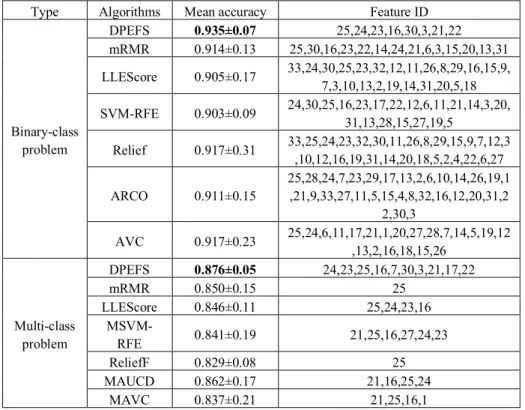
Table 4 shows the global maximum mean accuracy and its corresponding feature subset number of the SVM student performance prediction model based on each feature selection algorithm in the binary-class data and the multi-class data. The performance of the DPEFS-based performance prediction model achieved global optimal both in binary-class data and multi-class data. From the feature subset corresponding to each model in obtaining the optimal performance, the performance prediction model based on the DPEFS algorithm in the binary-class data depends on the least number of fea-tures, indicating that the DPEFS algorithm can screen out the subset of features that is highly correlated with the final mathematics scores of students in the two high schools and has a low redundancy, its selected features are 'Feature 25: SGrade', 'Feature 24: MGrade', 'Feature 23: FGrade', 'Feature 16: NumFail', 'Feature 30 :GoOut', 'Feature 3:age', 'Feature 21:higher', and 'Feature 22:absences'; the model relies on the largest number of features in the multi-class data, besides the 8 features included in the binary-class data, there are two more factors of 'Feature 7: MEdu' and 'Feature 17: SchoolSup', indicating that the factors affecting students' mathematics scores at the end of the se-mester are complicated, and it is not only influenced by the individual academic infor-mation factors of the students.
Generally speaking, the final mathematics scores of students in the two high schools are closely related to the individual academic information factors of the students, such as the results of two monthly and mid-term exams, the number of school absences, and how much the students wants to take higher education, it also related to the school’s
Table 4. Maximum mean accuracy of SVM models established by different feature selection algorithms and their corresponding feature subset numbers
Type Algorithms Mean accuracy Feature ID
Binary-class problem DPEFS 0.935±0.07 25,24,23,16,30,3,21,22 mRMR 0.914±0.13 25,30,16,23,22,14,24,21,6,3,15,20,13,31 LLEScore 0.905±0.17 33,24,30,25,23,32,12,11,26,8,29,16,15,9,7,3,10,13,2,19,14,31,20,5,18 SVM-RFE 0.903±0.09 24,30,25,16,23,17,22,12,6,11,21,14,3,20,31,13,28,15,27,19,5 Relief 0.917±0.31 33,25,24,23,32,30,11,26,8,29,15,9,7,12,3,10,12,16,19,31,14,20,18,5,2,4,22,6,27 ARCO 0.911±0.15 25,28,24,7,23,29,17,13,2,6,10,14,26,19,1,21,9,33,27,11,5,15,4,8,32,16,12,20,31,2 2,30,3 AVC 0.917±0.23 25,24,6,11,17,21,1,20,27,28,7,14,5,19,12,13,2,16,18,15,26 Multi-class problem DPEFS 0.876±0.05 24,23,25,16,7,30,3,21,17,22 mRMR 0.850±0.15 25 LLEScore 0.846±0.11 25,24,23,16 MSVM-RFE 0.841±0.19 21,25,16,27,24,23 ReliefF 0.829±0.08 25 MAUCD 0.862±0.17 21,16,25,24 MAVC 0.837±0.21 21,25,16,1
educational support and the number of the individual’s past failures. In addition, the age of the student, the mother's educational level, and the number of times to date with friends will also affect the student's final mathematics score. Among them, the mother's educational level is a key factor affecting student performance has been reported in many articles. The possible reason is that during the growth of the student, the mother’s companionship and education for the child is more than the father’s, and the mother’s attention of the child’s education is more delicate.
5
Conclusion
In order to find out the key factors affecting students' test scores from the data of the second-grade high school students in two high schools in China and construct a student performance prediction model, this paper proposes a feature selection algorithm DPEFS based on the idea of integration. Basing on the selected optimal feature subset, a SVM-based student performance prediction model is constructed. The experimental results show that the performance of the SVM student performance prediction model based on the feature selection algorithm proposed in this paper is better than the SVM student performance prediction model based on other algorithms, both in the
binary-class data and in the multi-binary-class data. In addition, from the features selected by the DPEFS algorithm, we also found the academic information of the second-grade stu-dents of the two high schools, such as the two monthly and mid-term test scores, the number of school absences, wants to take higher education, school’s educational sup-port, and the number of past failures, have the greatest impact on the students’ final mathematics scores. Moreover, the age of the student, the mother's educational level, and the number of times to date with friends are also key factors influencing student performance. The work done in this paper can help students to recognize their short-comings, improve their own learning methods, let teachers know more about their stu-dents, teach students in accordance with their aptitude, and provide methodological and technical support for teachers, education management staffs and schools to predict and analyze the students’ performances.
6
References
[1]Han, J., Kamber, M., Pei, J. (2011). Data mining: concepts and techniques: concepts and techniques. City: Elsevier, 2011.
[2]Shah, M., Marchand, M., Corbeil, J. (2012). Feature Selection with Conjunctions of Deci-sion Stumps and Learning from Microarray Data. IEEE Trans Pattern Anal Mach Intell, 34(1): 174-186. https://doi.org/10.1109/TPAMI.2011.82
[3]Cai, J., Luo, J., Wang, S. (2018). Feature selection in machine learning: A new perspective. Neurocomputing, 300: 70-79. https://doi.org/10.1016/j.neucom.2017.11.077
[4]Blum, A.L., Langley, P. (1997). Selection of relevant features and examples in machine learning. Artificial Intelligence, 97(1): 245-271. https://doi.org/10.1016/S0004-3702 (97)00063-5
[5]Kohavi, R., John, G.H. (1997). Wrappers for feature subset selection. Artificial Intelligence, 97(1): 273-324. https://doi.org/10.1016/S0004-3702(97)00043-X
[6]Kotsiantis, S., Pierrakeas, C., Pintelas, P. (2002). Efficiency of machine learning techniques in predicting students' performance in distance learning systems. Educational Software De-velopment Laboratory Department of Mathematics, University of Patras, Greece, 2002. [7]Hijazi, S., Naqvi, S. (2006). Factors Affecting Students Performnce. A case of Private
Col-leges, Bangladesh. Journal of sociology, 3(1): 12-17.
[8]Bhardwaj, B.K., Pal, S. (2012). Data Mining: A prediction for performance improvement using classification. arXiv preprint arXiv:12013418, 2012.
[9]Chen, Z., Zhu, X. (2017). Research on prediction model of online learners' academic achievement based oneducational data mining. Distance Education and Online Learning, 12: 011.
[10]Al-Shehri, H., Al-Qarni, A., Al-Saati, L. (2017). Student performance prediction using Sup-port Vector Machine and K-Nearest Neighbor. Electrical and Computer Engineering (CCECE), 2017 IEEE 30th Canadian Conference on. IEEE: 1-4.
[11]Song, S.L. (2018). Application of gray prediction and linear programming model in eco-nomic management, Mathematical Modelling of Engineering Problems, 5(1), 46-50.
https://doi.org/10.18280/mmep.050107
[12]Peng, H., Long, F., Ding, C. (2005). Feature selection based on mutual information: criteria of max-dependency, max-relevance, and min-redundancy. IEEE Trans Pattern Anal Mach Intell, 27(8): 1226-1238. https://doi.org/10.1109/TPAMI.2005.159
[13]Li, J., Pang, Z., Su, L. (2015). Feature selection method LLE score used for tumor gene expressive data. Journal of Beiijng University of Technology, 41(8): 1145-1150.
[14]Guyon, I., Weston, J., Barnhill, S. (2002). Gene selection for cancer classification using support vector machines. Machine learning, 46(1-3): 389-422. https://doi.org/10.1023/ A:1012487302797
[15]Kira, K., Rendell, L.A. (1992). The feature selection problem: Traditional methods and a new algorithm, AAAI. 2: 129-134.
[16]Wang, R., Tang, K. (2009). Feature Selection for Maximizing the Area Under the ROC Curve. ICDMW '09 Proceedings of the 2009 IEEE International Conference on Data Mining Workshops, 400-405. https://doi.org/10.1109/ICDMW.2009.25
[17]Sun, L., Wang, J., Wei, J. (2017). AVC: Selecting discriminative features on basis of AUC by maximizing variable complementarity. BMC bioinformatics, 18(3): 50.
https://doi.org/10.1186/s12859-017-1468-4
[18]Duan, K.B., Rajapakse, J.C., Nguyen, M.N. (2007). One-versus-one and one-versus-all mul-ticlass SVM-RFE for gene selection in cancer classification. European Conference on Evo-lutionary Computation, Machine Learning and Data Mining in Bioinformatics. Springer: 47-56. https://doi.org/10.1007/978-3-540-71783-6_5
[19]Robnik-Šikonja, M., Kononenko, I. (2003). Theoretical and empirical analysis of ReliefF and RReliefF. Machine learning, 53(1-2): 23-69. https://doi.org/10.1023/A:1025667309714
[20]Wang, R., Tang, K. (2012). Feature selection for MAUC-oriented classification systems. Neurocomputing, 89: 39-54. https://doi.org/10.1016/j.neucom.2012.01.013
[21]Hsu, C.W., Chang, C.C., Lin, C.J. (2003). A practical guide to support vector classification. 2003.
7
Authors
Haixia Lu, female, graduate student, lecturer, born in Shijiazhuang, Hebei Province in 1977, has worked in the Shijiazhuang Preschool Teachers College since 1999. She has been engaged in education technology and related education teaching. The research direction is education technology. She presided over the research topic on the Role of Microteaching in the Professional Skills Training of Preschool Teachers, and cooper-ated with others to complete some research topics in education and teaching.
Jinsong Yuan is from Shijiazhuang Preschool Teachers College, Shijiazhuang 050228, China.
Article submitted 27 July 2018. Resubmitted 31 August 2018. Final acceptance 10 September 2018. Final version published as submitted by the authors.