Effect of Dietary Protein Intake on Serum Total CO
2
Concentration in Chronic Kidney Disease: Modification of
Diet in Renal Disease Study Findings
F. John Gennari,* Virginia L. Hood,* Tom Greene,
†Xulei Wang,
†and Andrew S. Levey
‡*University of Vermont College of Medicine, Burlington, Vermont;
†Cleveland Clinic Foundation, Cleveland, Ohio; and
‡
New England Medical Center, Boston, Massachusetts
Metabolic acidosis is a feature of chronic kidney disease (CKD), but whether serum bicarbonate concentration is influenced by variations in dietary protein intake is unknown. For assessing the effect of diet, data that were collected in the Modification of Diet in Renal Disease study were used. In this study, patients with CKD were enrolled into a baseline period, then randomly assigned to follow either a low- or a usual-protein diet (study A, entry GFR 25 to 55 ml/min) or a low- or very low–protein diet, the latter supplemented with ketoanalogs of amino acids (study B, entry GFR 13 to 24 ml/min). Serum [total CO2] and estimated protein intake (EPI) were assessed at entry (nⴝ1676) and again at 1 yr after randomization, controlling
for changes in GFR and other key covariates (nⴝ723). At entry, serum [total CO2] was inversely related to EPI (1.0 mEq/L
lower mean serum [total CO2]/g per kg body wt increase in protein intake/d;Pⴝ0.009). In an intention-to-treat analysis, the
reduction in mean EPI in the low-protein group as compared with the usual-protein group (0.41 g/kg body wt per d) was independently associated with a 0.9-mEq/L increase in serum [total CO2], after adjustment for covariates (P<0.001). No such
effect was evident in study B, in which the very low–protein diet group received dietary supplements. Serum [total CO2] is
inversely correlated with dietary protein intake in patients with CKD. A reduction in protein intake results in an increase in serum [total CO2].
Clin J Am Soc Nephrol1: 52–57, 2006. doi: 10.2215/CJN.00060505
S
erum total CO2concentration ([total CO2]) falls as GFRdecreases in chronic kidney disease (CKD) (1,2), but the values vary widely among patients with similar levels of kidney function. Part of this difference may be due to diet-induced differences in endogenous acid production. In individ-uals with normal kidney function, the effect of diet on serum [total CO2] is small and not detectable unless the influence of
Paco2is removed (3). Given the impairment in acid excretion
that occurs in CKD (4 – 6), one might anticipate that differences in diet-induced acid production would have a greater influence on serum [total CO2] than in people with normal kidney
func-tion. The major source of endogenous acid production comes from metabolism of dietary protein (7); therefore, protein re-striction should result in an increase in serum [total CO2] if this
hypothesis is correct. Despite extensive studies on the effects of protein restriction on metabolic parameters and kidney disease progression (8), little attention has been directed to the effect of this intervention on serum [total CO2] in CKD. In one study in
humans with severe CKD, serum [HCO3⫺] was notably higher
when the patients were compliant with a very low–protein diet (0.3 g/kg body weight) supplemented with ketoanalogs of
amino acids (9). In two other studies in humans, serum [total CO2] did not increase significantly after a 50% reduction in
protein, but both studies contained very few subjects (10,11). The best data supporting an effect of protein restriction on body alkali stores in CKD come from a partial nephrectomy rat model (12). In this model, steady-state serum [HCO3⫺] was
significantly higher (by 2 mEq/L) in animals that ingested a low-protein diet (6% of total calories/d) as compared with animals that ingested a normal-protein diet (24% of total calo-ries/d).
To determine whether systematic changes in dietary protein intake affect serum [total CO2] in a large cohort of patients with
CKD, we evaluated the data collected in patients who partici-pated in the Modification of Diet in Renal Disease (MDRD) study, focusing on GFR, protein intake, and serum [total CO2]
(13). Our analysis demonstrates that [total CO2] is inversely
related to dietary protein intake in this group of patients and that a deliberate reduction in dietary protein intake increases serum [total CO2].
Materials and Methods
The details of the entry criteria, design, and results of the MDRD trial have been published previously (13–15). In brief, 1782 men and women were screened for this study. A total of 840 men and women who were aged 18 to 70 yr and had CKD were subsequently randomly assigned to diets that differed in protein content. On the basis of GFR, measured by iothalamate clearance, the participants were enrolled in either study A or study B. Patients in study A (n⫽585) had entry GFR of 25 to 55
Received May 3, 2005. Accepted July 28, 2005.
Published online ahead of print. Publication date available at www.cjasn.org.
Address correspondence to:Dr. F. John Gennari, Rehab 2319 UHC Campus,
Fletcher Allen Health Care, Burlington, VT 05401. Phone: 802-847-2534; Fax: 802-847-8736; E-mail: [email protected]
ml/min per 1.73 m2; patients in study B (n⫽255) had entry GFR of 13
to 24 ml/min per 1.73 m2. After a baseline period of measurements, the
patients in study A were randomly assigned to either a usual-protein diet or a low-protein diet. The usual-protein diet contained 1.3 g/kg body wt per d protein and 16 to 20 mg/kg body wt per d phosphorus. The low-protein diet was designed to provide 0.575 g/kg body wt per d protein (with 65% of protein from high biologic value sources) and 5 to 10 mg/kg body wt per d phosphorus. In study B, the patients were randomly assigned either to the low-protein diet described above or to a very low–protein diet (0.28 g/kg body wt per d) supplemented with a mixed salt preparation made up of basic amino acids (tyrosine and threonine) and ketoacid analogs of other essential amino acids (totaling 0.28 g/kg body wt per d) (16). In this study, total protein and protein precursor intake from food and supplements was identical in the low-and very low–protein diets. Both the low- low-and very low–protein diets contained 4 to 9 mg/kg body wt per d phosphorus in study B. In both studies, serum [total CO2] was recorded every 4 mo from local
labora-tory measurements, and 24-h urine urea nitrogen excretion was mea-sured centrally monthly throughout follow-up (average duration 2.2 yr). Dietary protein intake was estimated from urine urea nitrogen measurements (15). This report focuses on two analyses of these data. The first is a cross-sectional examination of the interrelationships among serum [total CO2], GFR, and estimated protein intake (EPI) at
the initial baseline visit in all of the screened patients for whom these three measurements were available (n⫽1676). The second is a longi-tudinal examination of the effect of dietary protein restriction on serum [total CO2], using an intention-to-treat analysis. We chose a 1-yr
inter-val for this latter examination to minimize bias as a result of attrition from death, development of ESRD, or other loss to follow-up and to minimize the confounding effects of changes in GFR. For this longitu-dinal assessment, serum [total CO2] and EPI were evaluated at the
initial baseline and at 1 yr. This analysis was carried out in all of the randomly assigned patients in whom [total CO2], GFR, and EPI were
assessed both at the initial baseline visit and at 1 yr after randomization (n⫽723).
Statistical Analyses
The cross-sectional association of [total CO2] with other factors was
evaluated at the initial baseline visit in 1676 patients with values at this visit for [total CO2], GFR, and EPI. We first related [total CO2] to GFR
and EPI in a multiple regression model that included indicator vari-ables for the 15 clinical centers as covariates. A segmented regression model with separate slopes for the relationship of [total CO2] with GFR
above and below 25 ml/min per 1.73 m2was used to account for a
steeper relationship between these factors at lower GFR levels. This regression analysis was repeated after adjustment also for demographic factors and indicators for antihypertensive medications at baseline.
The effects of the diet interventions on the change in [total CO2] from
baseline to 1 yr were tested in 517 study A patients and in 206 study B patients who remained in the trial and who provided [total CO2]
measurements at baseline and at 1 yr. The diet effects were estimated using analysis of covariance, with the model adjusting for baseline [total CO2]; baseline GFR; and indicator variables for randomized BP
group, clinical center, and the randomization stratification factors (in-verse serum creatinine slope before the trial and baseline mean arterial BP). In this analysis, patients were analyzed according to their random-ized group assignment, irrespective of achieved protein intake during follow-up. The sensitivity of the results to potential confounding by changes in GFR after randomization was evaluated by adding the 12-mo GFR value as an additional covariate in the analysis. Because [total CO2] was measured in the local laboratories associated with the
15 clinical centers in the MDRD study, we expect there to be systematic
center difference in the assay. This was accounted for in the statistical analyses by including clinical center as a covariate and by assessing the effects of the diet intervention on the basis of the change in [total CO2]
over 1 yr, thus using each patient as his or her own control.
Results
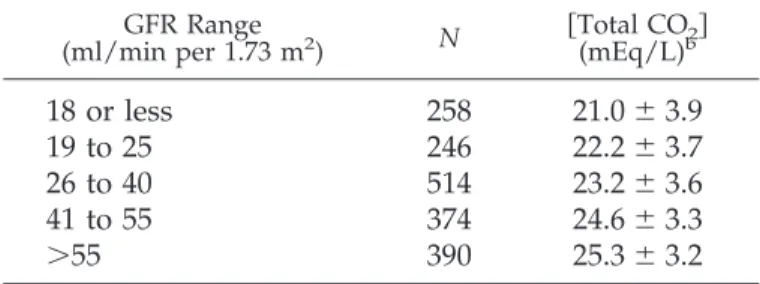
Fifteen centers participated in the study, each contributing between 52 and 64 participants who met the baseline charac-teristics and were randomly assigned. The spectrum of diag-noses included polycystic kidney disease (22%), glomerular diseases (27%), hypertensive nephropathy (17%), tubulointer-stitial diseases (7%), and other or unknown (14%). Only 3.5% had diabetic nephropathy, because patients who had diabetes and required insulin therapy were excluded from the MDRD study. The remaining 9.5% included hereditary renal diseases, urinary tract disease, and diseases associated with a single kidney. The results of the cross-sectional analyses at baseline are shown in Tables 1 through 3. Mean baseline serum [total CO2] varied significantly among the centers, ranging from 20.2
to 25.7 mEq/L (P⬍0.0001). The level of [total CO2] was also
significantly related to GFR (Table 1), but the differences among mean [total CO2] levels persisted when GFR was taken
into account. After controlling for clinical center, [total CO2]
correlated directly with GFR and inversely with estimated pro-tein intake (Table 2). The relationship of [total CO2] to GFR was
significantly stronger at lower GFR than at higher GFR values (P⬍0.001); thus, two regression coefficients are shown in Table 2. Regression analysis of baseline [total CO2] against GFR and
estimated protein intake, now corrected for all other significant variables (center, age, gender, and drugs) showed the same significant correlations (Table 3). Of note, this analysis shows a significant inverse correlation between baseline serum [total CO2] and the use of angiotensin-converting enzyme (ACE)
inhibitors and a direct correlation with the use of diuretics. Serum [total CO2] also showed an inverse correlation with age
and direct correlations with male gender and other antihyper-tensive medication use. The latter grouping was too diverse to analyze further. After controlling for clinical center, GFR, tein intake, age, race, antihypertensive medications, and pro-teinuria, the kidney disease diagnosis was not significantly associated with serum [total CO2] (P⫽0.24).
Table 1.
Effect of GFR on serum
关
total CO
2兴
for all
screened patients (1782)
a GFR Range (ml/min per 1.73 m2 ) N 关Total CO(mEq/L)b2兴18 or less
258
21.0
⫾
3.9
19 to 25
246
22.2
⫾
3.7
26 to 40
514
23.2
⫾
3.6
41 to 55
374
24.6
⫾
3.3
⬎
55
390
25.3
⫾
3.2
aData are shown as means⫾1 SD. Includes patients
without measurements of estimated protein intake (EPI).
bMean关total CO
2兴differed significantly among the
Tables 4 and 5 show the results of the longitudinal analysis. The spectrum of diagnoses in this group did not differ notably from the screened population. Baseline GFR, EPI, and [total CO2] were similar between randomized groups in both studies.
Mean GFR declined by 4 to 5.5 ml/min during the first year in all four groups, and the mean change to 1 yr did not differ significantly between the diet groups in either study. Adher-ence to the prescribed diets was incomplete in both diet groups in study A and study B. In study A, EPI increased by 0.1 g/kg body wt per d in the usual-protein diet group and decreased by 0.27 g/kg body wt per d in the low-protein diet group (P ⬍
0.001 in both instances). The mean difference in protein intake between the two groups in study A at 1 yr was 0.41 g/kg body wt per d (P⬍0.001). In study B, EPI decreased by 0.22 g/kg body wt per d in the low-protein diet group. In the very low–protein diet group, EPI decreased by 0.46 g/kg body wt per d, but recall that this reduction was assessed by urine urea nitrogen excretion and therefore does not account for protein synthesis and degradation from metabolism of ketoanalogs of
amino acids. When diet and supplements are taken into ac-count, the combination of protein and protein precursor intake in the two diet groups in study B was similar.
In study A, after adjustment for baseline [total CO2], baseline
GFR, clinical center, and the randomization stratification fac-tors, mean serum [total CO2] did not change significantly at 1 yr
as compared with baseline in the usual-protein diet group, but the value increased by 0.86⫾ 0.18 mEq/L in the low-protein group (Table 5). The mean change in serum [total CO2] was also
significantly higher at 1 yr in the low-protein group as com-pared with the usual-protein group (estimated diet effect ⫽ 0.91⫾0.25 mEq/L;P⬍0.001; Table 5). In study B, serum [total CO2] did not change significantly at 1 yr in the low-protein
group, but it increased by 0.88 ⫾ 0.32 mEq/L in the very low–protein group. Despite this increase, the mean change in [total CO2] in the very low–protein group was not significantly
different from that in the low-protein group at 1 yr (estimated diet effect⫽ 0.48⫾ 0.28;P ⫽ 0.28). In both studies, the diet effects were similar after controlling for the 12-mo GFR level in
Table 2.
Association of serum
关
total CO
2兴
with GFR and EPI
aat baseline
bPredictor Variable ⌬关Total CO2兴 c
P
GFR (13 to 24 ml/min per 1.73 m
2) per
10 ml/min per 1.73 m
22.27
⫾
0.22
⬍
0.001
GFR (25 to 55 ml/min per 1.73 m
2) per
10 ml/min per 1.73 m
20.44
⫾
0.05
⬍
0.001
EPI per g/kg body wt per day
⫺
0.91
⫾
0.35
0.009
a
Daily protein intakes estimated from urine urea nitrogen excretion.
b
Multiple regression analysis controlling for clinical center. Clinical center was also statistically significant (P⬍0.001).
c
Estimated mean difference in serum关total CO2兴in mEq/L (⫾SE) associated with the indicated increases in GFR and EPI.
Table 3.
Association of serum
关
total CO
2兴
with GFR, EPI, age, race, gender, and drug therapy at baseline
aPredictor Variable ⌬关Total CO2兴b P
GFR (13 to 24 ml/min per 1.73 m
2) per
10 ml/min per 1.73 m
22.44
⫾
0.21
⬍
0.001
GFR (25 to 55 ml/min per 1.73 m
2) per
10 ml/min per 1.73 m
20.49
⫾
0.05
⬍
0.001
EPI (per g/kg body wt per d)
⫺
1.01
⫾
0.33
0.003
Age (per 10 yr)
⫺
0.25
⫾
0.06
⬍
0.001
Black race
c0.33
⫾
0.25
0.18
Male
0.33
⫾
0.16
0.04
Drug therapy
ACE inhibitors
⫺
0.51
⫾
0.17
0.003
diuretics
1.54
⫾
0.17
⬍
0.001

blockers
⫺
0.02
⫾
0.17
0.89
calcium channel blockers
⫺
0.16
⫾
0.18
0.38
other antihypertensives
0.58
⫾
0.21
0.007
aDaily protein intake estimated from urine urea nitrogen excretion. Multiple regression analysis controlling for clinical
center. Clinical center was also statistically significant (P⬍0.001). The modelR2was 0.35. ACE, angiotensin-converting
enzyme.
bEstimated mean difference in serum关total CO
2兴in mEq/L (⫾1 SE) associated with indicated increases in indicated
predictor variables.
addition to all of the above factors (estimated diet effect in study A⫽1.05⫾0.25 mEq/L [P⬍0 0.001]; in study B⫽0.21⫾ 0.43 mEq/L [P⫽0.64]).
Discussion
This analysis of the participants in the MDRD study, both at the time of entry into the study and at 1 yr after deliberate changes in diet, indicates that dietary protein intake has a significant influence on serum [total CO2] in patients with
CKD. Before randomization, serum [total CO2] varied inversely
with EPI, an effect that persisted when other influences were accounted for. When protein intake was reduced deliberately in the low-protein diet group in study A, moreover, serum [total CO2] increased notably in comparison with the usual-protein
diet group, indicating a significant diet effect at 1 yr (Table 5). On the basis of this latter analysis, a reduction in dietary protein intake of 0.2 g/kg body wt per d in patients with CKD would be predicted to increase serum [total CO2] by almost 0.5
mEq/L.
In contrast to study A, no significant effect of diet on serum [total CO2] was seen in study B, but this study was confounded
by the diet supplement that was given to the patients in the very low–protein diet group. This supplement contained mixed salts of basic amino acids and ketoanalogs of other amino acids (15,16). Reviewing the components of these salts, one would expect them, if anything, to generate new HCO3⫺when
metab-olized, likely accounting for the large increase in serum [total CO2] between baseline and 1 yr in the very low–protein group
Table 4.
GFR and EPI at baseline and at 1 yr and the changes in these parameters during that interval in the
patients in study A and study B
aStudy A Study B Usual (n⫽257)b Low (n⫽247)c Low (n⫽103)d Very Low (n⫽94)e
GFR (ml/min per 1.73 m
2)
entry
38.3
⫾
9.2
40
⫾
9.5
20.2
⫾
3.9
20.4
⫾
4.8
year 1
34.3
⫾
9.2
35
⫾
11.0
14.7
⫾
4.4
15.2
⫾
5.1
change
⫺
4.0
⫾
8.1
f⫺
5.0
⫾
7.7
f⫺
5.5
⫾
4.2
f⫺
5.2
⫾
4.6
fEPI
a(g/kg body wt per d)
entry
1.04
⫾
0.22
1.01
⫾
0.2
0.94
⫾
0.22
0.92
⫾
0.20
year 1
1.15
⫾
0.21
0.74
⫾
0.15
g0.72
⫾
0.14
0.46
⫾
0.14
change
0.10
⫾
0.27
f⫺
0.27
⫾
0.23
f⫺
0.22
⫾
0.23
f⫺
0.46
⫾
0.21
fa
Data shown are means⫾SD.
b
n⫽249 for EPI at 1 yr.
c
n⫽246 for EPI at baseline and 245 for EPI at 1 yr.
d
n⫽101 for EPI at baseline and 102 for EPI at 1 yr.
e
n⫽96 for EPI at 1 yr.
f
P⬍0.001versusentry.
g
P⬍0.001versususual protein intake at 1 yr.
Table 5.
Serum
关
total CO
2兴
at baseline and at 1 yr and the effect of the change in diet on
关
total CO
2兴
during that
interval in the patients in study A and study B
aStudy A Study B
Usual (n⫽264) Low (n⫽253) Low (n⫽107) Very Low (n⫽99)
关
Total CO
2兴
(mEq/L)
entry
23.8
⫾
3.6
24.2
⫾
3.6
22.3
⫾
3.7
21.6
⫾
3.6
year 1
23.7
⫾
3.3
24.9
⫾
3.4
22.6
⫾
3.6
22.8
⫾
4.0
change
b⫺
0.05
⫾
0.27
0.86
⫾
0.18
c0.40
⫾
0.31
0.88
⫾
0.32
cDiet effect
d(mEq/L)
0.91
⫾
0.25
0.48
⫾
0.44
a
ANCOVA with serum关total CO2兴as the dependent variable, EPI as the independent factor, and GFR as the potential
confounding variable. Data shown for absolute values are⫾1 SD.
b
Adjusted mean changes⫾1 SE, controlling for clinical center, the randomization stratification factors, baseline serum关total CO2兴, and baseline GFR.
c
P⬍0.01versus0.
d
Estimated diet effect (⫾1 SE) on the change from baseline to 1 yr in serum关total CO2兴between the two diet groups in
each study, controlling for clinical center, the randomization stratification factors, baseline serum关total CO2兴, and baseline
(Table 5). Because serum [total CO2] also trended upward in the
low-protein group in study B and possibly because of the small numbers of patients, no “diet effect” was seen when the low-and very low–protein diet groups were compared. Regardless of the outcome, however, one cannot draw any conclusions about the effect of diet in study B because of the potential alkali contained in the supplements that were given to the very low–protein diet group.
This study reconfirms the strong relationship between GFR and serum [total CO2] (1,2,17), and this influence is clearly a
confounding factor in assessing the effect of diet in any group of patients with widely varying and changing GFR. Fortu-itously, the fall in GFR was essentially the same over 1 yr in the two groups in both study A and study B (Table 4). The power of the present study is that the randomization procedure limits the degree of confounding for this key variable. Furthermore, our sensitivity analyses using multivariable regression showed that the estimated diet group effects are essentially unchanged after adjustment for the small differences in change in GFR that were observed.
Other significant cross-sectional relationships involving se-rum [total CO2] are outlined in Table 3. Of interest, the use of
ACE inhibitors correlated inversely with serum [total CO2], and
the use of diuretics correlated directly. Although it is difficult to draw any firm conclusions from these correlations, the ACE inhibitor effect could be due to a reduction in aldosterone secretion, thereby impairing acid excretion. The diuretic effect, by contrast, suggests that even damaged kidneys can respond to an increase in distal Na⫹delivery with an increase in H⫹ secretion. Further studies are needed to explore these effects in greater detail.
Three earlier studies have provided data to suggest that reducing protein intake increases serum [HCO3⫺] in patients
with CKD (9 –11), but all had fewer subjects and none assessed critically other variables that could have influenced serum [to-tal CO2]. In the largest of the three studies, capillary blood pH
and [HCO3⫺] were measured in a group of patients who had
severe CKD (mean creatinine clearance⫽10 ml/min) and were put on a very low–protein diet (dietary protein intake 0.3 g/kg body wt per d), supplemented by a different mixture of essen-tial amino acids and ketoanalogs than in the present study (9). In contrast to the present study, all patients were on the same diet and supplements. Patient compliance was assessed by measuring urine urea nitrogen excretion, and acid-base status measurements were obtained at varying intervals after the diet was started (from 5 to 58 mo). Blood [HCO3⫺] and pH both
were significantly higher (22versus19 mEq/L and 7.39versus
7.33;P⬍0.01 in both cases) in a subset of patients who were compliant with the diet. Although mean GFR was not signifi-cantly different at the time of assessment, the rate of decline was greater in the noncompliant patients; thus, a confounding effect of GFR is likely. The two other studies involved very small numbers of patients (six in one and 12 in the other), and both showed a nonsignificant increase in serum [HCO3⫺] (1 to
2 mEq/L) 2 wk to 3 mo after dietary protein intake was reduced by 50% (10,11).
Although not measured, we presume that the diet effect
observed in the MDRD study is caused by a reduction in endogenous acid production, engendered by reduction of di-etary protein intake. In individuals who are eating a Western diet, a major component of endogenous acid production is due to the catabolism of sulfur-containing amino acids contained in animal proteins, and endogenous acid production correlates directly with protein intake (3). In study A, dietary phosphate intake was also reduced in the low-protein diet group. Because of the study design, we could not separate potential effects of phosphate reduction from those of protein reduction, but di-etary phosphate is normally a net contributor to endogenous acid production (3). Thus, the reduction in phosphate intake, if it has any effect, would contribute to the diet-induced reduction in endogenous acid production. In individuals with normal GFR or with age-related reductions in GFR, endogenous acid production shows an inverse correlation with serum [HCO3⫺],
but only after the influences of Pco2 and GFR are removed
(3,17). This study suggests that when CKD is present, diet-induced reductions in endogenous acid production have an effect on serum [total CO2] that is demonstrable without
con-trolling for variations in Pco2.
When the total variability in serum [total CO2] in the present
study was evaluated at baseline, only 35% was accounted for by all of the variables tested (Table 3), indicating that other, un-measured factors contribute to this variability. The MDRD study was not designed to study the hypothesis that we pro-posed, and it is not surprising, therefore, that many undefined influences are present. One can only speculate about these, but one is almost certainly Pco2. Variations in Pco2are well
recog-nized to have a potent effect on steady-state serum [total CO2]
(3,17,18), most likely through a direct effect of CO2on HCO3⫺
reabsorption and acid excretion by the kidney. Nonetheless, a systematic bias in Pco2is unlikely to be present in this study.
All contributing centers were at or near sea level, so the distri-bution of variations in Pco2was likely random in the
partici-pants. Another likely factor is variations in renal H⫹secretion in patients who had the same level of GFR. It is widely recog-nized, for example, that a fraction of patients with CKD waste HCO3⫺(5,6), and in these individuals, serum [total CO2] would
not be expected to increase with a reduction in endogenous acid production. A third possibility is variation as a result of differences in kidney disease diagnoses. The effect of a given diagnosis on serum [total CO2] has not been examined
criti-cally, but one large retrospective analysis that included a broad spectrum of diagnoses did not note any specific effect of kidney disease diagnosis on serum [total CO2] (2). Our cross-sectional
analysis did not suggest that kidney disease diagnosis influ-enced acid-base status.
A limitation of our study is that we cannot exclude with certainty other, as-yet-undefined factors that may introduce a bias in our findings. We have adjusted for the key factors that were measured, however, particularly the influence of changes in GFR. The paired observations add strength to our conclusion by minimizing population variation, and the diet effect is ro-bust in study A, which is the most straightforward study of the effect of protein restriction on serum [total CO2] in patients
In summary, analysis of the MDRD data indicates that di-etary protein intake is inversely associated with serum [total CO2]. In addition, a deliberate reduction in protein intake
re-sults in a significant increase in serum [total CO2]. Given the
now well-documented effects of a low serum [total CO2] to
promote muscle catabolism and bone calcium loss in patients with CKD (19,20), further exploration of dietary approaches to ameliorating the reduction in [total CO2] that accompanies
CKD is warranted.
References
1. Widmer B, Gerhardt RE, Harrington JT, Cohen JJ: Serum electrolyte and acid base composition. The influence of graded degrees of chronic renal failure. Arch Intern Med
139: 1099 –1102, 1979
2. Hakim RM, Lazarus JM: Biochemical parameters in chronic renal failure.Am J Kidney Dis11: 238 –247, 1988 3. Kurtz I, Maher T, Hulter HN, Schambelan M, Sebastian A:
Effect of diet on plasma acid-base composition in normal humans.Kidney Int24: 670 – 680, 1983
4. Tizianello A, De Ferrari G, Garibotto G, Gurreri G, Robaudo C: Renal metabolism of amino acids and ammo-nia in subjects with normal renal function and in patients with chronic renal insufficiency.J Clin Invest65: 1162–1173, 1980
5. Schwartz WB, Hall PW 3rd, Hays RM, Relman AS: On the mechanism of acidosis in chronic renal disease.J Clin Invest
38: 39 –52, 1959
6. Goodman AD, Lemann J Jr, Lennon EJ, Relman AS: Pro-duction, excretion, and net balance of fixed acid in patients with renal acidosis.J Clin Invest44: 495–506, 1965 7. Harrington JT, Lemann J Jr: The metabolic production and
disposal of acid and alkali.Med Clin North Am54: 1543– 1554, 1970
8. Pedrini MT, Levey AS, Lau J, Chalmers TC, Wang PH: The effect of dietary protein restriction on the progression of diabetic and nondiabetic renal diseases: A meta-analysis.
Ann Intern Med124: 627– 632, 1996
9. Barsotti G, Cupisti A, Ciardella F, Morelli E, Niosi F, Gio-vannetti S: Compliance with protein restriction: Effects on metabolic acidosis and progression of renal failure in
chronic uremics on supplemented diet.Contrib Nephrol81: 42– 49, 1990
10. Williams B, Hattersley J, Layward E, Walls J: Metabolic acidosis and skeletal muscle adaptation to low protein diets in chronic uremia.Kidney Int40: 779 –786, 1991 11. Bernhard J, Beaufrere B, Laville M, Fouque D: Adaptive
response to a low-protein diet in predialysis chronic renal failure patients.J Am Soc Nephrol12: 1249 –1254, 2001 12. Maddox DA, Horn JF, Famiano FC, Gennari FJ: Load
de-pendence of proximal tubular fluid and bicarbonate reab-sorption in the remnant kidney of the Munich-Wistar rat.
J Clin Invest77: 1639 –1649, 1986
13. Klahr S, Levey AS, Beck GJ, Caggiula AW, Hunsicker L, Kusek JW, Striker G: The effects of dietary protein restric-tion and blood-pressure control on the progression of chronic renal disease. Modification of Diet in Renal Disease Study Group.N Engl J Med330: 877– 884, 1994
14. Greene T, Bourgoignie JJ, Habwe V, Kusek JW, Snetselaar LG, Soucie JM, Yamamoto ME: Baseline characteristics in the Modification of Diet in Renal Disease Study.J Am Soc Nephrol4: 1221–1236, 1993
15. The Modification of Diet in Renal Disease Study: Design, methods, and results from the feasibility study.Am J Kid-ney Dis20: 18 –33, 1992
16. Mitch WE, Abras E, Walser M: Long-term effects of a new ketoacid-amino acid supplement in patients with chronic renal failure.Kidney Int22: 48 –53, 1982
17. Frassetto LA, Morris RC Jr, Sebastian A: Effect of age on blood acid-base composition in adult humans: Role of age-related renal functional decline. Am J Physiol 271: F1114 –F1122, 1996
18. Madias NE, Adrogue HJ, Horowitz GL, Cohen JJ, Schwartz WB: A redefinition of normal acid-base equilibrium in man: Carbon dioxide tension as a key determinant of nor-mal plasma bicarbonate concentration.Kidney Int16: 612– 618, 1979
19. Garibotto G, Russo R, Sofia A, Sala MR, Robaudo C, Moscatelli P, Deferrari G, Tizianello A: Skeletal muscle protein synthesis and degradation in patients with chronic renal failure.Kidney Int45: 1432–1439, 1994
20. Bushinsky DA: The contribution of acidosis to renal os-teodystrophy.Kidney Int47: 1816 –1832, 1995