QUANTITATIVETRAIT LOCI ANALYSIS TO IDENTIFY MODIFIER
GENES OF THEGENE Opaque2 IN MAIZE ENDOSPERM
A Dissertation by
LIBARDO ANDRES GUTIERREZ ROJAS
Submitted to the Office of Graduate Studies of Texas A&M University
in partial fulfillment of the requirements for the degree of DOCTOR OF PHILOSOPHY
December 2007
QUANTITATIVETRAIT LOCI ANALYSIS TO IDENTIFY MODIFIER GENES
OF THEGENE Opaque2 IN MAIZE ENDOSPERM
A Dissertation by
LIBARDO ANDRES GUTIERREZ ROJAS
Submitted to the Office of Graduate Studies of Texas A&M University
in partial fulfillment of the requirements for the degree of DOCTOR OF PHILOSOPHY
Approved by:
Co-Chairs of Committee, Monica Menz
Alan Pepper
Committee Members, Javier Betran
Scott Finlayson
Chair of Molecular and Environmental Plant
Sciences Faculty, Jean Gould
December 2007
ABSTRACT
QuantitativeTrait Loci Analysis to Identify Modifier Genes of the Gene Opaque2 in Maize Endosperm. (December 2007)
Libardo Andres Gutierrez Rojas, B.S., Universidad Nacional de Colombia; M.S., Universidad Nacional de Colombia
Co-Chairs of Advisory Committee: Dr. Monica Menz Dr. Alan Pepper
The protein quality of maize can be improved by replacing normal Opaque2 alleles with non-functional recessive alleles opaque2 (o2). The allele o2 produces a severe phenotype with soft endosperm enhancing its protein quality but decreasing its agronomical value. Plant breeders have restored a desirable ratio of hard to soft endosperm in o2 germplasm known as Quality Protein Maize (QPM). Neither the mechanism nor the genetic components by which the modification of the endosperm in QPM lines occurs are well understood. To increase the understanding of the genetics of endosperm modification, a population of 146 recombinant inbred lines derived from a cross between the o2 inbred line B73o2 and the QPM inbred line CML161 was evaluated in two Texas locations from 2004 to 2006. Four traits related to endosperm texture were measured and showed significant effect of the inbred lines, high heritability estimates and high genetic correlations. Relative content of the essential amino acids lysine, tryptophan and methionine were measured and showed significant effects of the
iv
lines and considerable high genetic correlations and heritabilities. Negative correlation was observed between endosperm texture traits and amino acid content. Quantitative trait loci (QTL) were mapped for traits related to the modification of endosperm texture and the content of lysine, tryptophan and methionine. QTLs clusters for endosperm texture traits were detected on chromosomes 3, 5, 6 and 8 explaining 62-68% of the variation. QTLs clusters for amino acid contents were located on chromosomes 7 and 8 that explained up to 39% of the observed variation. The product of the O2 gene is a transcription factor that affects the expression of a number of endosperm genes. A group of 29 endosperm genes associated with the O2 activity were evaluated in developing endosperm of the recombinant inbred lines. Genomic regions controlling gene transcript abundance in developing endosperm were identified by expression QTL mapping. Evidence is presented of QTL hot spots that segregate in association with endosperm texture modification or amino acid contents and are associated with the regulation of the expression of a group of endosperm genes.
DEDICATION
This dissertation is dedicated to my parents, Maria Stella and Libardo Antonio, to my wife Cristina, and to my daughter Paula.
vi
ACKNOWLEDGEMENTS
I hold a very special feeling of gratitude to my mentor and co-chair, Dr. Monica Menz. She showed immense confidence in me and my capabilities as a scientist. Beyond the academic guidance, she has been a counselor and a friend in all aspects of my life. I express my sincere thanks and gratitude to Dr. Javier Betran, my former co-chair and committee member. Dr. Betran has been an example of dedication, hard work, enthusiasm, and wisdom. I am grateful to Dr. Alan Pepper for being my co-chair and sharing with me his broad vision of plant molecular biology. Special thanks to Dr. Scott Finlayson for serving on my committee and for his opportune input.
Thanks to Dr. William Russell and Dr. Palmy Jesudhasan for their technical support. I would also like to thank Dr. Jean Gould and Dr. Marla Binzel who served as chairs of the Molecular and Environmental Plant Sciences program and to Dr. Marty Dickman, director of the Institute for Plant Genomics and Biotechnology. Sincere gratitude towards our collaborators outside Texas A&M, Paul Scott and Jim Coors.
The constant support of Susan Hall was invaluable for the successful completion of my studies. I must recognize the role of Mrs. Shiela Dainello who was in charge of too many details of my life as a student of Texas A&M University. Thanks to Dr. No in the Laboratory for Plant Genome Technology, and to Kathryn Rocheli who was a friend and support. Thanks to Kerry Mayfield who assisted me in many occasions. Thanks are also due to all fellow graduate students, former post docs, student workers, and visiting scientists of our lab and in the Maize breeding program: Bryan, Nilesh, Vivek, Hsiao-Hi,
Jorge, Chandra, Bryan, Ryan, Kareen, Poonam, Lacy, Cody, Otto, Halima, Rebecca, and many others. It would be difficult to name all those who collaborated during this
research, but their efforts will be always greatly appreciated.
I thank Pioneer Hi-Bred International for providing me a scholarship to pursue doctoral studies. I also appreciate the logistic and financial support of the Texas Agricultural Experiment Station.
None of this would have been possible without my spouse, friend and colleague Cristina. It is impossible to describe how important Cristina was for the entire Ph.D. process, not only as the perfect companion, but as a coworker in the laboratory and in the field. Cristina also gave me Paula, my ultimate motivation. Thanks to my parents, brothers, and sister; far away but always close to my heart. Thanks to my whole
Gutierrez-Cruz family. To my good old friends from high-school and college, specially to Juan and Martha. Thanks God.
viii TABLE OF CONTENTS Page ABSTRACT ... iii DEDICATION ... v ACKNOWLEDGEMENTS ... vi
TABLE OF CONTENTS ... viii
LIST OF FIGURES... x
LIST OF TABLES ... xii
CHAPTER I INTRODUCTION... 1
The Kernel of Maize ... 3
II PHENOTYPIC CHARACTERIZATION OF ENDOSPERM MODIFICATION AND AMINO ACID CONTENTS... 10
Overview ... 10
Introduction ... 11
Materials and Methods ... 13
Results and Discussion... 17
Conclusion... 30
III QUANTITATIVE TRAIT LOCI FOR ENDOSPERM MODIFICATION AND AMINO ACID CONTENTS... 32
Overview ... 32
Introduction ... 33
Materials and Methods ... 36
Results ... 40
Discussion ... 50
CHAPTER Page IV IDENTIFICATION OF MODIFIER LOCI FOR THE GENE
opaque2 BY EXPRESSION QUANTITATIVE TRAIT LOCI
MAPPING ... 60
Overview ... 60
Introduction ... 61
Materials and Methods ... 65
Results ... 74 Discussion ... 100 V SUMMARY ... 109 REFERENCES... 113 APPENDIX ... 131 VITA ... 132
x
LIST OF FIGURES
FIGURE Page 2.1 Endosperm texture modification ... 20 2.2 Frequency distributions of endosperm texture modification (TEXT-F,
TEXT-L, OPAC and VITR), and amino acid content (Lys, Trp and Met) in an o2 x QPM RIL population evaluated in Texas between 2004 and
2006. ... 21 2.3 Single value decomposition biplot of first two principal components for
endosperm texture in the field (TEXT-F), endosperm texture in the laboratory (TEXT-L), opacity (OPAC), vitreousness (VITR), lysine content (Lys), tryptophan content (Trp), and methionine content (Met) in an o2 x QPM RIL population evaluated in Texas between 2004 and
2006 ... 23 3.1 QTLs detected with CIM analysis for traits related with endosperm
texture modification (TEXT-F, TEXT-L, OPAC, and VITR) and amino acids content (Lys, Trp and Met) in a population of RILs derived from the cross between maize lines CML161 and B73o2 evaluated in Texas
during 2004-2006. ... 42 4.1 Loop design for endosperm microarray hybridizations ... 68 4.2 Landry-Moreaux (LM) fractions of mature endosperm protein in the
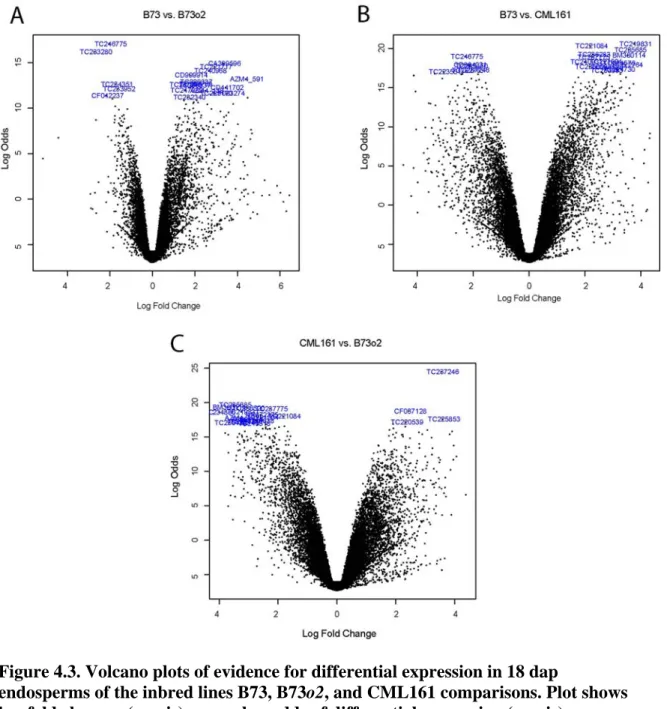
inbreds B73, B73o2, and CML161 ... 76 4.3 Volcano plots of evidence for differential expression in 18 dap
endosperms of the inbred lines B73, B73o2, and CML161
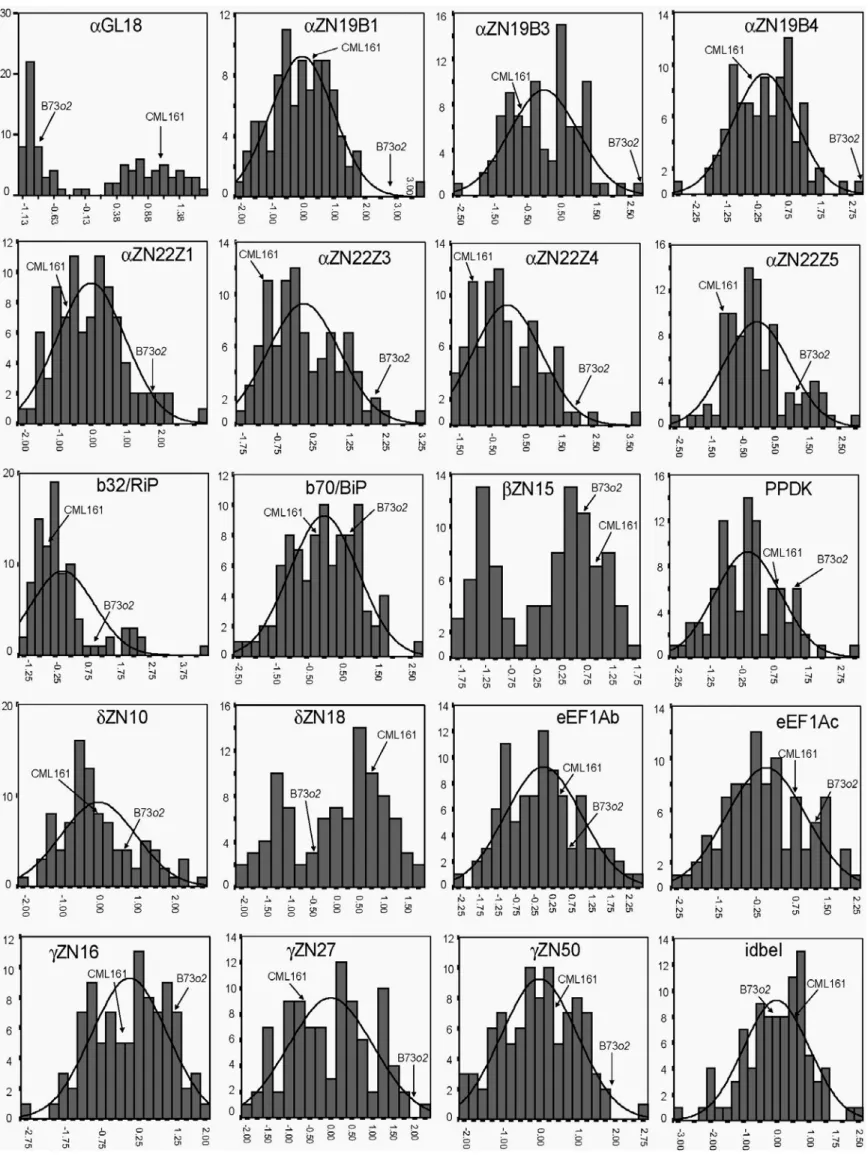
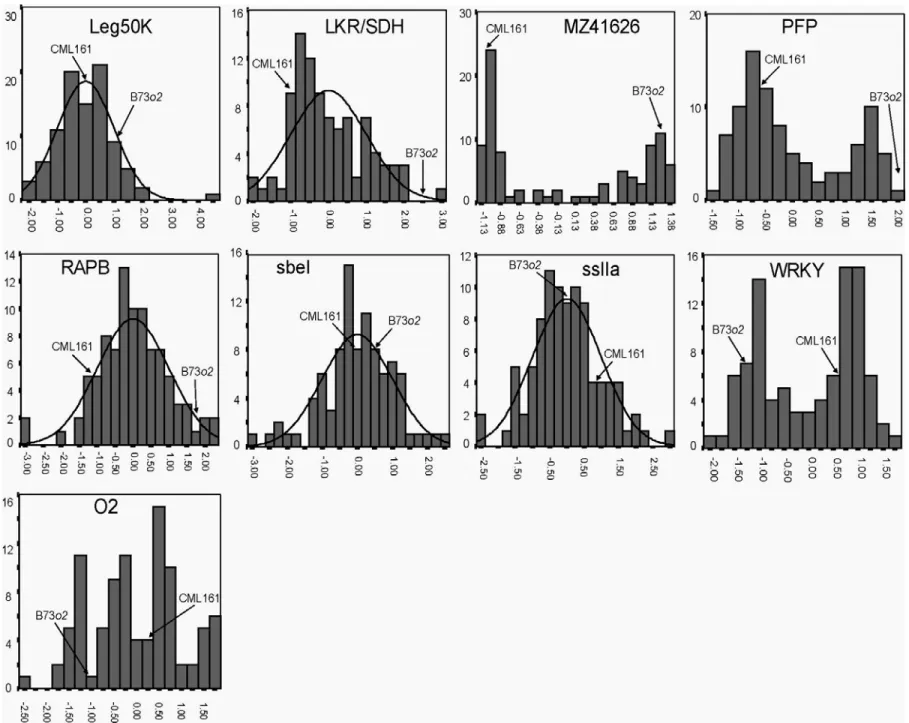
comparisons... 79 4.4 Frequency distribution of standardized ∆Ct values (normalized to 18s
ribosomal gene levels) for each of the 29 transcripts analyzed in 18 dap endosperm in the population of RILs derived from B73o2 x
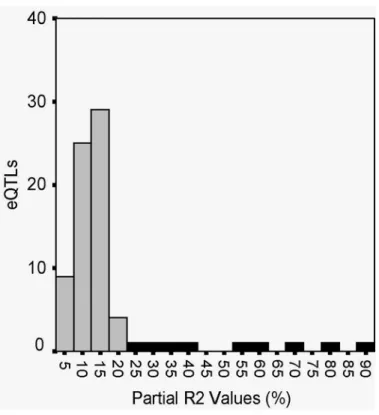
CML161 ... 83 4.5 Distribution of the percentage of phenotypic variation (R2) explained
FIGURE Page 4.6 Single value descomposition biplot of first two principal components
for 29 transcripts analyzed in 18 dap endosperm in the population of
RILs ... 95 4.7 Hierarchical clustering of relative abundance of mRNA levels of 29
gene transcripts in maize endosperm of recombinant inbred lines
(B73o2 x CML161) 18 days after pollination ... 96 4.8 Multiple-trait composite interval mapping for mRNA relative
abundance of the clusters of transcripts: “αZN22kDa”, “αZN19kDa”, “δZNs”, “γZNs”, “Starch”, and “Elongation Factor”; and the phenotypic traits endosperm texture and amino acid contents... 98
xii
LIST OF TABLES
TABLE Page 2.1 Combined analysis of variance for endosperm texture in the field
(TEXT-F), endosperm texture in the laboratory (TEXT-L), opacity (OPAC), vitreousness (VITR), lysine content (Lys), tryptophan content (Trp), and methionine content (Met) in an o2 x QPM RIL population
evaluated in Texas between 2004 and 2006... 18 2.2 Phenotypic (PC) and genotypic correlation (GC) estimates for
endosperm texture in the field (TEXT-F), endosperm texture in the laboratory (TEXT-L), opacity (OPAC), vitreousness (VITR), lysine content (Lys), tryptophan content (Trp), and methionine content (Met) in an o2 x QPM RIL population evaluated in Texas between 2004 and
2006 ... 25 2.3 Heritability and repeatability estimates for endosperm texture in the
field (TEXT-F), endosperm texture in the laboratory (TEXT-L), opacity (OPAC), vitreousness (VITR), lysine content (Lys), tryptophan content (Trp), and methionine content (Met) in an o2 x QPM RIL population
evaluated in Texas between 2004 and 2006... 27 2.4 Predicted response to selection for endosperm texture in the field
(TEXT-F), endosperm texture in the laboratory (TEXT-L), opacity (OPAC), vitrousness (VITR), lysine content (Lys), tryptophan content (Trp), and methionine content (Met) with both plot basis and entry
means-based selection units ... 29 2.5 Correlated response of lysine content (Lys) when selecting for
endosperm texture in the field (TEXT-F), endosperm texture in the laboratory (TEXT-L), opacity (OPAC), vitreousness (VITR), lysine content (Lys), tryptophan content (Trp), and methionine content (Met)
with entry means-based selection units ... 30 3.1 Quantitative trait loci (QTLs) identified by composite interval mapping
analysis across environments for the traits related to endosperm texture
modification TEXT-F, TEXT-L, OPAC, and VITR ... 44 3.2 Quantitative trait loci (QTLs) identified by composite interval mapping
analysis across environments for the content of the aminoacids: lysine
TABLE Page 4.1 Gene transcripts and primers selected for quantitative real-time PCR ... 70 4.2 Analysis of variance of the 29 transcripts evaluated by quantitative
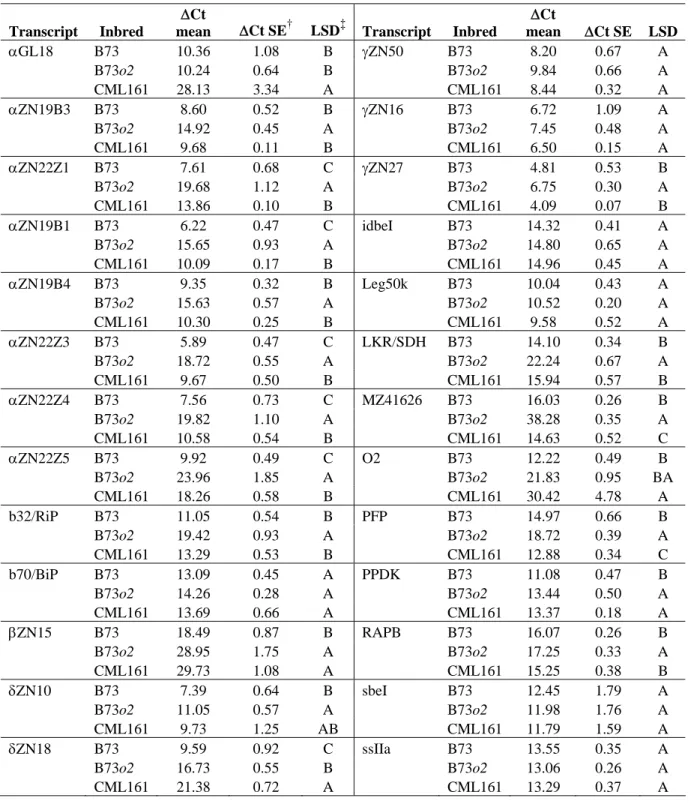
RT-PCR in endosperm 18 days after pollination of the inbred lines B73, B73o2 and CML161... 81
4.3 Composite interval mapping analysis for 29 transcripts analyzed by quantitative real-time in endosperm 18 dap from a set of 93 recombinant inbred lines derived from B73o2 x CML161 ... 88
1
CHAPTER I
INTRODUCTION
Maize (Zea mays L.) is one of the most important crops in the world. In 2005, 712,334.380 tons of maize were produced in the world. The U.S produced 40% of the total, making it the largest maize producer in the world (FAOSTAT, 2007). In developed countries, maize is mainly used as feed for livestock and industrial processes to
manufacture products such as plastics, fabrics, syrups, and alcohol. In many developing countries in Latin America, Africa and Asia, maize constitutes a staple food that
contributes up to 15% of the protein intake and 20% of the calories (National Research Council, 1988).
Maize belong to the Poaceae family, the monophyletic family of the grasses with approximately 10,000 species including other cereal crops such as rice, wheat, barley, and sorghum (Clark et al., 1995). Maize has 10 chromosomes (n=10, 2n=20). The size of the maize genome (~2,400 Mb) is similar to the human genome, nearly twenty times the one of Arabidopsis, and six times that of rice (Timmermans et al., 2004). The genome of maize is particularly rich in repetitive DNA, accounting for up to 66% of the total genome (Haberer et al., 2005). Despite decades of intensive research by botanists, geneticists, archeologists and molecular biologists, the origin an early history of maize is still subject of debate. One of the most accepted theories proposes that maize descends
___________
from an annual species of Teosinte (Zea mays ssp. parviglumis), native to the Balsas River Valley of southern Mexico (Piperno and Flannery, 2001). Additional research suggests that maize was domesticated approximately 7,500 years ago in central or southern Mexico (Hilton and Gaut, 1998). Maize was a staple food for the Mayan and Aztecan civilizations and played also an important role in their cultural traditions and religious beliefs. Maize was also important for the pre-Columbian cultures of South America who depended heavily on maize as source of calories (Mesa, 1957).
Christopher Columbus wrote in his journal on October 16 1492, 4 days after his first landing in San Salvador (eastern Bahamas), that the people who inhabited the islands cultivated maize, which he recorded as panizo grass (Morison, 1963). Columbus transported maize seeds in his following expeditions, and the first European description of maize appeared in 1494. Maize was initially cultivated en European gardens as an ornamental plant, but soon its value as food was recognized (Purseglove, 1972). Spaniard and Portuguese explorers spread maize during their voyages. Maize was
reported in China in 1573 (Purseglove, 1972). Maize is now grown around the world and a crop of maize is harvested somewhere every month of the year (Mangelsdorf and Reeves, 1939).
Maize is a very variable species. One of the earliest systems to classify maize was based on its separation in six groups: pop, flint, flour, dent, sweet and pod
(Sturtenvant, 1899). Except from pod maize, the separation in these groups is based on the composition and characteristics of the endosperm of the kernel (Glover and Mertz, 1987).
3
The Kernel of Maize
The grain or kernel is the main harvested product of maize. Maize kernels are produced in the female inflorescence or ear. The kernel of maize is botanically classified as a caryopsis and it is composed of three main parts: embryo, endosperm, and pericarp (Watson, 2003). The pericarp is the outermost cover of the kernel and constitutes about 5-6 % of the kernel dry weight. The embryo comprisesall the tissues that will give rise to the seedling structure after germination and constitutes approximately 1.1 % of the kernel weight. The endosperm is the main storage tissue of the kernel and constitutes up to 85% of the kernel weight (Watson, 2003).
Endosperm
Because of its function as an storage tissue, the endosperm of cereals is an invaluable renewable source of food for humankind (Olsen, 2004). The endosperm of angiosperms is a unique triploid tissue originating after a male gamete fertilizes the diploid central cell in a parallel process to the fertilization of the egg cell that gives origin to the diploid zygote (Nawaschin, 1898; Guignard, 1899). The most recognized role of the endosperm is the synthesis and accumulation of storage products to nurture the embryo during initial stages of germination and seedling development. Reserves in the endosperm are accumulated in the form of lipids, carbohydrates and proteins. The proportions of these components vary between species (Demason, 1997). In the case of maize, the main structural component of the endosperm is starch, accounting for about 71% of the grain (Prassana et al., 2001). The protein fraction represents 9.5% of the
kernel, while other plants like soybean or beans contain 38% and 23% of protein, respectively (National Research Council, 1988).
The Prolamins of Maize: The Zeins
According to the classification system of cereal proteins proposed by Osborne et al. (1914), there are four classes of proteins depending on their solubility: albumins (proteins soluble in pure water), globulins (protein soluble in diluted salt solutions but insoluble in pure water), prolamins (proteins soluble in 70% ethanol), and glutelins (proteins soluble in diluted acid or base). Approximately 60% of the proteins present in the endosperm of maize belong to the prolamin type (also known as zeins), while glutelins account for 34%, and albumins and globulins for 3% each. The zeins are particularly deficient in the essential amino acids lysine and tryptophan, and their prevalence in the endosperm is the primary cause of poor protein quality in maize (Vasal, 2000). Lysine is the first limiting amino acid in the diets of non-ruminants and humans, followed by tryptophan and threonine (Shimada and Cline, 1974). Increasing the levels of the nutritionally limiting amino acids is an important objective of plant breeding programs.
Based on their related structure and differential solubility, the zeins are classified in α-, β-, δ-, and γ-zeins (Coleman et al., 1997; Esen, 1987). The α-zein is the most abundant class of the zeins comprising about 70% of the total. When separated on SDS-polyacrilamide gels, the α-zeins appear as two bands of apparent molecular masses of 19- and 22 kDa. These bands correspond to a mixture of several polypeptides, because
5
the α-zeins are a multigene family. The γ-zeins are the second most abundant class of zeins making up about 20% of the total (Thompson and Larkins, 1989). The γ-zeins are cisteine-rich proteins that in gels show approximate molecular size of 16-, 27- and 50-kDa (Coleman et al., 1997; Woo et al., 2001). The only member of the β-zein class is a polypeptide of approximately 15 kDa, accounting for about 5% of the total zein content (Thompson and Larkins, 1989). The δ-zeins are evidenced as two bands of 10- and 18- kDa. The δ-zeins account for less than 5% of the total zeins (Thompson and Larkins, 1989).
The mRNAs of the zeins are detected in the endosperm tissue from 8-10 dap and reach their maximum expression at approximately 16-18 dap (Dolfini et al., 1992). The same pattern of gene expression is shared by several zein genes, suggesting a
coordinated regulation of transcription (Dolfini et al., 1992).The zeins are synthesized by membrane-bound polyribosomes and transported into the lumen of the endoplasmic reticulum where they are packaged in protein bodies during endosperm development (Lending and Larkins, 1989). The spatial distribution of the zeins is crucial for the formation and maturation of the protein bodies (Kim et al., 2002). The γ-zeins and β-zeins seem to be important in leading the formation of protein bodies by associating with α-zeins and δ-zeins and promoting their accumulation in the lumen of the rough endoplasmic reticulum (Bagga et al., 1997; Coleman et al., 1996; Geli et al.,1994; Kim et al., 2002; Lee, 1998; Woo et al., 2001). The 50- and 27-kDa γ-zeins remain at the surface of the protein bodies, while the 15-kDa β-zein and the 16-kD γ-zein would be
important in determining the organization of α-zeins and δ-zeins in the core of the protein body (Lending and Larkins, 1989; Woo et al., 2001).
The α-zeins are encoded by a large multigene family that can be subdivided into four subfamilies: z1A, z1B, and z1D (all three 19 kDazeins), and z1C (22-kDa α-zein) according to DNA sequence similarity (Song and Messing, 2002; Song et al., 2001). The inbred B73 carries 25 genes for the three 19 kDa α-zein subfamilies. The z1A and z1B subfamilies share clusters of genes in chromosomes 4S and 7S. The z1D is the smallest subfamily and is located on chromosome 1L. (Song and Messing, 2002; Woo et al., 2001). B73 carries 15 genes of the z1C subfamily that are located in chromosome 4S (Song and Messing, 2003). Variable copy number has been observed for the α-zein subfamilies in different genetic backgrounds (Song and Messing, 2003). The variability in the gene structure of the α-zeins may be explained by mechanisms of intergenic exchange, amplification, and transposition (Viotti et al., 1985). Despite the high number of α-zein genes in the maize genome, only a small percentage of them are expressed in the endosperm, while the rest are inactive or expressed at low levels (Song and Messing, 2003; Woo et al., 2001).
The gene organization of the β-, γ, and δ-zeins is simpler than the one of the α-zeins. The 15 kDa β-zein gene is located on chromosome 6S (bin 6.01) (Weerakoon et al., 1993). The gene encoding the 10kDa d-zein is located in chromosome 9L near the centromere (bin 9.03) (Benner et al., 1989), and the 18 kDa δ-zein gene mapped to the chromosome 6L (bin 6.04) (Swarup et al., 1995). The gene encoding the 16 kDa γ-zein
7
was mapped to chromosome 2L (bin 2.07), and the gene for the 50 kDa γ-zein to chromosome 7L (7.05) (Woo et al., 2001). The 27 kDa γ-zein has one or two gene copies, depending on the genetic background, located in tandem in chromosome 7 (bin 7.02-7.05) (Das and Messing, 1987; Geetha et al., 1991).
The Opaque2 Transcription Factor
The mutant gene opaque2 (o2) was initially discovered by Jones and Singleton in the early 1920s (Emerson et al., 1935). However, it was not until the 1960s that Mertz and coworkers at the University of Purdue noticed that the presence of this recessive allele in a homozygous form caused a significant increase in the proportion of lysine and tryptophan in the grain (Mertz et al., 1964). Plant breeders started introgression of the o2 allele into different varieties, but they soon found that undesirable traits were associated with the presence of this gene. The kernel turned very soft and floury, the yield
decreased 8-15% and the plants were more susceptible to fungi and insects (National Research Council, 1988). The floury endosperm of o2 materials was found directly associated with the reduction in the proportion of α-zein proteins. The O2 gene encodes a basic leucine-zipper (bZIP) class transcription factor (Schmidt et al., 1990). It has been shown that O2 in maize endosperm induces the transcription of α-zeins and β-zeins by binding specific sequences in their promoter elements (Schmidt et al., 1992; Cord-Neto et al., 1995). Therefore, homozygous plants for a non-functional o2 allele show a remarkable reduction in the proportion of zeins. It has been postulated that fewer zeins cause the development of smaller protein bodies (one-fifth of the normal size) that alter
the packing of the starch fraction during seed desiccation (Coleman et al., 1997).
However, due to the duplication and amplification events of the 22 kDa α-zein genes in the maize genome, some genotypes carry copies of α-zein genes that do not require the O2 protein as transcriptional activator (Song et al., 2001). The O2 protein could also interacts with a prolamin box binding factor (PBF) to regulate the expression of zein genes that lack O2 binding sites (Vicente-Carbajosa et al., 1997). The O2 protein also influences the expression of other genes such as b-32 (a type I ribosome inactivating protein), and CyPdk1(a cytosolic pyruvate orthophosphate dikinase) (Bass et al., 1992; Schmidt et al, 1992; Maddaloni et al., 1996).
Additional research at the International Maize and Wheat Improvement Center (CIMMYT) discovered that the soft endosperm, caused by o2, could be restored into normal type endosperm by the activity of some genes called modifiers (Bjarnason and Vasal 1992). The genotypes that were developed containing the o2 modifiers were called ‘quality protein maize’ (QPM), because they retain higher levels of lysine and
tryptophan when compared to normal maize materials (Vasal, 2000). Several groups have attempted to identify those genes responsible for the endosperm modification, but no single modifier gene has been fully characterized to date. Pollacsek and coworkers genetically proved the presence of two genes causing o2 suppression (Pollacsek, 1970; Pollacsek et al., 1972). Genetic analyses on QPM material suggest that there are two independent loci controlling endosperm modification (Lopes and Larkins, 1995). Bulk segregant analysis (BSA) of segregating populations developed from o2 and modified varieties found two loci associated with the modification of soft endosperm (Lopes et al.,
9
1995). Some studies suggest that the γ-zeins and their regulation are involved in the modification of o2 endosperm (Geetha et al., 1991; Burnett and Larkins, 1999).
QPM genotypes have been introduced to different production systems in several tropical and sub-tropical countries, where their quality advantages have been
acknowledged (National Research Council, 1988). Nevertheless, the actual combination of genetic features that define a QPM line is yet to be established. A detailed knowledge about the genomic location of the genes, the characterization of the modifier genes and specific alleles involved, in addition to expression profiles and regulatory aspects will provide fundamental information to continue increasing the benefits offered by maize.
CHAPTER II
PHENOTYPIC CHARACTERIZATION OF ENDOSPERM MODIFICATION
AND AMINO ACID CONTENTS
Overview
Homozygous o2 kernels have increased levels of lysine and tryptophan. Unfortunately, the associated soft texture of the o2 kernels causes poor yield and susceptibility to diseases and insects. Breeding programs have restored the desirable ratio of hard vs. soft endosperm in o2 genotypes developing modified endosperm versions called Quality Protein Maize (QPM). QPM germplasm, developed mostly by the International Maize and Wheat Improvement Center, is currently utilized in breeding programs worldwide and has been demonstrated to be competitive in yield trials when compared to local checks. To contribute to an increased understanding of the genetics of endosperm modification, a population of 146 recombinant inbred lines (S5 to S7) derived from a cross between the o2 inbred line B73o2 and the QPM inbred line
CML161 was evaluated in two Texas locations from 2004 to 2006. Four traits related to endosperm texture showed significant effect of the inbred lines, high heritability
estimates (h2 = 0.83-0.94) and high genetic correlations (GC) among them (GC= 0.81-1.0). Relative content of the essential amino acids lysine, tryptophan and methionine also showed significant effects of the lines, genetic correlations GC = 0.63-0.71, and
heritabilities h2 = 0.71-0.80. Negative correlation was observed between endosperm texture traits and amino acid content. Nevertheless, favorable responses to selection
11
would be expected for both traits if selection strategies include monitoring of both endosperm texture modification and relative content of the essential amino acids.
Introduction
The structure and content of the maize endosperm influences the expression of traits targeted for genetic improvement such as grain yield (Salamini et al., 1970; Vyn and Tollenaar, 1998), grain quality (Mazur et al., 1999), suitability for industrial processing (Paulsen and Hill, 1985; Chandrashekar and Mazhar, 1999), ruminal
digestibility (Corona et al., 2006), and tolerance to mycotoxin accumulation (Bhatnagar et al., 2003). The protein fraction constitutes only 8-9% of the endosperm (Lawton and Wilson, 1987), while starch accounts for about 71% of the kernel (Prasanna et al., 2001). In normal maize, 50 to 70% of the endosperm proteins are of the prolamin type (zeins). The zein proteins are particularly deficient in the essential amino acids lysine and tryptophan. The high proportion of zeins in the endosperm is the primary reason for the poor protein quality of maize (Vasal, 2000).
Several mutations, both spontaneous and induced, have been identified affecting the composition of the maize endosperm. Among them, those of the Opaque2 (O2) gene are the most extensively studied (Lazzari et al., 2002; Henry et al., 2005). The O2 gene encodes a leucine-zipper class transcription factor (Schmidt et al., 1990) that induces the transcription of a group of α-zeins and influences expression of other genes such as b-32 (a type I ribosome inactivating protein) and CyPdk1 (a cytosolic pyruvate
1996). In the 1960s, o2 received considerable attention as it was associated with a significant increase in the proportion of lysine and tryptophan in the grain (Mertz et al., 1964). Plant breeders transferred the o2 allele into different germplasm, aiming to improve nutritional quality, but undesirable traits were associated with the presence of the o2 allele. In particular, the kernel became soft and more prone to mechanical damage, the yield decreased by 8-15%, and the plants were more susceptible to fungi and insects (Lambert et al., 1969; Salamini et al., 1970).
Fortunately, the soft endosperm of o2 maize can be altered to resemble normal endosperm by the activity of modifier genes (Paez et al., 1969; Vasal, 1971). Modified o2 genotypes developed at the International Maize and Wheat Improvement Center (CIMMYT) are called Quality Protein Maize (QPM) (Vasal, 2000). The general strategy for the development of QPM initially included backcrossing to develop o2 varieties and hybrids from normal genotypes, and later, recurrent selection to develop specific genetic backgrounds that restored the vitreous portion of the endosperm. QPM genetic pools, populations and inbred lines have resulted from these breeding efforts. Protein quality testing during the breeding process was used in an attempt to avoid excessive losses of lysine and tryptophan. In general, QPM genotypes retain higher levels of lysine and tryptophan than normal maize materials (Ortega and Bates, 1983). Yield trials have shown that some QPM germplasm can be competitive with local checks (Pixley and Bjarnason, 1993). QPM genotypes have been introduced to production systems in several tropical and sub-tropical countries, where their nutritional advantages have been acknowledged (National Research Council, 1988; Vietmeyer, 2000).
13
Nevertheless, there are major challenges to develop and use QPM germplasm because of the unknown number of modifier genes required to restore the desired hard-to-soft endosperm ratio, the need to evaluate the grain quality during the breeding
process, and the effects specific to the genetic background (Belousov, 1987; Ciceri et al., 2000; Huang et al., 2004; Gibbon and Larkins, 2005).
The objectives of this study were to utilize a population of recombinant inbred lines derived from an o2 line and a QPM line to estimate variance components,
phenotypic and genotypic correlations, heritabilities and to identify selection strategies for endosperm texture modification and relative content of the essential amino acids lysine, tryptophan and methionine.
Materials and Methods
Plant Material
A population of RILs was derived from a cross between B73o2 and CML161. CML161 is an exotic subtropical inbred classified as QPM and released by CIMMYT. B73o2 is an opaque2 conversion of B73, an Iowa Stiff Stalk inbred. A group of 146 RILs were used for field trials (S5, S6, or S7 generations), and genotypic analysis (S6
Field Design
The RIL population was evaluated in two Texas locations during the years 2004, 2005, and 2006. The College Station (CS) location (latitude 30o 37, elevation 96 masl) at the Texas Agricultural Experiment Station in Burleson County has a humid subtropical climate and 99.3 cm of annual precipitation on average, while the Weslaco (WE) location (latitude 26o 09, elevation 22.5 masl) has a semiarid subtropical climate and 58.4 cm of annual precipitation on average (Griffiths and Bryan, 1987). The combination of location and years produced the environments WE04 (Weslaco in 2004), WE05 (Weslaco in 2005), CS05 (College Station in 2005), CS06A (College Station in 2006 first planting) and CS06B (College Station in 2006 second planting). A randomized complete block design was used in all environments: WE04 (one replication), WE05 (three replications), CS05 (two replications), CS06A (two replications), and CS06B (two replications). Each plot consisted of one row 5.2 m in length, with 0.76 (CS) or 1 m (WE) of distance between rows. Trials received common management practices according to each research station. At least 10 plants per plot were self-pollinated. All plots were manually harvested.
Endosperm Texture Modification
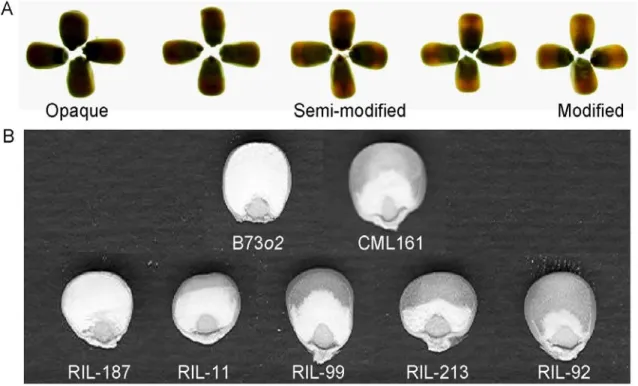
Endosperm texture was evaluated with four different measurements (TEXT-F, TEXT-L, OPAC and VITR) associated to the extent of modification of the endosperm in the RIL population. Endosperm texture (TEXT) was a visual rating from 1 (modified = flint-type round crown kernel and vitreous appearance) to 5 (opaque = dent-type kernels
15
with very high proportion of floury endosperm) with increments of 0.5. A value of TEXT was assigned to all the ears self-pollinated and harvested from each plot. Data was taken independently by one observer in the field during harvesting (TEXT-F), and two additional observers in the laboratory before shelling (TEXT-L). Opacity (OPAC) was scored in a light box using a scale 1 (modified = light passes trough the whole kernel) to 5 (opaque = no light transmission due to completely opaque kernels)
(Bjarnason and Vasal, 1992). For the trait vitreousness (VITR), an image analysis-based method was adapted (Leyva-Ovalle et al., 2002). Briefly, eight kernels from bulked ears per plot were arranged embryo down in a metallic grid and sanded with a 114 mm orbital sander (Hitachi Koki, Tokyo, Japan ), until approximately one third of the wide of the kernel was removed. An 8-bit black and white image was obtained by scanning the kernels in a tabletop scanner (Hewlett Packard ScanJet 3970, Palo Alto, CA) using a dark blue background. The negative of the image was used to estimate the area of soft (black) and hard (white) endosperm by the pixel counting option of the UTHSCSA Image Tool 3.0 software (Wilcox et al., 2002). VITR was defined as the percentage of the area of hard endosperm to the total endosperm area.
Amino Acid Composition
Tryptophan (Trp), Methionine (Met) and Lysine (Lys) were quantified using a microbiological method based on E. coli strains auxotrophic for Trp, Met or Lys as described by Scott et al. (2004). Kernels from bulked ears per plot were ground and
measured in triplicate. The concentration of Met, Trp or in each analysis was calculated using linear regression onto a line fitted to the standards.
Statistical Analysis
Analysis of variance (ANOVA) was conducted within and across environments for each trait separately, considering all effects in the statistical model as random, in PROC GLM of SAS 9.1 (SAS Institute, 2003). Genotype least square means were estimated per environment for each trait. Homogeneity of variances between
environments was tested by the Levene’s test (Glass, 1966). The Best Linear Unbiased Prediction (BLUP) procedure was used to predict the effects of each RIL across
environments using univariate mixed model analysis in PROC MIXED of SAS 9.1 (SAS Institute, 2003). Heritabilities across environments for each trait were calculated on a plot and entry-mean basis using univariate mixed model analysis (all effects random) in PROC MIXED of SAS 9.1 (Holland et al., 2003; SAS Institute, 2003). Because VITR, Lys, Trp and Met measurements were taken on a single repetition in 2 or 4 locations, the heritability estimates are presented as repeatabilities. The Phenotypic (PC) and genotypic correlations (GC) among pair of traits were computed across environments using
multivariate restricted maximum likelihood (REML) estimation in PROC MIXED (Holland, 2006; SAS Institute, 2003). The relationship between traits and RILs was assessed by Single Value Decomposition (SVD) of standardized variables using Biplot v1.1 (Lipkovich and Smith, 2002). Data were presented as a biplot with two principal
17
components. Direct response to selection and correlated response were calculated according to Falconer and Mackay (1996).
Results and Discussion
A population of RILs was derived from crossing an o2 temperate line (B73o2) with a QPM tropical line (CML161). Inbred CML161 is a high yielding QPM line commonly used in tropical and semi-tropical breeding programs where it has been used in multiple hybrid combinations (Prasanna et al., 2001; Xingming et al., 2001; Bhatnagar et al., 2003). Inbred B73 has become the most popular maize line in maize genomic studies and played a key role in the development of U.S hybrids.
Trait Means and Variation
Significant (p < 0.001) main effects of the RILs were observed in the ANOVA for all traits (Table 2.1). Significant (p < 0.001) main effects of the environments were observed for TEXT-L, OPAC, VITR, Lys, Trp and Met. In addition, significant
genotype x environment interaction (GEI) (p < 0.001) was observed for the traits TEXT-F, TEXT-L, and OPAC. Significant GEI have been reported for other QPM materials for endosperm modification and other traits such as grain yield, protein in grain, Trp in grain and protein (Pixley and Bjarnason, 2002; Lou et al., 2005). In normal maize it has been shown that environmental factors like availability of nutrients in the soil, water stress and heat stress influence the process of kernel filling and the accumulation of
Table 2.1. Combined analysis of variance for endosperm texture in the field (TEXT-F), endosperm texture in the laboratory (TEXT-L), opacity (OPAC), vitreousness (VITR), lysine content (Lys), tryptophan content (Trp), and methionine content (Met) in an o2 x QPM RIL population evaluated in Texas between 2004 and 2006. Trait Sources of variation df Mean square P > F Variance component TEXT-F Env 2 0.0924 0.7328 _ (score 1-5) Rep/Env 3 0.4042 0.2547 _ Lines 142 6.3021 <.0001 1.150 Env*Lines 278 0.4748 <.0001 0.101 TEXT-L Env 3 3.2146 <.0001 0.009 (score 1-5) Rep/Env 5 0.5522 0.2038 _ Lines 142 4.6312 <.0001 0.535 Env*Lines 419 0.528 0.0001 0.072 OPAC Env 3 27.7953 <.0001 0.121 (score 1-5) Rep/Env 4 0.526 0.088 Lines 142 4.7937 <.0001 0.719 Env*Lines 421 0.435 <.0001 0.104 VITR Env 1 1223.94 <.0001 9.123
(%hard/total area) Lines 142 264.0364 <.0001 114.091
Lys Env 3 4.15 <.0001 0.027
(rel. units) Lines 142 1.3461 <.0001 0.256
Trp Env 3 179.7089 <.0001 1.260
(rel. units) Lines 142 10.4832 <.0001 2.121
Met Env 3 53.6035 <.0001 0.374
19
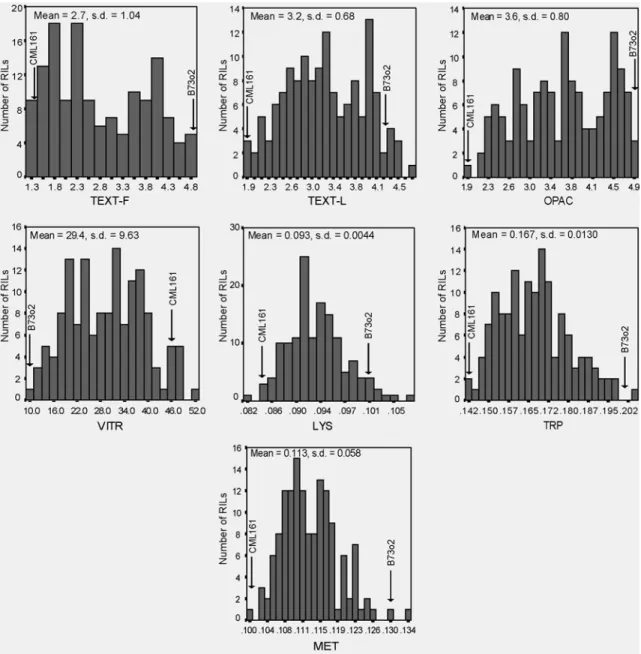
storage proteins (Hamilton et al., 1951; Hadi, 2004; Monjardino et al., 2005). The relative content of the amino acids lysine, tryptophan and methionine were measured. The parental line B73o2 showed consistently higher values of TEXT-F, TEXT-L, OPAC, Met, Trp and Lys; whereas CML161 had higher values of VITR (Fig. 2.1, Fig.2.2). As expected, B73o2 had consistent and significantly softer endosperm than CML161.
The mean relative Lys content was 0.100 for B73o2 and 0.087 for CML161. The mean relative Trp content was 0.200 for B73o2 and 0.136 for CML161. The mean relative Met content was 0.129 for B73o2 and 0.101 for CML161. Inbred B73o2 had consistently higher relative content of these amino acids than inbred CML161. These results are consistent with previous estimates were B73o2 had high values of Lys, Trp and Met (Scott et al., 2004).
The frequency distribution of each trait in the population of RILs approached a normal distribution for all traits except for TEXT-F, which showed bimodal distribution with peaks towards the semi-modified and opaque categories, and for OPAC, which intermediate categories had fewer individuals (Fig. 2.2). Transgressive segregation was not significantly observed for any trait. Both parental inbreds were among the groups with most extreme expression of these traits. Transgressive segregation has been currently observed in several traits in mapping populations (DeVicente and Tanskley, 1993; Rieseberg, 1999). The nature of the traits addressed in this research and the selection of two inbreds with very extreme expression of endosperm traits could explain the lack of transgressive segregation.
Figure 2.1. Endosperm texture modification. (A) Photograph of backlit kernels showing segregation of the trait opacity (OPAC) in the F2 of B73o2 x CML161. (B) Kernel sections (8-bit images) of B73o2, CML161 and five recombinant inbred lines used for measuring the trait vitreousness (VITR).
21
Figure 2.2. Frequency distributions of endosperm texture modification (TEXT-F, TEXT-L, OPAC and VITR), and amino acid content (Lys, Trp and Met) in an o2 x QPM RIL population evaluated in Texas between 2004 and 2006. Mean values of the parents B73o2 and CML161 are showed by arrows.
The Levene’s test suggested homogeneity of variances for all traits between the different environments except for Trp, in which the two CS locations showed a shift in the distribution towards a higher mean value. Both TEXT-F and TEXT-L correspond to visual estimates of the endosperm texture of whole ears measured under different
conditions by different observers. However, the test for homogeneity of variance suggested heterogeneous variances between TEXT-F and TEXT-L, and therefore they were treated as different traits.
Given the contrasting differences between these two inbreds, CML 161 and B73o2, the amount of variation observed was high for all the traits measured. Hence, this RIL population was used as mapping population for a subsequent study (Chapter III).
Phenotypic Correlations, Genotypic Correlations and Traits Biplot
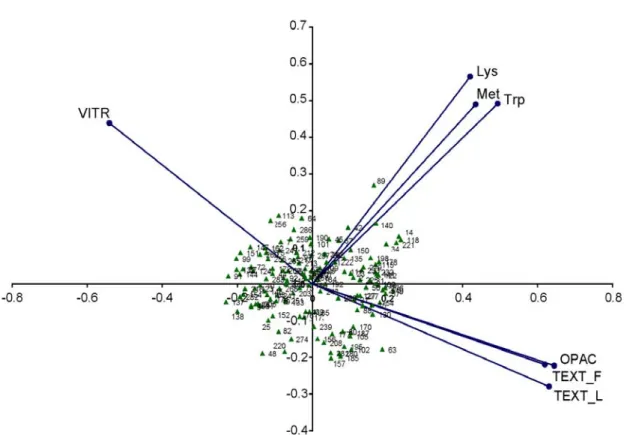
It has been suggested that the BLUP procedure is useful to analyze unbalanced data (Bernardo, 2002). Since not all traits were evaluated in all the environments, BLUP predictions were used for SVD of traits. In SVD biplots, an angle of 90° between any two trait vectors suggest that the traits are independent, an angle of >90° indicates negative correlation, and an angle of <90° suggests a positive correlation. SVD illustrated the negative relationship between the opacity-based measurements (TEXT and OPAC) and the vitreousness-based measurement (VITR). In addition, the SVD biplot showed how the three amino acid traits are closely correlated and their positive but low correlation with the endosperm texture traits (Fig. 2.3).
23
Figure 2.3. Single value decomposition biplot of first two principal components for endosperm texture in the field (TEXT-F), endosperm texture in the laboratory (TEXT-L), opacity (OPAC), vitreousness (VITR), lysine content (Lys), tryptophan content (Trp), and methionine content (Met) in an o2 x QPM RIL population evaluated in Texas between 2004 and 2006.
The phenotypic correlations between all the four texture-related traits ranged between 0.66 and 0.75. The genotypic correlations ranged between 0.81 and 1.00. The phenotypic correlation between TEXT-F and TEXT-L was 0.70 and the genetic
correlation with TEXT-F, TEXT-L and OPAC (Table 2.2, Fig. 2.3). The phenotypic correlation between Lys and Met was 0.41, whereas the genotypic correlation was 0.63. The phenotypic correlation between Lys and Trp was 0.62, and the genetic correlation was 0.71. The phenotypic correlation between Trp and Met was 0.54, and the genetic correlation was 0.68. Scott et al. (2004) analyzed a set of opaque and QPM lines and hybrids and observed a general positive correlation between lysine and tryptophan, but a negative correlation with methionine. The positive correlation among amino acids content in this work could relate to the observation that the o2 parent contained higher relative amounts of lysine, tryptophan and methionine while the modified parent
CML161 showed lower content of these amino acids. In addition, the nature of diversity displayed by the RIL population used in this study and that displayed among the lines used by Scott et al (2004) is different.
In the population of RILs derived from B73o2 x CML161, there was a positive correlation between endosperm opacity and relative content of lysine, tryptophan and methionine. The relative values of these amino acids decreased as the inbred lines tended from opaque towards flint/dent modified kernels. However, there were RILs with high content of amino acids and degree of modification suggesting the possibility to select for both simultaneously. Contradictory reports have described both neutral (Pixley and Bjarnason 2002; Bantte and Prasanna, 2004) and negative (Paez et al., 1969; Robutti et al., 1974a; Wessel- Beaver 1985) correlations for endosperm
25
Table 2.2. Phenotypic (PC) and genotypic correlation (GC) estimates for endosperm texture in the field (TEXT-F), endosperm texture in the laboratory (TEXT-L), opacity (OPAC), vitreousness (VITR), lysine content (Lys), tryptophan content (Trp), and methionine content (Met) in an o2 x QPM RIL population evaluated in Texas between 2004 and 2006.
TEXT-F TEXT-L OPAC VITR Lys Trp
PC GC PC GC PC GC PC GC PC GC PC GC TEXT-F _ _ SE TEXT-L 0.695 0.948 _ _ SE 0.027 0.018 OPAC 0.782 0.940 0.673 1.009 _ _ SE 0.023 0.017 0.028 0.013 VITR -0.675 -0.811 -0.664 -0.947 -0.754 -0.942 _ _ SE 0.022 0.032 0.038 0.032 0.030 0.057 Lys 0.318 0.455 0.236 0.429 0.322 0.503 -0.180 -0.297 _ _ SE 0.057 0.083 0.053 0.088 0.050 0.080 0.014 0.045 Trp 0.390 0.551 0.307 0.576 0.413 0.632 -0.343 -0.325 0.620 0.713 _ _ SE 0.054 0.073 0.051 0.073 0.048 0.065 0.004 0.007 0.022 0.025 Met 0.355 0.540 0.242 0.524 0.271 0.509 -0.207 -0.305 0.412 0.633 0.538 0.681 SE 0.055 0.081 0.054 0.085 0.093 0.146 0.008 0.024 0.038 0.047 0.014 0.016
modification and amino acid content. Here, grain yield analysis was not included although there is evidence for lack of phenotypic correlations between yield and
endosperm modification, but negative correlation between yield and amino acid content (Pixley and Bjarnason, 2002).
Broad-Sense Heritability and Gain from Selection
The heritabilities (entry mean basis) calculated across environments for TEXT-F, TEXT-L and OPAC were 0.94, 0.90 and 0.92, respectively. The heritabilities (plot basis) calculated for TEXT-F, TEXT-L and OPAC were 0.75, 0.54 and 0.66, respectively (Table 2.3). Due to the intrinsic nature of the measurements, only one repetition per environment was used for the quantification of VITR and amino acid content (Lys, Trp and Met). This could introduce a bias in the estimation of heritabilities, hence these estimates are referred as estimates of repeatability. The estimates of repeatability for VITR were 0.83 (entry mean basis) and 0.71 (plot basis). Repeatabilities on plot basis calculated across environments for Lys, Trp and Met were 0.44, 0.50 and 0.38,
respectively. Repeatabilities on entry mean basis calculated across environments for Lys, Trp and Met were 0.76, 0.80 and 0.71, respectively (Table 2.3). When inbred lines are developed from an F2 population, the variance among inbred lines is equal to twice the
original additive variance in the starting F2 population (Bernardo, 2002). Therefore, the
heritability/repeatability estimates calculated from inbred lines could be higher than estimates made using other mating designs.
27
Table 2.3. Heritability and repeatability estimates for endosperm texture in the field (TEXT-F), endosperm texture in the laboratory (TEXT-L), opacity (OPAC), vitreousness (VITR), lysine content (Lys), tryptophan content (Trp), and
methionine content (Met) in an o2 x QPM RIL population evaluated in Texas between 2004 and 2006.
Trait (environments,
repetitions) Plot basis Entry mean basis TEXT-F (e=3, r=6) 0.748 0.935 SE 0.027 0.010 TEXT-L (e=4, r=9) 0.536 0.897 SE 0.036 0.014 OPAC (e=4, r=8) 0.659 0.924 SE 0.032 0.107 VITR (e=2, r=2) 0.707 0.829 SE 0.043 0.030 Lys (e=4, r=4) 0.435 0.755 SE 0.045 0.034 Trp (e=4, r=4) 0.503 0.802 SE 0.043 0.027 Met (e=4, r=4) 0.377 0.708 SE 0.046 0.040
With the estimates of heritability and the additive variance it is possible to predict the response to selection (R) (Falconer and Mackay, 1996). The direct selection response was calculated using a selection intensity of 20%. As expected, the results suggested that a substantial gain can be expected when phenotypic selection is used for endosperm texture. Gains were higher when entry means were used as selection units. The maximum estimated gain was about 40%, for the trait TEXT-F with entry means selection (Table 2.4). For amino acid content, the gain was lower with a maximum of 7.7% of gain for Trp. Calculated gain in Lys was 4.7%. As for endosperm texture, selection based on entry means produced higher gain in amino acid content (Table 2.4). As mentioned before, amino acid content and endosperm modification traits were
negatively correlated in the population of RILs. The correlated response to selection (CR) can be predicted to anticipate the change in amino acid content when selecting for endosperm modification (Table 2.5). Selection for any of the four texture-related traits produced a decrease in the content of the three amino acids. Approximately 3% decrease in the content of lysine was observed when selecting for endosperm texture (Table 2.5).
Studies of the genetic control of the observed variation on amino acid content and endosperm texture in the population of RILs will be described in chapter III. The results suggested that there are both common and independent genomic regions controlling endosperm texture and amino acid content. As a consequence, if the correlated loss in amino acid content caused by selection for endosperm is found to be significant for the purposes of the breeding program, then evaluation for both traits must be carried out when developing QPM genotypes (Wessel-Beaver at al., 1985). However,
29
Table 2.4. Predicted response to selection for endosperm texture in the field (TEXT-F), endosperm texture in the laboratory (TEXT-L), opacity (OPAC),
vitrousness (VITR), lysine content (Lys), tryptophan content (Trp), and methionine content (Met) with both plot basis and entry means-based selection units.
Trait Selection Response†
Selection Response as percentage of the mean
plot basis
Entry mean
basis plot basis entry mean basis
--- %--- TEXT-F 0.92 1.03 35.49 39.68 TEXT-L 0.53 0.69 16.51 21.36 OPAC 0.68 0.81 18.90 22.39 VITR 8.89 9.63 30.05 32.52 LYS 0.33 0.44 3.55 4.67 TRP 1.02 1.29 6.12 7.72 MET 0.43 0.58 3.78 5.18
Table 2.5. Correlated response of lysine content (Lys) when selecting for endosperm texture in the field (TEXT-F), endosperm texture in the laboratory (TEXT-L), opacity (OPAC), vitreousness (VITR), lysine content (Lys), tryptophan content (Trp), and methionine content (Met) with entry means-based selection units. (GC= genetic correlation).
Selecting
for GCX-Lys Entry mean basis
---%---
TEXT-F 0.455 0.31 3.35
TEXT-L 0.429 0.29 3.09
OPAC 0.503 0.34 3.68
VITR -0.297 -0.19 -2.06
selection for amino acid content based on direct measurements of each amino acid is not a feasible alternative for most breeding programs (Prasanna et al., 2001). Alternatives such as specific calibrations of Near Infrared Reflectance Spectroscopy (NIRS) for grain quality traits have shown that thousands of samples can be processed in a relative short period of time at reasonable cost (Fontaine et al., 2002; Montes et al., 2006).
Conclusion
Sufficient genetic variation for endosperm and amino acids content was observed in this study. This variation supported intermediate to high heritabilities and the
existence of RILs with desirable combination of high amino acids content and
endosperm vitreousness. The development of segregating population between opaque with high amino acids content and QPM material could be a breeding approach to
31
enhance further the protein quality of QPM lines (e.g., CML161). The lack of significant transgressive segregation may be the consequence of using parents with very extreme expression of these traits. Parents with intermediate expression should provide
segregating populations showing transgressive segregation.
High heritabilitilies and genetic correlations suggest high direct and indirect genetic gain possible by single traits. Nevertheless, negative correlation between
desirable endosperm traits and amino acids contents may indicate the need of monitoring both types of traits and the use of selection indices during the inbreeding and selection process.
The quantification of endosperm vitreousness by image analysis was conducted successfully and can be used in breeding programs. It was highly correlated with visual endosperm ratings but some differences were appreciated among RILs ranking.
Based on the results presented here, it may be possible to further enhanced the protein and nutritional value of QPM by measuring endosperm characteristics and levels of Lys, Trp, and Met during breeding and selection of recombinant lines (i.e.,
conventional or double haploids) and select those having vitreous endosperm and high levels of these amino acids.
CHAPTER III
QUANTITATIVE TRAIT LOCI FOR ENDOSPERM MODIFICATION AND
AMINO ACID CONTENTS
Overview
The deficient protein quality of corn grain can be improved by replacing the normal Opaque2 (O2) alleles with non-functional mutant alleles o2. Unfortunately, o2 alleles are associated with a very soft endosperm texture, poor yield and susceptibility to diseases and insects. Plant breeders have been able to restore a desirable ratio of hard to soft endosperm in o2 germplasm. These modified genotypes are known as Quality Protein Maize (QPM). Neither the mechanism nor the genetic components by which the modification of the endosperm in QPM lines occurs are well understood. Using a
population of Recombinant Inbred Lines (RILs), derived from a cross between an o2 line and a QPM line and a novel evaluation method for endosperm modification, quantitative trait loci (QTL) were mapped for traits related to the modification of endosperm texture and the content of the essential amino acids lysine, tryptophan and methionine. For endosperm texture traits, QTLs clusters were detected on chromosomes 3, 5, 6 and 8 accounting together for 62-68% of the observed variation. For traits related to amino acid contents, QTLs clusters were located on chromosomes 7 and 8 that explained up to 39% of the observed variation. The elucidation of the genetic mechanisms of the
33
information and important tools to plant breeders as well as plant scientists interested in improving the quality of the cereal seeds.
Introduction
Maize, a major crop, is a source of food, feed, and raw materials for several industries. The grain is the major harvested product of maize. The main components of the kernel are the endosperm, the embryo, and the pericarp (Watson, 2003). The endosperm is a triploid tissue originating after a male gamete fertilizes the diploid central cell in a process parallel to the fertilization of the egg cell that gives origin to the diploid zygote (Olsen, 2004). The main role of the endosperm is the synthesis and accumulation of storage products to nurture the embryo during initial stages of
germination and seedling development (Costa et al., 2004). Reserves in the endosperm accumulate in the form of lipids, carbohydrates, and proteins. The structure and content of the endosperm affects traits targeted for genetic improvement such as grain yield (Salamini et al., 1970; Vyn and Tollenaar, 1998), grain quality (Mazur et al., 1999), suitability for industrial processing (Paulsen and Hill, 1985; Chandrashekar and Mazhar, 1999), ruminal digestibility (Corona et al., 2006), and tolerance to mycotoxin
accumulation (Bhatnagar et al., 2003).
Protein constitutes less than 10% of the kernel, while starch accounts for about 70% (Lawton and Wilson, 1987; Prasanna et al., 2001). In normal maize, 50-70% of the endosperm proteins are of the prolamin type (zeins). Zein proteins are often classified by differential solubility and mobility through gels as α-zein, β-zein, δ-zein, and γ-zein
(Coleman et al., 1997). Zeins accumulate in sub-cellular compartments derived from the endoplasmic reticulum known as protein bodies (Lending and Larkins, 1989). The zein fraction is particularly deficient in the essential amino acids lysine (Lys) and tryptophan (Trp). The high proportion of zeins in the endosperm is the primary reason for the poor protein quality of maize (Vasal, 2000).
Several genes affecting the composition and structure of the maize endosperm have been identified. The Opaque2 (O2) gene is one of the most extensively studied (Lazzari et al., 2002; Henry et al., 2005). Mertz et al. (1964) realized that maize
genotypes homozygous for the mutant allele o2 had a considerable higher content of Lys and Trp in the grain when compared to wild type genotypes. After this discovery, plant breeders started to introgress o2 alleles into different germplasm, trying to improve their nutritional quality, but undesirable traits were associated with o2. In particular, the kernel became soft and very prone to mechanical damage, the yield decreased 8-15%, and the plants were more susceptible to fungi and insects (Lambert et al., 1969; Salamini et al., 1970).
The O2 gene encodes a leucine-zipper class transcription factor (Schmidt et al., 1990) required for efficient transcription of a group of α-zeins and influences expression of other genes such as b-32 (a type I ribosome inactivating protein) and CyPpdk1 (a cytosolic pyruvate orthophosphate dikinase) (Bass et al., 1992; Schmidt et al., 1992; Maddaloni et al., 1996). The soft endosperm texture of o2 germplasm is associated with the reduction in the proportion of α-zein proteins (Huang et al., 2004; Huang et al., 2005). It has been postulated that the absence of specific zeins in o2 genotypes causes
35
the formation of smaller protein bodies and therefore alters the packing of the starch fraction during seed desiccation, resulting in abnormally soft endosperm (Schmidt et al., 1990). However, the endosperm of o2 maize can be restored to resemble normal
endosperm by the activity of modifier genes (Paez et al., 1969; Vasal, 1971). Modified o2 genotypes with hard endosperm developed at the International Maize and Wheat Improvement Center (CIMMYT) are called Quality Protein Maize (QPM) (Vasal, 2000). In general, QPM genotypes retain higher levels of Lys and Trp than normal maize materials (Ortega and Bates, 1983).
Several investigations have aimed to identify the molecular mechanisms responsible for the endosperm modification and grain quality in QPM maize (Gibbon and Larkins, 2005). Lopes et al. (1995) using bulk segregant analysis (BSA) in
populations developed from o2 and modified varieties, found two loci associated with the modification of endosperm. Another report based on BSA reported two loci associated with endosperm modification, one of them in the same chromosome region reported by Lopes et al. (1995), and another one in a different genome location
(Lizarraga-Guerra et al., 2006). These and other studies suggest that the γ-zeins and their regulation are involved in the modification of o2 endosperm (Burnett and Larkins, 1999; Geetha et al., 1991). The 27 kDa γ-zeins seem to be involved in the development of protein bodies and in the formation of a protein network that surrounds starch grains in vitreous endosperm (Dannenhoffer et al., 1995). In addition, the branching pattern of the starch and the genetic variability of starch biosynthesis enzymes have been associated with modified phenotypes (Gibbon et al., 2003).
QPM genotypes have been introduced into production systems in several tropical and sub-tropical countries, where their nutritional advantages have been acknowledged (National Research Council, 1988; Vietmeyer, 2000). Nevertheless, there are major challenges to develop and use QPM germplasm because of the unknown number of modifier genes required to restore the desired hard-to-soft endosperm ratio, the need to evaluate the grain quality during the breeding process, and the genetic background effects (Belousov, 1987; Ciceri et al., 2000; Huang et al., 2004; Gibbon and Larkins, 2005). Characterization of the genes involved in the modification of o2 genotypes will provide valuable information to understand the genetic basis of endosperm composition and to facilitate the improvement of grain-related traits in maize. The objective of this study was to identify QTLs for several traits associated with the modification of
endosperm, including endosperm texture and amino acid content, using a population of recombinant inbred lines (RILs) developed from the cross of an o2 line and a QPM line.
Materials and Methods
Plant Material
Details of the development of the population of RILs and the experimental design were as described in Chapter II. A population of RILs was derived from a cross between B73o2 and CML161. CML161 is an exotic subtropical inbred classified as QPM and released by CIMMYT. B73o2 is an opaque2 conversion of B73, an Iowa Stiff
37
Stalk inbred. A group of 146 RILs were used for field trials (S5, S6, or S7 generations),
and genotypic analysis (S6 generation).
Field Design
The RIL population was evaluated in two Texas locations during the years 2004-2006, producing the environments WE04 (Weslaco in 2004, one replication), WE05 (Weslaco in 2005, three replications), CS05 (College Station in 2005, two replications), CS06A (College Station in 2006 first planting, two replications) and CS06B (College Station in 2006 second planting, two replications). A randomized complete block design was used in all environments. Trials received common management practices according to each research station. At least 10 plants per plot were self-pollinated. All plots were manually harvested.
Endosperm Texture Modification
Endosperm texture was evaluated with four different measurements (TEXT-F, TEXT-L, OPAC and VITR) associated with the extent of modification of the o2 endosperm in the RIL population. Endosperm texture (TEXT) was based on a visual rating from 1 (modified = flint-type round crown kernel and vitreous appearance) to 5 (opaque = dent-type kernels with very high proportion of floury endosperm) with increments of 0.5. A value of TEXT was assigned to self-pollinated ears that were harvested from each plot. Data was taken independently by one observer in the field during harvesting (TEXT-F), and two additional observers in the laboratory before
shelling (TEXT-L). Opacity (OPAC) was scored in a light box using a scale 1 (modified = light passes trough the whole kernel) to 5 (opaque = no light transmission due to completely opaque kernels) (Bjarnason and Vasal, 1992). For the trait vitreousness (VITR), an image analysis-based method was adapted (Leyva-Ovalle et al., 2002). Eight-bit black and white images were obtained by scanning longitudinal dissected kernels in a tabletop scanner (Hewlett Packard ScanJet 3970, Palo Alto, CA). The negative of the image was used to estimate the area of soft (black) and hard (white) endosperm using the pixel counting option of the UTHSCSA Image Tool 3.0 software (Wilcox et al., 2002). VITR was defined as the percentage of the area of hard endosperm to the total endosperm area.
Amino Acid Composition
Tryptophan (Trp), methionine (Met) and lysine (Lys) were quantified using a microbiological method based on E. coli strains auxotrophic for Trp, Met or Lys as described by Scott et al. (2004). Kernels from bulked ears from each plot were ground and measured in triplicate. The concentration of Met, Trp or Lys in each analysis was calculated using linear regression onto a standard curve developed using known amounts of pure amino acid standards.
Genotyping and Linkage Map
DNA was extracted from hypocotyl tissue obtained in bulk from 5 to 10 seedlings per RIL using a CTAB/sorbitol extraction buffer. Simple sequence repeat
39
(SSR) markers were selected from the Maize Genetics and Genomics Database
(Lawrence et al., 2004) based on consensus map location. SSR markers were amplified by polymerase chain reaction (PCR) and separated by electrophoresis in 4% (w/v) Super Fine Resolution agarose gels (Amresco, Solon, OH) using standard protocols
(CIMMYT, 2005). A linkage map was constructed in MapMaker/EXP 3.0b (Lander et al., 1987) using a set of 180 SSR markers. The Kosambi’s mapping function was used to transform recombination frequencies into map distances in centimorgans (cM).
Statistical Analysis
Analysis of variance (ANOVA), phenotypic and genetic correlations among the traits, and heritability estimates were reported in Chapter II. For the analysis of QTLs, genotype least square means were estimated for each environment for each trait, and the best linear unbiased prediction (BLUP) procedure was used to predict the effects of each RIL across environments using univariate mixed model analysis in PROC MIXED of SAS 9.1. (SAS Institute, 2003).
Quantitative Trait Loci Analysis
Analysis of QTLs was conducted in Windows QTL Cartographer version 2.5 (Wang et al., 2006) for each trait using least square means calculated for each
environment, and BLUPs estimated across environments. Single marker analysis (SMA) was used to find associations between individual SRR markers and the endosperm traits means. Composite interval mapping (CIM) was implemented using the forward and
backward regression method (probability in = 0.1, probability out = 0.1), 5 cM window size, and 1 cM walk speed. Significance thresholds for the LOD scores corresponding to a type I error rate of 5% and 10% were determined by permutation tests (n=1,000 permutations) (Churchill and Doerge, 1994). Significant QTLs detected by CIM were incorporated in multiple interval mapping (MIM) to estimate their effects and to
investigate possible QTL x QTL interactions or epistasis. In addition, novel models were developed in MIM by creating initial MIM models by forward regression on markers with significance level 0.005, based on probability of partial R2. Subsequent MIM models were accepted when decreasing the Bayesian Information Criteria (BIC). QTL detection results are reported for the MIM model with lower BIC after several rounds of search, optimization and testing.
Results
One-hundred forty-six RILs derived from B73o2 x CML161were screened for the presence of a mutant allele o2 using the O2 gene-specific SSR markers phi057 and umc1066. Three RILs were removed from the QTL analysis after showing unexpected fragment sizes for these two markers. One hundred-eighty (180) polymorphic SSR markers were used to genotype the population of RILs. The length of the linkage map constructed was 1798.1 cM, and the average distance between markers was 10.05 cM (Fig. 3.1). The order of the loci in the linkage map was consistent with the consensus map of maize (Schaeffer at al., 2006; Lawrence et al., 2004). The statistical analysis of
41
the traits, phenotypic and genotypic correlations, and heritability estimates were reported in chapter II.
Endosperm Texture Modification
Given the contrasting differences between the two parental inbreds, CML 161 and B73o2, the amount of variation observed was high for all the traits measured. Considerably high heritability estimates (h2 entry-mean basis = 0.83-0.94) were
calculated for the four measurements of endosperm modification as described in chapter II. CIM analysis detected QTLs for the four traits in chromosomes 1, 3, 4, 5, 6, 8, and 10 (Fig. 3.1 and Table 3.1). Both TEXT traits corresponded to visual ratings of endosperm texture taken on whole ears. Seven QTLs were identified for the trait TEXT-F over all environments. These QTLs explained 77% of the phenotypic variation. In the QTLs of bins 3.02 (phi374118), 4.05 (bnlg1755), 5.05 (umc2026), 6.00 (umc1143) and 8.05 (umc1562), the allele increasing endosperm modification was the one derived from the QPM parent. The QTL on bin 8.05 near to the marker umc1562 explained 27.5% of the variation. In the QTLs of bins 1.02 (umc1976) and 6.06 (umc2170), the allele that decreased the proportion of opaque endosperm (i.e., more vitreous endosperm) was the one derived from the o2 parent. A novel MIM model containing six QTLs and two QTL
42
Figure 3.1. QTLs detected with CIM analysis for traits related with endosperm texture modification (F, TEXT-L, OPAC, and VITR) and amino acids content (Lys, Trp and Met) in a population of RILs derived from the cross between maize lines CML161 and B73o2 evaluated in Texas during 2004-2006. Arrows indicate the direction of B73o2 allele phenotypic effect (up, increasing; down, decreasing). The length of the QTL boxes depicts the 2-LOD support intervals.
43
Table 3.1. Quantitative trait loci (QTLs) identified by composite interval mapping analysis across environments for the traits related to endosperm texture
modification: TEXT-F, TEXT-L, OPAC, and VITR. QTL peaks or chromosome position with the highest LOD value, closest marker to the peak, and the bin of the