Computational identification of microbial
phosphorylation sites by the enhanced
characteristics of sequence information
著者
Hasan Md. Mehedi, Rashid Md. Mamunur, Khatun
Mst. Shamima, Kurata Hiroyuki
journal or
publication title
Scientific Reports
volume
9
page range
8258-1-8258-9
year
2019-05-20
URL
http://hdl.handle.net/10228/00007359
doi: info:doi/10.1038/s41598-019-44548-x
Computational identification of
microbial phosphorylation sites
by the enhanced characteristics of
sequence information
Md. Mehedi Hasan
1, Md. Mamunur Rashid
1, Mst. Shamima Khatun
1& Hiroyuki Kurata
1,2
Protein phosphorylation on serine (S) and threonine (T) has emerged as a key device in the control of many biological processes. Recently phosphorylation in microbial organisms has attracted much attention for its critical roles in various cellular processes such as cell growth and cell division. Here a novel machine learning predictor, MPSite (Microbial Phosphorylation Site predictor), was developed to identify microbial phosphorylation sites using the enhanced characteristics of sequence features. The final feature vectors optimized via a Wilcoxon rank sum test. A random forest classifier was then trained using the optimum features to build the predictor. Benchmarking investigation using the 5-fold cross-validation and independent datasets test showed that the MPSite is able to achieve robust performance on the S- and T-phosphorylation site prediction. It also outperformed other existing methods on the comprehensive independent datasets. We anticipate that the MPSite is a powerful tool for proteome-wide prediction of microbial phosphorylation sites and facilitates hypothesis-driven functional interrogation of phosphorylation proteins. A web application with the curated datasets is freely available at http://kurata14.bio.kyutech.ac.jp/MPSite/.
Protein phosphorylation is one type of post-translational modification (PTM) that plays an important role in regulating many signal transduction pathways1–4. Since 19325,6 eukaryotes have been extensively studied and most
of the identified phosphorylation acceptor residues were serine (S), and threonine (T). Different studies suggest that phospho-serine (pS) and phospho-threonine (pT) residues are critical for functional regulation and signal-ing transduction6–10. Recently, some leading studies have expanded an understanding of molecular mechanisms
and functional roles in microbial phosphorylation6,11–15. Although the experimental determination of microbial
phosphorylation proteins with specific modified sites is increasing in the present era, the mechanism of phospho-rylation specificity is still largely unknown until now7,12,16. Therefore, identification of microbial phosphorylation
sites is necessary for further elucidating the mechanism of phosphorylation.
Due to the potential significance of microbial phosphorylation, identifying the microbial phosphorylation sites in proteins is a prerequisite and offers valuable evidence in biomedical research. The experimental identifica-tion of the phosphorylaidentifica-tion sites is necessary and mainly depends on mass spectrometry analysis which is labori-ous and expensive. Before the experimental investigation, computational modeling of microbial phosphorylation sites based on protein sequence information is therefore highly desired.
Although there are a large number of computational studies in higher organisms17–19, predictions in
micro-bial cells are still rare. To date, two computational methods were proposed to predict micromicro-bial phosphorylation sites20–22. Initially, Miller et al. developed NetPhosBac, which was constructed by an artificial neural network21.
Li et al. proposed a predictor cPhosBac based on the composition of the k-spaced amino acid pair (KSAAP) combined with motif length selection20. Until now, the NetPhosBac, which is publicly available, predicted pS and
pT residues of microbial phosphorylation sites. However, the overall performance of the aforementioned existing predictors is still not satisfying and there is further room to improve the prediction performance.
1Department of Bioscience and Bioinformatics, Kyushu Institute of Technology, 680-4 Kawazu, Iizuka, Fukuoka,
820-8502, Japan. 2Biomedical Informatics R&D Center, Kyushu Institute of Technology, 680-4 Kawazu, Iizuka, Fukuoka,
820-8502, Japan. Correspondence and requests for materials should be addressed to H.K. (email: kurata@bio.
kyutech.ac.jp)
Received: 19 September 2018 Accepted: 20 May 2019 Published: xx xx xxxx
www.nature.com/scientificreports
www.nature.com/scientificreports/
In this article, a new computational method of the MPSite was developed, which predicts pS and pT residues of microbial phosphorylation from the protein sequences. We investigated multiple sequence features including amino acid properties, evolutionary, and structural features to represent the peptide fragments of phosphoryl-ation sites. We optimized the feature models via a Wilcoxon rank-sum test (WR). Then the final feature vectors were classified by a random forest (RF) classifier. To assess the robustness and prediction accuracy of the MPSite, 5-fold cross-validations (CV) and independent tests were adopted. The MPSite outperformed other existing pre-diction models, suggesting that the MPSite is a useful computational resource to identify pS and pT sites in microbes.
Materials and Methods
Data preparation.
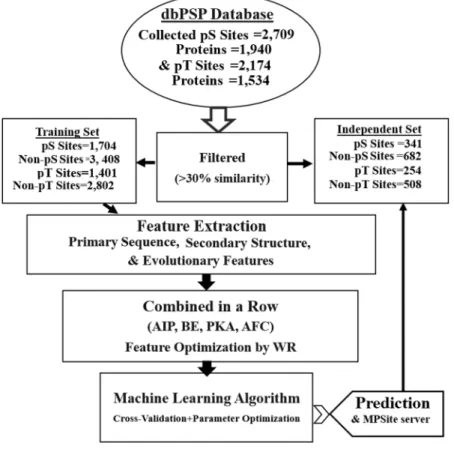
We collected microbial PTMs of pS and pT sites from the dbPSP database6. The pS andpT containing peptides experimentally detected without any phospho-groups were used as negative samples. Each site was represented as a peptide segment of 21 (±10) residues with S and T in the center. Homology reduc-tion was performed on the full protein length using CD-HIT with a default value of 30% sequence identity thresh-old23. At first, after removing redundant sequences, we assessed the performance of a pS site prediction classifier.
Since the performance of the predictive model might be overestimated by an overfitting of the training dataset, an independent test data set, definitely blind to the training set, was collected. The dataset for independent test was collected by random selection from the final dataset (2,045 positive sequences and 34,519 negative sequences). We adjusted the ratio of negative examples to positive ones to 2:1, because the performance of machine learning methods is often deteriorated by unbalanced datasets that differ in orders of magnitude24. Consequently, the
training dataset contained 1,704 positive and 3,408 negative sequence fragments; the independent test dataset contained 341 positive and 682 negative data. The above dataset selection procedure was applied for protein acetylation and S-sulfenylation site prediction in the previous literatures25,26.
Similarly, we assessed the performance of a pT site prediction classifier. After 30% sequence redundancy removal, the training dataset consisting of 1,401 positive and 2,802 negative sequence fragments were extracted from the final dataset (1,655 positive sequences and 24,963 negative sequences). The final independent test data-set contained 254 positive and 508 negative samples. All of these curated datadata-sets are available at http://kurata14.
bio.kyutech.ac.jp/MPSite/.
Overall workflow.
An overall framework of the MPSite predictor is shown in Fig. 1. Firstly, a sequence window of ±10 amino acids that possesses a positive/negative samples with S/T in the center was encoded in four different approaches. The optimum encoded feature vectors were combined in a row into one feature vector. Ultimately, the final feature vectors were optimized by the WR method via an RF classifier. Then, a confident cutoff was considered to identify the pS and pT sites.Sequence encoding strategies.
To establish an accurate machine learning (ML)-based prediction model, the individual sequence fragment was encoded into a numeric feature vector. It is a critical step to represent the collective classifiers. Therefore, to obtain the local information around the microbial phosphorylation site, a high-quality sequence encoding method was essential. As a substitute for retaining a general binary representa-tion of corresponding amino acid sequences, different types of encoding methods were investigated, including amino acid composition (AAC), amino acid frequency composition (AFC), binary encoding (BE), amino acid index properties (AIP), secondary structural feature (SSF), position-specific scoring matrix (PSSM), and profile based k-space amino acid pair composition (PKA), as follows.(i) AAC encoding
The AAC encoding is widely used for protein bioinformatics research27,28. When a fragment sequence is
composed of 20 amino acids, it contains 20-dimensional features. (ii) AFC encoding
By effectively representing the short sequence motif information in protein sequences or fragments, AFC is an important encoding scheme in many prediction tasks27–29. In this method, possible optimum pairs
are collected from the fragment sequences. A 2,205-dimensional feature vector was generated in the AFC encoding scheme. Details in the AFC encoding are described in our previous studies30.
(iii) BE encoding
The binary encoding scheme was generated by a 20-dimensional binary vector for each residue in a sliding window31. A sequence fragment of 420-dimension (21 × 20 = 420) feature vector was obtained through
binary encoding. (iv) AIP encoding
The AIP database (version 9.1) has the numerical indices of physicochemical and biochemical proper-ties of amino acids32. After evaluating the different types of AIP, we selected 15 informative amino acid
indices (Table S1), including BLAM930101, MAXF760101, TSAJ990101, NAKH920108, CEDJ970104, LIFS790101, NOZY710101, HUTJ700103, NAKH900109, BIOV880101, MIYS990104, PUNT030101, WOEC730101, BASU050102, and SUYM030101. These properties were transformed into the positive and negative samples for generating the feature vectors. The gap and pseudo amino acids were encoded as 0. In a sequence fragment, a 315-dimension (21 × 15 = 315) feature vector was obtained through AIP encoding. (v) SSF encoding
The SSF features are generated by the SPIDER2 software that is widely used in bioinformatics research33,34.
Three types of SSF features are generated by SPIDER2: accessible surface area, backbone torsion angles (BTA) and secondary structure (SS). The BTA generates 4-type feature vectors of phi, psi, theta and tau. The SS generates 3-type feature vectors of helix, strand, and coil. Totally, 8-type feature vectors are generat-ed. As a result, for each fragment sequence, 168 (21 × 8) dimensional feature vectors were generated. (vi) PSSM encoding
The PSSM profile was generated by using PSI-BLAST (version 2.2.26+) against the whole Swiss-Prot non-redundant database (December 2010) with two default parameters: e-value and iteration times of 1.0 × 10⁻⁴ and 3, respectively35,36. Then, we extracted the feature vectors using a sliding sequence window.
The dimension of the PSSM profile for each sequence fragment was (21 × 20) = 420. (vii) PKA encoding
After generating the PSSM profile, we generated possible k-space pair composition from the PSSM, i.e., PKA, in the same manner as the previous study of protein pupylation site prediction30. When an optimal
k-space was 0, 1, 2, 3, and 4, a (5 × 20 × 20 = 2,000) dimensional feature vector was generated.
Feature selection.
Note that the proposed method contains high dimensional features. In the sequenceof the given protein, the conservative possessions vary from site to site. As a result, near the central sites some residues a little contribute to the identification of PTM sites37,38. To characterize the relative importance and
con-tribution of each initial feature, the WR algorithm, a well-established feature extraction method, was considered. It can rank all the initial features according to their relevance to the redundancy between the features themselves and the response variables. Details are described in elsewhere39.
Combined model.
To enhance the performance of the MPSite, we combined the optimum encodingfea-tures. In this study, AFC, AIP, BE, and PKA schemes performed better than others. Therefore, we combined these four schemes in a row. For instance, AFC, AIP, BE and PKA have 2,205, 315, 420, and 2,000 dimensional feature vectors, respectively. The combined feature vector was 4,940 dimensional.
Machine learning algorithm.
A supervised ML algorithm, RF, was employed40. The RF is one of the mostprecise ML algorithms and provides highly accurate classification results in bioinformatics research31,41–43. RF
works as an ensemble and de-correlated decision trees, which ‘votes’ for one of the two classes, either positive or non-negative samples. The experimentally verified phosphorylation samples were labeled ‘+1’, while the other lysine residues labeled ‘−1’. Based on the positive and negative samples, four different types of features were generated using a series of input feature encodings. These generated features were input into the RF classifiers to identify whether they are positive or negative samples.
In this study, the performance of the RF was characterized in comparison to four commonly used ML algo-rithms: Naive Bayes (NB)28, decision trees (DT), SVM30, and artificial neural network (ANN)28. We used the NB,
www.nature.com/scientificreports
www.nature.com/scientificreports/
the LIBSVM package (http://www.csie.ntu.edu.tw/Bcjlin/libsvm/). To examine the optimal parameters, the grid search approach evaluated by a 5-fold CV test.
Performance matrix.
To evaluating the performance of the proposed method, four necessary yardstick sta-tistical measurements were used: accuracy (Ac), sensitivity (Sn), specificity (Sp), Matthews’ correlation coefficient (MCC), and area under the ROC curves (AUC), as follows.= + + + + Ac TP TN TP FN FP TN (1) = + Sn TP TP FN (2) = + Sp TN TN FP (3) = × − × + × + × + × + MCC TP TN FP FN TN FN TP FP TN FP TP FN ( ) ( ) ( ) ( ) (4)
where TP, TN, FP, and FN denoted the numbers of true positives, true negatives, false positives and false nega-tives, respectively. The receiver operating characteristics (ROC) curve (Sn vs. (1 −Sp) plot) was drawn. Different thresholds were considered to plot the ROC curves. The AUC values were calculated by the pROC R-package41,42.
Results and Discussion
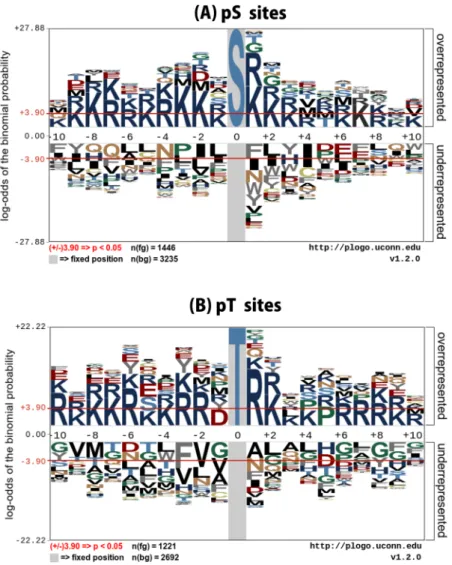
Analysis of amino acid preferences in microbial phosphorylation sites.
To understand informativefeatures surrounding pS and pT residues of microbial phosphorylation sites, we examined the flanking sequences of microbial phosphorylation with the pLogo program (https://plogo.uconn.edu/), a hypothetical approach to identifying the presence of sequence motifs. In the sequence logos, the residue heights were scaled according to their statistical significance, while the red bar signifies a statistical significance threshold of p= 0.05. In Fig. 2A, it can be seen that Lys (K) at positions −10, −9, −8, −5, −3, −2, −1, +1, +2, +3, +6, +7, +9, and +10, and Arg (R) at positions −7, −6, −4, +4 and +8 were significantly overrepresented compared with other amino acids, while Leu (L) at positions −6, −5, −1, and +2, Gln (Q) at positions −8, −7 and +9, Phe (F) at position −10, +1, and +7 and Tyr (Y) at −9 and +3 were significantly underrepresented.
In Fig. 2B, Lys (K) at positions −9, −8, −7, −5, −4, +2, +3, +4, and +9, and Arg (R) at positions −10, −6, −3, −2, +1, +6, +7, +8 and +10 were significantly overrepresented compared with other amino acids, while Ala (A) at positions +1 and +3, Gly(G) at positions −10, −1, +6, +8, and +10, Leu (L) at positions −4, +2, +4 and +7, Phe (F) at position −3 and +9 and Thr (T) at −7 and −5 were significantly underrepresented. Notably, it can be seen that a predominant characteristic of microbial S and T sites of phosphorylation is the requirement of R and K residues at the enriched position, which might be responsible for the creation of bends or flexibility in the pS and pT sites. Amino acid preference difference between two samples can explain how the feature vector combining method achieves a reasonable performance.
Overall performances of the MPSite in training datasets.
Firstly, we developed the models fordis-criminating pS and pT sites from the dbPSP dataset using profile-based methods including the PSSM and KPSSM methods. The RF-based models have been developed using a sparse profile of patterns, which is represented by a vector length of W × 20 (W is the sequence fragment length, 21 in this study). The model performances were measured using 5-fold CV test via the RF classifier. We achieved AUCs of 0.608 and 0.691 for PSSM and PKA, respectively in pS site prediction (Table 1). In a similar way we examined pT site prediction achieved AUCs of 0.616 and 0.813 for PSSM and PKA, respectively.
Secondly, we developed an AIP property-based model. We tested 15 AIP properties (Table S1), which were shown to be a good index for pS and pT site prediction. The model achieved AUC values of pS and pT sites of 0.671 and 0.685, respectively (Table 1). The AFC methods performed the best for all the single encodings, with AUCs of 0.725 and 0.826 for pS and pT site prediction, respectively (Table 1). We generated the SSF features using 8 types of properties (Material and Methods) and evaluated these features using 5-fold CV test through training datasets. The SSF model achieved AUCs of 0.641 and 0.662 for pS and pT sites, respectively (Table 1). The above analyses demonstrated that the four methods of AIP, BE, AFC, and PKA were better than any other single encod-ing methods for predictencod-ing pS and pT sites.
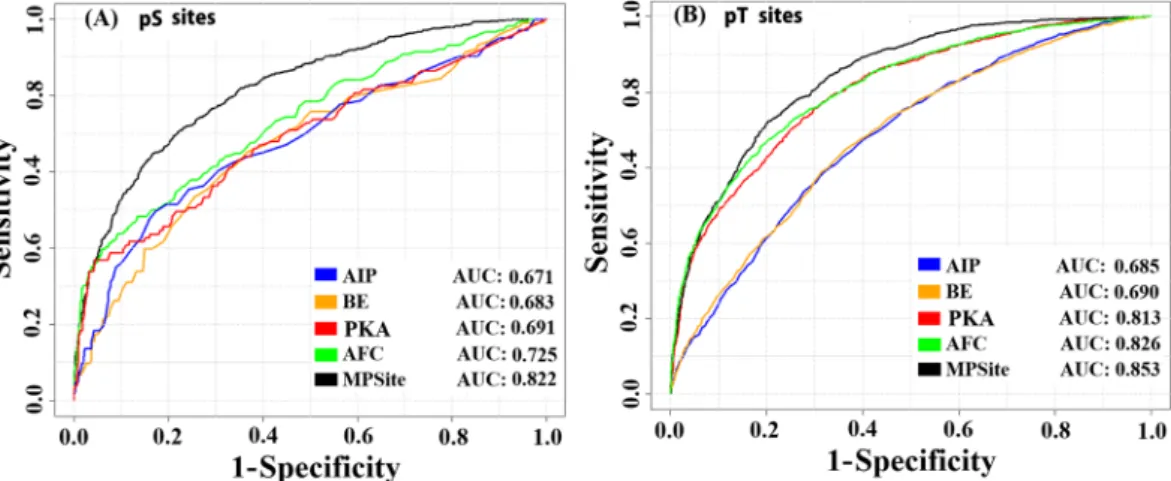
Finally, we tested the MPSite that combined the four AFC, AIP, BE, and PKA encoding methods. These four feature vectors were directly combined in a row for prediction of pS sites. After combining these features, the total dimension was 4,961, renamed as “all-features”. Then, we optimized these features using the WR scheme. After several trials, the top 1,500 feature vectors were collected from the all-features for pS site prediction. The collected feature vectors were transformed into a new ordered feature based on low to high WR values. The final feature vectors were trained by the RF classifier. The optimum RF decision trees were grown up through the training dataset based on the 5-fold CV. The MPSite provided the highest AUC value of 0.822 (Fig. 3A). The performance indexes in terms of Sp, Sn, Ac, and MCC were 0.897, 0.503, 0.766, and 0.452, respectively, in the training dataset (Table 2). The performances of the combined model surpassed those of the single encoding methods (Fig. 3A).
In the pT site prediction model, after combining the four encoding features, we collected top 2,100 feature vectors by the WR via the training datasets through 5-fold CV test. These optimum features were trained the RF
classifier. The highest Sp, Sn, Ac, and MCC were 0.901, 0.596, 0.799, and 0.522, respectively (Table 2). Moreover, we depicted the ROC curve for each method and their combined model (Fig. 3B). The pT site prediction perfor-mance of the MPSite surpassed those of the single encoding methods, as well as the pS site prediction.
Figure 2. Sequence logo representation of pS and pT sites. The local sequence neighborhood of 10 upstream and 10 downstream residues surrounding the phosphorylation sites was used to plot the sequence logos. Two-sample logos show the dominance of surface accessible residues in microbial pS and pT sites.
Method pS-site pT-site
AAC 0.639 0.646 PSSM 0.608 0.616 PKA 0.691 0.813 AIP 0.671 0.685 BE 0.683 0.690 AFC 0.725 0.826 SSF 0.641 0.662 MPSite 0.822 0.853 DT 0.807 0.817 SVM 0.819 0.838 NB 0.789 0.811 ANN 0.774 0.784
Table 1. AUC value of different schemes on the training dataset via a 5-fold CV test. The AUC scores of AAC, PSSM, PKA, AIP, BE, AFC, and SSF schemes were measured by using the RF algorithm. The AUC value of MPSite, DT, SVM, NB, and ANN are estimated by integrating the four descriptors of PKA, AIP, BE, and AFC.
www.nature.com/scientificreports
www.nature.com/scientificreports/
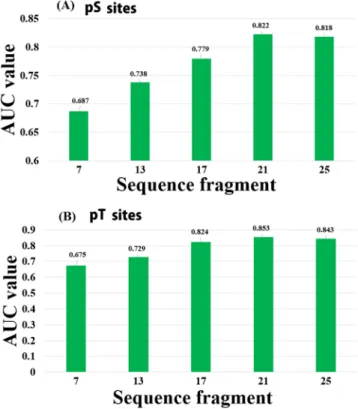
Moreover, in order to estimate the influence of the surrounding residues, the window fragments were opti-mized based on AUC values by using the training datasets. To assess the sequence similarity of the diverse region around the phosphorylation sites, we changed a windows size from 7 to 25 in both the pS and pT classifiers based on all features. An optimal window size of 21 was selected (Fig. 4). In addition, we examined the effect of different positive versus negative samples in the training dataset on the prediction performance of the MPSite. The perfor-mance of the pS and pT models trained with different positive to negative sample ratios was estimated by 5-fold CV test, as shown in Table S2. A 1:2 ratio of the positive versus negative samples showed high Sn, MCC and AUC values compared with the other sample ratios for both the pS and pT classifiers. An increase in negative samples the Ac increased, but slightly decreased the Sn, MCC and AUC values probably due to the imbalanced datasets.
Feature significance analysis.
To investigate the significant features, we collected the top 30 features and their corresponding scores through the WR method from all-features for pS sites in Table S2. The selected features were found significant for the positive and negative samples (by the two-sample t-test p< 0.01). Moreover, we revealed that the four types of features of AFC, AIP, PKA, and BE were included in the top 30 significant features (Table S3). This analysis suggested that a combination of four types of features is critically responsible for pS site prediction.Furthermore, we collected top 30 features ranked and their corresponding scores through the WR method for pT sites (Table S4). We found the significant difference between the positive and negative samples on the top 30 features (by the two-sample t-test p < 0.05). Interestingly, we found that the four types of features (AFC, AIP, PKA, and BE) were included in the top 30 significant features. In the above analysis, we concluded that the com-bination of features, AFC, AIP, PKA, and BE was particularly important for model performance in pS and pT site prediction.
Performance of different ML algorithms on training datasets.
The performance of the RF wascom-pared to the four widely-used machine learning algorithms of DT, NB, SVM, and ANN by using the same training features as selected in the previous section for pS and pT site prediction. The AUC values of the prediction by the four algorithms, calculated by 5-fold CV test, are listed in Table 1. The RF algorithm provided higher AUC than any other algorithms, while the SVM performance was comparative to the RF (Table 1).
Performance evaluation with existing algorithms using the independent datasets.
Theperfor-mance evaluation of different schemes is often difficult because they use different training samples with different ratios of positive to negative datasets and diverse assessment procedures. We evaluated the predictive perfor-mances of the NetPhosBac21 tool using the independent dataset, while the cPhosBac20 is not publicly available.
The NetPhosBac implements pS and pT site prediction classifiers. Initially, we compared the MPSite with the Figure 3. ROC curves on the various prediction models using a 5-fold CV test on training datasets. (A) Performance in the pS site dataset and (B) Performance in the pT site dataset. ‘MPSite’ indicates the optimum performances of the combined four features via the WR scheme.
Predictors pS sites pT sites
Sp 0.897 0.901
Sn 0.503 0.596
Ac 0.766 0.799
MCC 0.452 0.522
AUC 0.822 0.853
NetPhosBac and the four ML-based predictors for pS sites. Each model was characterized in terms of Sn, Sp, Ac, and MCC. As shown in Table 3, the MPSite (Sp= 0.811, Sn= 0.412, Ac= 0.678, and MCC= 0.239) greatly out-performed the NetPhosBac and the four ML-based algorithms. Indeed, all performance measures in the MPSite were higher than those of the other methods, thus indicating the superiority of the MPSite in pS site prediction. Next, we compared the performances of the MPSite with those of the NetPhosBac and the four ML-based mod-els using pT sites. The MPSite scheme presented the highest Sn, Ac, and MCC for all the methods. The Sp of the NetPhosBac was higher than the MPSite, but the Sn was very low (Table 3). The overall performance of the MPSite outperformed the NetPhosBac and others methods.
In both of the pS and pT classifiers, the independent performances were lower than the original training data-set. This would be caused by the fact that the independent sets, definitely blind to the training set, are collected. Many published studies of PTM analysis have showed the same results26,30,45 that independent performances were
lower than the training dataset.
While the MPSite achieved a promising performance, there is still room for enhanced prediction accuracy. In the proposed model we exclusively used the sequence information including a SSF feature to reduce calculation Figure 4. AUC values for different window sizes based on 5-fold cross-validation tests. (A) pS and (B) pT site prediction. Method Sp Sn Ac MCC Phospho-serine (pS) MPSite 0.811 0.412 0.678 0.239 ANN 0.803 0.261 0.622 0.124 DT 0.801 0.291 0.631 0.157 NB 0.801 0.271 0.624 0.133 SVM 0.802 0.361 0.655 0.183 NetPhosBac 0.678 0.331 0.562 −0.006 Phospho-threonine (pT) MPSite 0.818 0.616 0.751 0.432 ANN 0.806 0.465 0.692 0.292 DT 0.803 0.499 0.702 0.322 NB 0.801 0.446 0.683 0.283 SVM 0.805 0.565 0.725 0.372 NetPhosBac 0.883 0.101 0.622 0.011
www.nature.com/scientificreports
www.nature.com/scientificreports/
complexity, while recently the tertiary structure has been suggested as another key feature for PTM prediction46
and the exclusive use of sequence features may bias the prediction accuracy47. In the near future, we will utilize
tertiary structural features to enhance prediction accuracy.
Conclusions
An efficient computational approach was designed for identifying potential microbial pS and pT sites. We show that the MPSite is a promising method and provides an outstanding performance compared with existing meth-ods. Analysis of the training and independent datasets demonstrated that the MPSite is useful for understanding the mechanisms of microbial phosphorylation sites. Finally, a user-friendly web application was developed and freely available for academic users.
References
1. Lu, C. H. S., Liu, K., Tan, L. P. & Yao, S. Q. Current chemical biology tools for studying protein phosphorylation and dephosphorylation. Chemistry 18, 28–39, https://doi.org/10.1002/chem.201103206 (2012).
2. Cohen, P. The origins of protein phosphorylation. Nature cell biology 4, E127–130, https://doi.org/10.1038/ncb0502-e127 (2002). 3. Cohen, P. The role of protein phosphorylation in human health and disease. The Sir Hans Krebs Medal Lecture. European journal of
biochemistry 268, 5001–5010 (2001).
4. Cohen, P. The role of protein phosphorylation in neural and hormonal control of cellular activity. Nature 296, 613–620 (1982). 5. Pawson, T. & Scott, J. D. Protein phosphorylation in signaling–50 years and counting. Trends in biochemical sciences 30, 286–290,
https://doi.org/10.1016/j.tibs.2005.04.013 (2005).
6. Pan, Z. et al. dbPSP: a curated database for protein phosphorylation sites in prokaryotes. Database: the journal of biological databases and curation 2015, bav031, https://doi.org/10.1093/database/bav031 (2015).
7. Suskiewicz, M. J. & Clausen, T. Chemical Biology Interrogates Protein Arginine Phosphorylation. Cell chemical biology 23, 888–890,
https://doi.org/10.1016/j.chembiol.2016.08.003 (2016).
8. Fabret, C., Feher, V. A. & Hoch, J. A. Two-component signal transduction in Bacillus subtilis: how one organism sees its world.
Journal of bacteriology 181, 1975–1983 (1999).
9. Deutscher, J., Francke, C. & Postma, P. W. How phosphotransferase system-related protein phosphorylation regulates carbohydrate metabolism in bacteria. Microbiology and molecular biology reviews: MMBR 70, 939–1031, https://doi.org/10.1128/MMBR.00024-06
(2006).
10. Ptacek, J. et al. Global analysis of protein phosphorylation in yeast. Nature 438, 679–684, https://doi.org/10.1038/nature04187
(2005).
11. Macek, B. et al. The serine/threonine/tyrosine phosphoproteome of the model bacterium Bacillus subtilis. Molecular & cellular proteomics: MCP 6, 697–707, https://doi.org/10.1074/mcp.M600464-MCP200 (2007).
12. Esser, D. et al. Protein phosphorylation and its role in archaeal signal transduction. FEMS microbiology reviews 40, 625–647, https:// doi.org/10.1093/femsre/fuw020 (2016).
13. Yang, M. K. et al. Global phosphoproteomic analysis reveals diverse functions of serine/threonine/tyrosine phosphorylation in the model cyanobacterium Synechococcus sp. strain PCC 7002. Journal of proteome research 12, 1909–1923, https://doi.org/10.1021/ pr4000043 (2013).
14. Reimann, J. et al. Archaeal signal transduction: impact of protein phosphatase deletions on cell size, motility, and energy metabolism in Sulfolobus acidocaldarius. Molecular & cellular proteomics: MCP 12, 3908–3923, https://doi.org/10.1074/mcp.M113.027375
(2013).
15. Macek, B. et al. Phosphoproteome analysis of E. coli reveals evolutionary conservation of bacterial Ser/Thr/Tyr phosphorylation.
Molecular & cellular proteomics: MCP 7, 299–307, https://doi.org/10.1074/mcp.M700311-MCP200 (2008).
16. Choudhary, C. & Mann, M. Decoding signalling networks by mass spectrometry-based proteomics. Nature reviews. Molecular cell biology 11, 427–439, https://doi.org/10.1038/nrm2900 (2010).
17. Xu, Y., Song, J., Wilson, C. & Whisstock, J. C. PhosContext2vec: a distributed representation of residue-level sequence contexts and its application to general and kinase-specific phosphorylation site prediction. Scientific reports 8, 8240, https://doi.org/10.1038/ s41598-018-26392-7 (2018).
18. Liu, Y., Wang, M., Xi, J., Luo, F. & Li, A. PTM-ssMP: A Web Server for Predicting Different Types of Post-translational Modification Sites Using Novel Site-specific Modification Profile. International journal of biological sciences 14, 946–956, https://doi.org/10.7150/ ijbs.24121 (2018).
19. Li, F. et al. Quokka: a comprehensive tool for rapid and accurate prediction of kinase family-specific phosphorylation sites in the human proteome. Bioinformatics, https://doi.org/10.1093/bioinformatics/bty522 (2018).
20. Li, Z., Wu, P., Zhao, Y., Liu, Z. & Zhao, W. Prediction of serine/threonine phosphorylation sites in bacteria proteins. Advances in experimental medicine and biology 827, 275–285, https://doi.org/10.1007/978-94-017-9245-5_16 (2015).
21. Miller, M. L. et al. NetPhosBac - a predictor for Ser/Thr phosphorylation sites in bacterial proteins. Proteomics 9, 116–125, https:// doi.org/10.1002/pmic.200800285 (2009).
22. Iakoucheva, L. M. et al. The importance of intrinsic disorder for protein phosphorylation. Nucleic acids research 32, 1037–1049,
https://doi.org/10.1093/nar/gkh253 (2004).
23. Huang, Y., Niu, B., Gao, Y., Fu, L. & Li, W. CD-HIT Suite: a web server for clustering and comparing biological sequences.
Bioinformatics 26, 680–682, https://doi.org/10.1093/bioinformatics/btq003 (2010).
24. Radivojac, P. et al. Identification, analysis, and prediction of protein ubiquitination sites. Proteins 78, 365–380, https://doi. org/10.1002/prot.22555 (2010).
25. Bui, V. M., Lu, C. T., Ho, T. T. & Lee, T. Y. MDD-SOH: exploiting maximal dependence decomposition to identify S-sulfenylation sites with substrate motifs. Bioinformatics 32, 165–172, https://doi.org/10.1093/bioinformatics/btv558 (2016).
26. Li, Y. et al. Accurate in silico identification of species-specific acetylation sites by integrating protein sequence-derived and functional features. Scientific reports 4, 5765, https://doi.org/10.1038/srep05765 (2014).
27. Hasan, M. M. & Kurata, H. GPSuc: Global prediction of generic and species-specific succinylation sites by aggregating multiple sequence features. PloS one 13, e0200283, https://doi.org/10.1371/journal.pone.0200283 (2018).
28. Hasan, M. M., Guo, D. & Kurata, H. Computational identification of protein S-sulfenylation sites by incorporating the multiple sequence features information. Molecular BioSystms 13, 2545–2550, https://doi.org/10.1039/c7mb00491e (2017).
29. Hasan, M. M. & Kurata, H. iLMS, Computational Identification of Lysine-Malonylation Sites by Combining Multiple Sequence Features, 2018 IEEE 18thInt Conf Bioinformatics and Bioengineering (BIBE), Taichung, Taiwan, 356–359, https://doi.org/10.1109/
BIBE.2018.00077 (2018).
30. Hasan, M. M. et al. Computational Identification of Protein Pupylation Sites by Using Profile-Based Composition of k-Spaced Amino Acid Pairs. PloS one 10, e0129635, https://doi.org/10.1371/journal.pone.0129635 (2015).
31. Hasan, M. M., Yang, S., Zhou, Y. & Mollah, M. N. SuccinSite: a computational tool for the prediction of protein succinylation sites by exploiting the amino acid patterns and properties. Molecular bioSystems 12, 786–795, https://doi.org/10.1039/c5mb00853k
32. Kawashima, S. et al. AAindex: amino acid index database, progress report 2008. Nucleic acids research 36, D202–205, https://doi. org/10.1093/nar/gkm998 (2008).
33. Lopez, Y. et al. Success: evolutionary and structural properties of amino acids prove effective for succinylation site prediction. BMC genomics 19, 923, https://doi.org/10.1186/s12864-017-4336-8 (2018).
34. Yang, Y. et al. SPIDER2: A Package to Predict Secondary Structure, Accessible Surface Area, and Main-Chain Torsional Angles by Deep Neural Networks. Methods in molecular biology 1484, 55–63, https://doi.org/10.1007/978-1-4939-6406-2_6 (2017). 35. Dong, X., Zhang, Y. J. & Zhang, Z. Using weakly conserved motifs hidden in secretion signals to identify type-III effectors from
bacterial pathogen genomes. PloS one 8, e56632, https://doi.org/10.1371/journal.pone.0056632 (2013).
36. Chen, K., Jiang, Y., Du, L. & Kurgan, L. Prediction of integral membrane protein type by collocated hydrophobic amino acid pairs.
Journal of computational chemistry 30, 163–172, https://doi.org/10.1002/jcc.21053 (2009).
37. Weinert, B. T. et al. Proteome-wide mapping of the Drosophila acetylome demonstrates a high degree of conservation of lysine acetylation. Science signaling 4, ra48, https://doi.org/10.1126/scisignal.2001902 (2011).
38. Chen, Y. Z., Tang, Y. R., Sheng, Z. Y. & Zhang, Z. Prediction of mucin-type O-glycosylation sites in mammalian proteins using the composition of k-spaced amino acid pairs. BMC bioinformatics 9, 101, https://doi.org/10.1186/1471-2105-9-101 (2008).
39. Hasan, M. M., Khatun, M. S. & Kurata, H. A Comprehensive review of in silico analysis for protein S-sulfenylation sites. Protein & Peptide Letter 25, 815–821, https://doi.org/10.2174/0929866525666180905110619 (2018).
40. Liaw, A. Wiener. Classification and regression by random forest. R news 2, 18–22 (2002).
41. Hasan, M. M., Khatun, M. S., Mollah, M. N. H., Yong, C. & Guo, D. A systematic identification of species-specific protein succinylation sites using joint element features information. International journal of nanomedicine 12, 6303–6315, https://doi. org/10.2147/IJN.S140875 (2017).
42. Khatun, M. S, Hasan, M. M., Mollah, M. N. & Kurata, H. SIPMA: A Systematic identification of protein-protein Interactions in Zea mays using autocorrelation features in a machine-learning framework, 2018 IEEE 18thInt Conf Bioinformatics and Bioengineering
(BIBE), Taichung, Taiwan, 122–125, https://doi.org/10.1109/BIBE.2018.00030 (2018).
43. Hasan, M. M., Khatun, M. S. & Kurata, H. Computational Modeling of Lysine Post-Translational Modification: An Overview. Curr Synthetic Sys Biol 6, 137, https://doi.org/10.4172/2332-0737.1000137 (2018).
44. Frank, E., Hall, M., Trigg, L., Holmes, G. & Witten, I. H. Data mining in bioinformatics using Weka. Bioinformatics 20, 2479–2481,
https://doi.org/10.1093/bioinformatics/bth261 (2004).
45. Hasan, M. M., Khatun, M. S., Mollah, M. N. H., Yong, C. & Dianjing, G. NTyroSite: Computational identification of protein nitrotyrosine sites using sequence evolutionary features. Molecules 23, https://doi.org/10.3390/molecules23071667 (2018). 46. Radi, R. Protein tyrosine nitration: biochemical mechanisms and structural basis of functional effects. Accounts of chemical research
46, 550–559, https://doi.org/10.1021/ar300234c (2013).
47. Xie, Y. et al. DeepNitro: Prediction of Protein Nitration and Nitrosylation Sites by Deep Learning. Genomics, proteomics & bioinformatics 16, 294–306, https://doi.org/10.1016/j.gpb.2018.04.007 (2018).
Acknowledgements
This work was supported by the Grant-in-Aid for Challenging Exploratory Research with JSPS KAKENHI Grant Number 17K20009 and partially supported by the developing key technologies for discovering and manufacturing pharmaceuticals used for next-generation treatments and diagnoses both from the Ministry of Economy, Trade and Industry, Japan (METI) and from Japan Agency for Medical Research and Development (AMED).
Author Contributions
M.M.H. and H.K. conceived and designed the study. M.M.R. collected dataset. M.M.H. and M.S.K. performed the analyses. M.M.H., M.S.K. and H.K. wrote the manuscript. All authors discussed the prediction results and commented on the manuscript.
Additional Information
Supplementary information accompanies this paper at https://doi.org/10.1038/s41598-019-44548-x. Competing Interests: The authors declare no competing interests.
Publisher’s note: Springer Nature remains neutral with regard to jurisdictional claims in published maps and institutional affiliations.
Open Access This article is licensed under a Creative Commons Attribution 4.0 International License, which permits use, sharing, adaptation, distribution and reproduction in any medium or format, as long as you give appropriate credit to the original author(s) and the source, provide a link to the Cre-ative Commons license, and indicate if changes were made. The images or other third party material in this article are included in the article’s Creative Commons license, unless indicated otherwise in a credit line to the material. If material is not included in the article’s Creative Commons license and your intended use is not per-mitted by statutory regulation or exceeds the perper-mitted use, you will need to obtain permission directly from the copyright holder. To view a copy of this license, visit http://creativecommons.org/licenses/by/4.0/.