A NOVEL COMPUTER VISION-BASED FRAMEWORK FOR
SUPERVISED CLASSIFICATION OF ENERGY OUTBREAK
PHENOMENA
Sumaya Abusaleh
Under the Supervision of Dr. Ausif Mahmood and Dr. Khaled M. Elleithy
DISSERTATION
SUBMITTED IN PARTIAL FULFILMENT OF THE REQUIREMENTS FOR THE DEGREE OF DOCTOR OF PHILOSOPHY IN COMPUTER SCIENCE
AND ENGINEERING THE SCHOOL OF ENGINEERING
UNIVERSITY OF BRIDGEPORT CONNECTICUT
III
A NOVEL COMPUTER VISION-BASED FRAMEWORK FOR
SUPERVISED CLASSIFICATION OF ENERGY OUTBREAK
PHENOMENA
IV
A NOVEL COMPUTER VISION-BASED FRAMEWORK
FOR SUPERVISED CLASSIFICATION OF ENERGY
OUTBREAK PHENOMENA
ABSTRACT
Today, there is a need to implement a proper design of an adequate surveillance system that detects and categorizes explosion phenomena in order to identify the explosion risk to reduce its impact through mitigation and preparedness. This dissertation introduces state-of-the-art classification of explosion phenomena through pattern recognition techniques on color images. Consequently, we present a novel taxonomy for explosion phenomena. In particular, we demonstrate different aspects of volcanic eruptions and nuclear explosions of the proposed taxonomy that include scientific formation, real examples, existing monitoring methodologies, and their limitations. In addition, we propose a novel framework designed to categorize explosion phenomena against non-explosion phenomena. Moreover, a new dataset, Volcanic and Nuclear Explosions (VNEX), was collected. The totality of VNEX is 10, 654 samples, and it includes the following patterns: pyroclastic density currents, lava fountains, lava and tephra fallout, nuclear explosions, wildfires, fireworks, and sky clouds.
V
In order to achieve high reliability in the proposed explosion classification framework, we propose to employ various feature extraction approaches. Thus, we calculated the intensity levels to extract the texture features. Moreover, we utilize the
YCbCrcolor model to calculate the amplitude features. We also employ the Radix-2 Fast Fourier Transform to compute the frequency features. Furthermore, we use the uniform local binary patterns technique to compute the histogram features. Additionally, these discriminative features were combined into a single input vector that provides valuable insight of the images, and then fed into the following classification techniques: Euclidian distance, correlation, k-nearest neighbors, one-against-one multiclass support vector machines with different kernels, and the multilayer perceptron model. Evaluation results show the design of the proposed framework is effective and robust. Furthermore, a trade-off between the computation time and the classification rate was achieved.
VI
DEDICATION
To all mankind, who deserve to live in peace, harmony, and to be equipped with knowledge that will lead to the development of a better future for humanity.
VII
ACKNOWLEDGEMENTS
In the name of Allah, the Most Gracious, the Most Merciful. Praise be to Allah who paved the way for me to complete this work successfully. Without His grace and blessings, this dissertation would not have been possible.
I am indebted to my loving family for their tremendous support, unconditional love, understanding, encouragement, and patience during my doctoral studies.
I am grateful to my dissertation adviser Professor Ausif Mahmood and co-adviser Professor Khaled Elleithy for their support, knowledge, guidance, and leadership throughout the course of my dissertation. They taught me how to overcome the challenges I faced during the progress of my work with a positive attitude.
I would like to express my appreciation to my dissertation committee members: Dr. Miad Faezipour, Dr. Sarosh Patel, and Dr. Syed Rizvi for their valuable time and feedback. Finally, I would like to thank my friends who have made the Ph.D. chapter of my life a thrilling and unforgettable experience. They continue to always believe in me, recognize my strengths, motivate me to work with a passion to get the job done, and encourage me to never give up on my dreams.
VIII
ACRONYMS
C Correlation
Cb Chrominance blue
CMOS Complementary Metal-Oxide-Semiconductor
CO2 Carbon dioxide
Cr Chrominance red
ED Euclidean distance
EDM Electronic Distance Meter
EMP Electromagnetic pulse
ESB Enterprise Service Bus
F Fireworks
FOV Field of View
fps Frames per second
GIS Geographical Information System
GPS Global Positioning System
GUI Graphical User Interface
HF High frequency
IX
InSAR Interferometric Synthetic Aperture Radar
IRIS Incorporated Research Institutions for Seismology
JPEG Joint Photographic Experts Group
KNN K-Nearest Neighbors
LF Lava Fountains
LiDAR Light Detection and Ranging
LT Lava and tephra fallout
MODIS Moderate Resolution Imaging Spectroradiometer
MPL Multilayer perceptron model
MSE Mean Square Error
NC Nuclear explosions
PCA Principal Component Analysis
QP Quadratic problem
Radix-2 FFT Radix-2 Fast Fourier Transform
RBF Radial Basis Function
RGB Red, Green, and Blue
SC Sky clouds
SGD Stochastic Gradient Descent
SMO Sequential Minimal Optimization
SOA Service-Oriented Architecture
SVM Support Vector Machine
X
TIR Thermal Infrared Radiation
TRCV Training Combiner Vector
TTCV Testing Combiner Vector
UAV Unmanned Aerial Vehicles
ULBP Uniform Local Binary Patterns
USGS U.S. Geological Survey
VLF Very low frequency
VNEX Volcanic and Nuclear Explosions
Voldorad Volcano Doppler Radar
WiFi IEEE 802.11g/n
WF Wildfires
Y Luminance
XI
TABLE OF CONTENTS
ABSTRACT ... iv DEDICATION ... vi ACKNOWLEDGEMENTS ... vii ACRONYMS ... viii TABLE OF CONTENTS ... xiLIST OF TABLES ... xiv
LIST OF FIGURES ... xvi
CHAPTER 1: INRTODUCTION ... 1
1.1 Research Problem and Scope ... 1
1.2 Motivation behind the Research ... 5
1.3 Contributions of the Proposed Research ... 7
CHAPTER 2: EXPLOSION TAXONOMY... 10
CHAPTER 3: THE ART OF READING EXPLOSION VERSUS NON-EXPLOSION PHENOMENA ... 14
3.1 Volcanic Eruptions... 14
3.1.1 Patterns of Pyroclastic Density Currents ... 15
3.1.2 Patterns of Lava Fountains ... 17
XII
3.2 Nuclear Explosions ... 19
3.2.1 Patterns of Mushroom-Shaped Clouds. ... 20
3.2.2 Patterns of the Artificial Aurora Display with an Ionized Region ... 22
3.3 Non-Explosion Phenomena ... 24
3.3.1 Patterns of Wildfires. ... 24
3.3.2 Patterns of Fireworks. ... 25
3.3.3 Patterns of Sky Clouds. ... 25
CHAPTER 4: LITERATURE SURVEY ... 26
4.1 Existing Literature on Monitoring Volcanic Eruptions and Nuclear Explosions .... 26
4.2 Programs for Monitoring Nuclear Explosions and Volcanic Eruptions in the U.S.. .... 31
4.3 Limitations of the Existing Surveillance Systems for Explosions ... 33
CHAPTER 5: DESIGN OF THE PROPOSED FRAMEWORK ... 36
5.1 Feature Extraction Approaches ... 36
5.1.1 Texture Features: Principal Component Analysis ... 36
5.1.2 Amplitude Features: YCbCrColor Model ... 38
5.1.3 Frequancy Features: Radix-2 Fast Fourier Transform ... 41
5.1.4 Histogram Features: Uniform Local Binary Patterns ... 45
5.2 Classification Techniques ... 47
5.2.1 Conventional Statistical Methods ... 48
5.2.1.1 Euclidean Distance ... 48
5.2.1.2 Correlation ... 49
5.2.2 Classifiers ... 49
XIII
5.2.2.2 One-Against-One Multiclass Support Vector Machine ... 51
5.2.2.3 Multilayer Perceptron Model ... 53
CHAPTER 6: DATASET ... 56
6.1 Volcanic and Nuclear Explosions (VNEX) Dataset ... 56
CHAPTER 7: EXPERIMENTAL RESULTS AND DISCUSSION ... 60
7.1 Results of the VNEX Testing Set ... 60
7.2 Results of a Youtube Video Testing Set ... 70
7.3Results of Video Frames Captured in a Real-Time Environment Using a Drone...76
7.4 Statistical Power Analysis ... 83
CHAPTER 8: CONCLUSION ... 87
8.1 Future Work ... 88
XIV
LIST OF TABLES
Table 1.1 Summary of problems and solutions related to explosion classification.
4
Table 2.1 Classification criteria of the proposed taxonomy. 12-13
Table 6.1 Categories of VNEX dataset. 58
Table 7.1 Performance comparison of multiclass classification methods when extracting 300 features against 400 features of VNEX testing set (5, 327 samples).
62
Table 7.2 Classified against misclassified images of VNEX testing set (5, 327 samples) when the input vector length =300, as compared to the input vector of length 400.
64
Table 7.3 Comparison between two architectures of MPL associated with their corresponding parameters and accuracy when extracting 300 features against 400 features of VNEX testing dataset (5, 327 samples).
65
Table 7.4 Confusion matrix for the multiclass degree-3 polynomial kernel SVM classifier, with input features vector of length 400.
XV
Table 7.5 Analysis of the execution time in milliseconds for testing one test sample.
70
Table 7.6 Comparison between patterns in terms of accuracy. 72 Table 7.7 Confusion matrix for multiclass degree-3 polynomial
kernel SVM classifier, where input vector = 300 features.
74
Table 7.8 Comparison between patterns in terms of accuracy after capturing real-time test frames using the front camera of AR.Drone 2.0
81
Table 7.9 Confusion matrix for the multiclass degree-3 polynomial kernel SVM classifier for testing frames that were retrieved using the AR.Drone 2.0.
82
XVI
LIST OF FIGURES
Figure 2.1 Proposed explosion taxonomy. 11
Figure 3.1 Patterns of PDCs. (a) The volcanic eruption of Soufriere Hills in Montserrat occurred on January 16, 1997; (b) Mayon volcano occurred on September 23, 1984; (c) Soufriere Hills volcano, Montserrat; (d) Bromo volcano, East Java, Indonesia, occurred on 8 June, 2004; (e) The eruption of Guagua Pichincha volcano, west of the capital Quito, Ecuador occurred on October 7, 1999; (f) Mt. St. Helens volcano, Washington State, USA, occurred on May 18, 1980; (g) The Tonga undersea volcanic eruption occurred on March 18, 2009; (h) The photo description and credit as per Figure 3.1g.
16
Figure 3.2 Patterns of lava fountains. (a) Fissure volcano: Kamoamoa eruption, Kilauea, Hawaii, on March 5, 2011; (b) The outpouring of lava fountains from the active shield volcano of Kilauea's East
Rift Zone (Puʻu ʻŌʻō) on September 1983.
17
Figure 3.3 Patterns of lava and tephra fallout. (a) Lava fountains and massive billowing volcanic ash clouds expelled near the
XVII
Montagnola summit of Etna volcano which occurred on July 24,
2001; (b) lava and tephra fallout generated from the Pu‘u ‘Ö‘ö
eruption, Kilauea, Hawaii, in 1984; (c) Explosive eruption of Eyjafjallajökull in the island of Iceland occurred on April 14, 2010; (d) Effusive eruption (Basaltic volcanism) of Mt. Etna, Sicily, Italy, occurred in November 2002.
Figure 3.4 Mushroom-shaped cloud of the underwater Baker nuclear explosion in 1946.
21
Figure 3.5 Starfish artificial aurora with deposition region as seen from an aircraft in 1962.
23
Figure 4.1 Volcanic monitoring techniques that are employed by the USGS Volcano Hazards Program.
32
Figure 4.2 Transportable Array. 33
Figure 5.1 Steps of PCA algorithm during training (learning). 38 Figure 5.2 (a)Input color image of 64×64 pixels of RGB components;
(b) The corresponding YCbCr output image of 64×64 pixels.
40
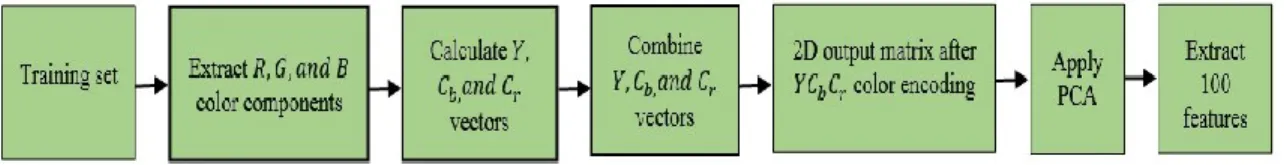
Figure 5.3 Block diagram for extracting the highest 100 eigenvectors after employing time domain YCbCr encoding schema.
41
Figure 5.4
(a) Input color image of 64×64 pixels of RGB components; (b) The corresponding gray image of 64×64 pixels; (c) Log plot for amplitude of Radix-2 FFT output image of size 64×64 pixels.
XVIII
Figure 5.5 Block diagram for extracting the highest 100 eigenvectors after employing Radix-2 FFT algorithm.
45
Figure 5.6 An illustration of the basic local binary pattern operator utilizing a nuclear explosion example.
46
Figure 5.7 A uniform pattern histogram is extracted for each block in the entire image, and then all histograms are concatenated in a single histogram.
47
Figure 5.8 A graph for combining features that represents the first image in the training set.
50
Figure 5.9 Architectures of MPL. (a) Single layer architecture; (b) Multilayer architecture.
54-55
Figure 6.1 Random samples of VNEX dataset. 59
Figure 7.1 The shape of the degree 3 polynomial kernel of a binary SVM model.
63
Figure 7.2 Graph illustrates the relationship between the classification rate and the number of hidden layers, where the input vector = 400, the output classes = 7, and using the testing set of VNEX dataset.
66
Figure 7.3 Graph of classified as opposed to misclassified images of VNEX testing set using the multiclass SVM with degree 3 polynomial kernel, and the input vector length = 400.
67
XIX
Figure 7.5 Chart of classified versus misclassified samples of the video sequences testing set.
73
Figure 7.6 Comparison between the accuracy of the multiclass SVM with degree 3 polynomial kernel when the input vector is 300 features as compared to the input vector of 400 features using the video sequence testing set where each class includes 140 frames.
76
Figure 7.7 Front view of AR.Drone 2.0 quadcopter; (b) Top view of AR.Drone 2.0.
78
Figure 7.8 A snapshot during the flight of the AR.Drone 2.0 to capture a real-time video streaming of lava fountain activity.
78
Figure 7.9 Live video streaming for NC; (b) Live video streaming for PDC. 79 Figure 7.10 Some of the video frames captured by the camera sensor at the
front of AR. Drone 2.0.
1
CHAPTER 1: INRTODUCTION
Explosion phenomena today are considered a significant concern that needs to be detected and analyzed with a prompt response in order to benefit military and civilians. In this section, we explore the explosion problem and scope, and we illustrate the motivation behind this research. In addition, we outline the contributions of the proposed research.
1.1
Research Problem and Scope
This dissertation presents state-of-the-art explosion classification through pattern recognition techniques on color images including feature extraction approaches and classification techniques. Consequently, color images are taken within the visible light spectrum range of approximately 400-700nm wavelength. These processed color images are 2-dimensional arrays of pixels with each pixel having RGB components.
We define the explosion term as a rapid increase in volume, and a release of kinetic energy or potential energy. Kinetic energy includes radiant, electrical, or thermal energy, while potential energy includes nuclear or chemical energy. The explosion generates a blast pressure wave or shock wave, high temperature, release of gases, and loud sounds caused by the incidents that are associated with the occurrence of each explosion phenomena [1].
An explosion can be a natural disaster such as a volcanic eruption [2]. On the other hand, it can be a critical man-made disaster such as a nuclear explosion [3,4]. In addition, an explosion may happen when chemicals, substances, and gases are exposed to heat,
2
improperly stored and treated, or kept in an unstable state such as a refinery explosion, an industrial explosion, and others [5].
We present in this dissertation a novel taxonomy of the explosion phenomena with an emphasis on natural explosions (e.g. volcanic eruptions) and man-made explosions (e.g. nuclear explosions).
Consequently, we propose the design of a novel computer vision-based classification system with an associated framework for some of explosion phenomena namely: volcanic eruptions that include pyroclastic density currents, lava fountains, and lava and tephra fallout. Additionally, our framework addresses nuclear explosion phenomena that form a mushroom-shaped cloud, against some of non-explosion phenomena namely: wildfires, fireworks, and sky clouds.
Supervised learning is used to map the input frames to the desired outputs and divide the space into regions or categories. The objectives of employing feature extraction approaches and classification techniques in the proposed framework are twofold. First, we compute features which have the most relevant information that characterize explosion phenomena from the input image data that will result in reducing the computational cost. This factor is often considered as the challenge to perform the desired classification task of any application. Second, we employ multiple classification techniques to categorize those phenomena and evaluate their performance of the developed system.
In this context, we describe each image using multiple feature extraction approaches including: texture features by utilizing intensity levels, amplitude features by applying YCbCrcolor model, frequency features by exploiting Radix-2 Fast Fourier
3
Binary Patterns (ULBP) technique. The Principal Component Analysis (PCA) technique is then applied on each feature class to calculate the most significant 100 eigenvectors and the corresponding eigenvalues. Furthermore, these discriminative features are collectively encapsulated into a single vector of 400 length.
In order to achieve high reliability of the explosion detection and classification system, we propose developing a system that has the following characteristics: First, an explosion event is represented by different feature sets or classes. These discriminative features computed using our proposed research methodology are invariant in terms of translation, illumination, rotation, and scale. Second, images are processed by multiple types of analysis such as texture analysis, spatial (spectral) analysis, frequency analysis, and histogram analysis. Third, our research methodology provides different views or interpretations for the same scene of an explosion or non-explosion phenomena, and finally, combining texture, amplitude, frequency, and histogram features provides a valuable insight into the images under consideration in this research.
Furthermore, these features were fed into several multiclass classification methods. As a result, the one-against-one multiclass SVM with degree 3 polynomial kernel tackled the problem at hand producing the highest classification rate. This classification model uses the Sequential Minimal Optimization (SMO) learning algorithm.
Towards the supervised classification goal, there was a need for a large dataset. However, there is a lack of public datasets on explosion phenomena under consideration in this dissertation. Therefore, we had to collect our own dataset. The new dataset includes10, 654 samples.
4
In addition, satellite remote sensing instruments that are installed to monitor volcanic eruptions have limitations in terms of the transmission time. For example, the Moderate Resolution Imaging Spectroradiometer (MODIS) retrieves ash clouds images within a lengthy time frame of fifteen to thirty minutes [6]. In view of this, our proposed technical solution categorizes an explosion image in a timely manner as compared to MODIS satellite remote sensing instrument.
Table 1.1 summarizes the problems related to the classification of explosion phenomena the dissertation explores associated with the solutions the dissertation provides.
Table 1.1 Summary of problems and solutions related to explosion classification.
Problem Solution
There is no comprehensive taxonomy for the
domain of explosion phenomena. We propose a novel taxonomy of explosion phenomena. Explosion classification is an unsolved problem in
the pattern recognition field on color images. We propose a framework design including feature extraction approaches and classification techniques. A proper explosion patterns’ representation does
not exist.
We represent an explosion event using different feature sets including texture, amplitude, frequency, and histogram features.
Selection of the suitable feature extraction
methodologies. We compute image intensity levels, Radix-2 Fast Fourier Transform, Uniform Local Binary YCbCrcolor model, Patterns, and Principal Component Analysis.
Selection of the classifier design and learning. We apply the one-against-one multiclass SVM with degree 3 polynomial kernel. It uses the Sequential Minimal Optimization (SMO) learning algorithm. No public dataset on explosion phenomena is
available.
We collect a new dataset of color images that includes 10, 654 samples.
Lengthy time frame for detecting and transmitting
5
1.2
Motivation behind the Research
Today, the emphasis on the risk identification as the first and critical step of the risk management process is arising. Hence, the development of technology as well as science will lead to saving lives and properties when they are linked to reliable automatic early warning systems and effective evacuation procedures.
In a large explosive volcanic eruption at which a volcano vents pyroclastic flows and surges, and depending on the location of the volcanic eruption, its consequences can be experienced globally or by an entire hemisphere. Additionally, detecting an explosive volcanic eruption will lead to protecting citizens not only from primary effects of Pyroclastic Density Currents (PDCs) that are among the deadliest disasters for populations living around the volcano, but also from the secondary effects of volcanic eruptions that may trigger under proper conditions lahar, tsunami, and fires. Furthermore, locating the eruption cloud downwind is a necessity because it is crucial to aviation safety [7,8].
In addition, unlike some natural disasters such as fires, hurricanes, tsunami, earthquakes, and tornadoes where people can rebuild and repair structure in the location of the phenomenon, lava ejected from an effusive eruption buries agricultural lands, homes, and crops in its path where people are rarely able to use land buried by lava flows and fountains [9].
6
Moreover, installing a system to classify the event as a nuclear explosion will support military forces to gain battlefield awareness for the future as well as improve battlefield tactics.
In a broad sense, ordinary explosions [3] of the proposed taxonomy including natural gas, dust, petroleum, industrial, residential, and refinery explosions typically can cause property damage and potential loss of life. Consequently, heat and flying debris associated with these explosions may cause injuries, burns, and even death for individuals who are within the explosion radius [5]. Moreover, inhalation of smoke, chemicals, fumes, and dust resulting from an explosion cause symptoms, diagnosis, and intoxication for people. As important as it is in practice, deploying a classification system that can identify the event as an explosion at early stages will be valuable, and will play a significant role by providing rapid emergency alert not only to notify people about threats to their safety once an unexpected explosion event has occurred, but also to help community organizations and directors provide assessment for civilians and explosion victims in a minimal time.
Furthermore, because of the limitations of the current surveillance techniques for explosion phenomena [6, 10-15], the need arises for maintaining the progress of developing new technical solutions that can perform a collaborative effort with the existing monitoring systems to identify imminent explosion hazards. In this context, the motivation behind designing our classification system are fourfold. (1) Encounters diminishing of the explosion phenomena, (2) mitigation of the explosions’ effect to save lives and properties, (3) defining physical properties of explosions that can be measured using RGB color
7
images, and (4) designing a technical solution that can detect and categorize explosion phenomena in a timely manner.
1.3
Contributions of the Proposed Research
In this dissertation, we present state-of-the-art pattern classification for explosion phenomena. As a result, this in-depth study depicts a new trend to rethink about how to cope with the challenges and constraints that govern the design, implementation, evaluation, and optimization of technical solutions for categorizing explosion phenomena using pattern recognition techniques. Contributions of this dissertations are as follows: (1) We propose a taxonomy for the main types of explosion phenomena. Key
characteristics of the taxonomy include an explosion category, classification criteria, sub-categories, and a brief description.
(2) We seek knowledge about the science behind volcanic eruptions and nuclear explosions of the proposed taxonomy in terms of how they occur through real examples. Subsequently, understanding the science has led to define different patterns of explosion phenomena from image processing point of view. Furthermore, the focus on these two categories of the proposed taxonomy among others was due to our ability of collecting images of these phenomena for conducting experiments.
(3) We collect a new dataset of color images called VNEX that includes four patterns of explosion phenomena: pyroclastic density currents, lava fountains, lava and tephra fallout, and nuclear explosions, against three patterns of non-explosion phenomena: wildfires, fireworks, and sky clouds. The totality of VNEX is 10, 654 samples. In view
8
of this, using a large training set, a better approximation of the features that define the patterns are obtained. Hence, the classifiers will have a high generalization capability to perform precisely on new samples. Moreover, using a large testing set will result in getting a high confidence in the anticipated error rate. In fact, the error rate of any supervised classification system is anticipated by all obtainable images that are usually divided into training and testing sets.
(4) We contribute the design and implementation of a novel computer vision-based framework for explosion phenomena using pattern recognition techniques including feature extraction approaches and classification techniques. In order to achieve high reliability in the proposed explosion classification system, we calculated the intensity levels to extract the texture features. Moreover, we utilize the YCbCrcolor model to calculate the amplitude features. We also employ the Radix-2 Fast Fourier Transform to compute the frequency features. Furthermore, we use the uniform local binary patterns technique to compute the histogram features. Then, principle component analysis algorithm is applied on each feature class to calculate the most 100 significant eigenvectors and eigenvalues. These features were combined into a single input vector that provides valuable insight of the images, and then fed into several classification techniques.
(5) We evaluate the effectiveness of the proposed features extraction methodology on the target application domain and provide a comparison between numerous multiclass classification techniques in terms of the classification rate. These methods are Euclidean distance, correlation, K-Nearest Neighbors (KNN), the multilayer perceptron model (MPL), and the one-against-one approach for multiclass Support
9
Vector Machines (SVMs) with various kernels including: linear, polynomials of different degrees, Radial Basis Function (RBF), and sigmoid.
(6) We assess our proposed methodology on three different testing sets. The first is the testing samples of VNEX dataset that includes 5, 327 color images. The second testing set consists of 980 frames of video sequences that we downloaded from the YouTube website, where each class comprises 140 frames that were retrieved by the system from computer folders for evaluation. These videos were taken in real outdoor environments for the seven scenarios of the respective defined classes. The third testing set consist of 980 frames of the same YouTube video sequences. However, in this case the frames were captured using a drone in a real-time indoor environment, because we do not have access to explosion zones.
(7) We calculate the classified versus misclassified samples of the testing sets under evaluation, confusion matrices of classifiers that produced the highest accuracy, and the execution time for testing an input image using our research methodology.
10
CHAPTER 2: EXPLOSION TAXONOMY
After exploring the domain of explosion phenomena, we propose to introduce a comprehensive novel taxonomy that includes main types of explosion phenomena. Consequently, the explosion problem domain includes the following main categories and subcategories: (1) volcanic eruptions that can be either explosive or effusive eruptions [2]; (2) nuclear explosions that have five sub-categories as follows: high altitude nuclear explosion (outer space detonation), atmospheric nuclear explosion (air burst), surface nuclear explosion, deep underground nuclear explosion, and shallow underwater nuclear explosion [4]; (3) dust explosions [16]; (4) natural gas explosions [5]; (5) petroleum explosions that can be either pipeline explosions or tank explosions [5]; (6) industrial explosions that include four subcategories as follows: chemical explosions, pipeline explosions, plant explosions, and warehouse fires [5]; (7) residential gas explosions that include the following three sub-categories: boiler and furnace explosions, appliance explosions, and wiring explosions [5]; and (8) refinery explosions [5,17].
Figure 2.1 represents the proposed explosion taxonomy, and Table 2.1 illustrates the details of the proposed taxonomy that include an explosion category, classification criteria, sub-categories, and a brief description.
This dissertation will only focus through the experiments on identifying and classifying the volcanic eruptions (natural explosions) and nuclear explosions (man-made explosions) because of the lack of images of other explosions categories of the proposed taxonomy.
11 Figure 2.1 Proposed explosion taxonomy.
12
Table 2.1 Classification criteria of the proposed taxonomy.
Explosion
category Classification criteria Sub-categories Brief description
Volcanic
eruptions Explosive style
Explosive
(violent) The eruption produces pyroclastic density currents that are typically the most dangerous of all volcanic phenomena [2]. Effusive
(quiet) The eruption generates lava fountains and flows that steadily ejected from the volcano onto the ground [2].
Nuclear explosions Location of the point of burst in relation to ground zero Shallow
underwater The nuclear explosion is conducted under the surface of the water [4]. Deep
underground
The nuclear weapons are detonated at varying depths under the
Earth’s surface [4].
Surface A surface explosion occurs either at the actual surface of the land or water, or slightly above [4].
Atmospheric (air burst)
A nuclear weapon is detonated in the air/ atmosphere using balloons, towers, barges, or dropped from an airplane at an altitude below
100,000 feet, and above the Earth’s surface at a height where the
fireball, at its maximum growth, does not touch the surface of the Earth [4].
High-altitude
(outer space) A nuclear explosion takes place above altitudes of 30 km (100,000 feet) [4].
Natural gas
explosions Energy resource N/A
Gas is typically pumped out of the ground directly into a central processing unit, then processed into different gases, transported to destinations, and distributed to retail centers and homes. Throughout this long process, a devastating explosion may occur due to a variety of reasons including: (1) leaks as a result of broken seals, loose valves, and improperly maintained pipes, (2) dangerous transportation, (3) manufacturing error, and (4) dangerous storage [5]. Dust explosions Dispersion of powdered combustible materials N/A
Explosion occurs by five factors including: (1) oxygen, (2) heat, (3) fuel (dust), (4) sufficient quantity and concentration of the dust
particles’ dispersion, and (5) confinement. The resultant pressure rises and it could generate an explosion. Further, dust that may explode include: (1) natural organic materials (e.g. sugar, coal, and grains), (2) synthetic organic material (e.g. plastic, and pesticides), (3) metals (e.g. zinc, aluminum, and iron), and (4) any unstable oxide [16]. Petroleum explosions Energy resource based on the mean of transport from the source of drilling. Pipeline
Crude oil is transported over long distances to processing plants via pipelines once it is pumped from the ground. Failure to inspect and maintain these pipelines will result in an explosion. Petroleum contains a large amount of paraffin wax that may build up and cause lack of oil flow, and this may increase the pressure in the pipeline. If the pipeline bursts near a spark or a flame, an explosion will occur [5].
Tank
Petroleum is stored in tanks before and after it is processed. There are several faults that may cause a petroleum tank to explode including: (1) leaks, (2) dangerous transportation, (3) poor maintenance/installation, and (4) manufacturing defect [5].
13 Industrial
explosions Manufacturing task
Chemical
Chemical explosions may occur because of the following actions regardless of the safety measures in place: (1) dangerous chemical reactions, (2) smoking near dangerous chemicals, (3) improperly maintained boilers, and (4) equipment malfunction [5].
Pipeline
Pipelines transport liquid and gases from the plant for hundreds of miles. Usually, pipes do not come in lengths long enough to cover the entire distance needed. Therefore, they are made from segments. Explosions occur because of multiple main reasons including: (1)
owners’ negligence to have pipelines inspected to ensure the softy
of plant workers, and (2) faults which include: weak welds, excessive pressure, improper construction, and faults in the seams where the segments are connected. Theses faults may allow combustible substances to leak, that in turn may come into contact with a spark and cause the substance to explode [5].
Plant
Plant explosions may occur because of some reasons such as: (1) if heavy machinery was not well-maintained and expected, (2) failure to utilize reasonable care in handling combustible substances, (3) faulty electrical systems, (4) unsafe work conditions, and (5) chemical spills [5].
Warehouse
Most industrial plants utilize warehouses to store chemicals and materials necessary to carry out their functions. Warehouse fires lead to explosions, and they occur because of negligent actions which include: (1) smoking near flammable liquids, (2) carelessly transporting potentially combustible substances, and (3) stacking reactive substances close together [5].
Residential gas explosions Utility that provides a residential service Boiler and furnace
Explosions occur because of matter’s out of the homeowner’s
control which include: (1) installation errors, (2) design defects, and (3) maintenance errors [5].
Appliance Explosions happen because of the following causes: (1) poorly designed or manufactured, (2) improperly maintained and repaired, and (3) improperly installed [5].
Wiring Homes are equipped with a network of wires to transfer electricity into homes from the power grid. If faulty wiring come into contact with natural gas, an explosion will happen [5].
Refinery explosions Production facility for crude oil N/A
Large quantities of flammable gases can be produced during several cases including: (1) undetected leaks in the operating equipment, (2) from upset conditions in the normal refinery operations, (3) from startups and emergency shutdowns, and (4) during scheduled maintenance activities of the refinery. Today, the flaring safety technique is being required for the control of gaseous combustible emission from refinery sources. However, the flare system itself can present an explosion potential of a flare [5,17].
14
CHAPTER 3: THE ART OF READING EXPLOSION
VERSUS NON-EXPLOSION PHENOMENA
In this section, we present the science behind the volcanic eruptions (natural explosions) and nuclear explosions (man-made explosions) in terms of how they normally occur. In this context, we describe different physical properties of these phenomena that, in turn, have led to interpret the patterns of color images from image processing point of view. Consequently, color images are taken within the visible light spectrum range of approximately 400-700nm wavelength. These processed color images are 2-dimensional arrays of pixels with each pixel having RGB components.
3.1 Volcanic Eruptions
A volcano is a spectacular event in the life of the Earth, and it is proof that the Earth is alive, active, and ever-changing. Thus, it is the Earth’s natural mechanism of cooling off
and releasing internal pressure and heat, which in turn causes rocks to melt and produce
magma that is allowed to escape from the magma chamber through a vent in the Earth’s
crust. Therefore, as magma moves up, it loses dissolved gas and bubbles form in it. This is a driving force behind eruptions [2,18,19].
The violence of volcanic eruptions is controlled by two factors including silica content and gas content. As the silica content of magma is increases, the magma gets more viscous and it becomes stickier. Consequently, the stickier the magma is, the more viscous the magma, and the more violent the generated eruption will be, and it becomes more
15
difficult for the gas to escape from magma that is highly viscous. The gas content of the magma is the second factor. Hence, the more gas, the more violent the eruption will be, while the less gas, the less violent the eruption will be [2].
Based on the eruptive style of the volcano and materials ejected during the eruption, three patterns types of a volcanic eruption scene can be defined including: (1) patterns of pyroclastic density currents, (2) patterns of lava fountains, and (3) patterns of lava and tephra fallout. Consequently, the description of each phenomenon is given as follows:
3.1.1 Patterns of Pyroclastic Density Currents
Pyroclastic Density Currents (PDCs) phenomena are usually the most destructive and deadly of all types of volcanic phenomena [8]. PDCs are mixtures of hot gases associated with pyroclastic materials that flow over the ground under the effect of gravity. The PDC phenomenon may generate from different mechanisms [1, 20-24]. For example, gravitational collapse of domes (Figure 3.1a) [25], partial column collapse (Figure 3.1b) [26], dome explosions (Figure 3.1c) [27], overpressure at the vent (Figure 3.1d) [28], steam-driven eruption column (Figure 3.1e) [29], lateral blast (Figure 3.1f) [30], boiling-over (Figure 3.1g) [31], and continuous column collapse (Figure 3.1h) [31].
Furthermore, the PDC phenomenon can be either a short-lived or relatively long-lived. The short-lived PDC is considered highly unsteady phenomenon, whereas the relatively long-lived PDC is considered sustained unsteady to quasi-steady phenomenon. The duration of both the transient current (short-lived) and sustained current (long-lived) rely on the volumetric flow rate as well as the total flow volume, influencing the behavior
16
of the PDCs phenomena [22]. Figure 3.1a-f represent mechanisms of short-lived PDCs. In contrast, Figure 3.1g and Figure 3.1h represent mechanisms of long-lived PDCs.
From image processing point of view, PDCs patterns have color property that can be white (e.g., Figure 3.1e), or brown/brownish (e.g., Figure 3.1d), or dark colors ranging from gray to black shades (e.g., Figures 3.1f, g), have non-luminous dense cloud shapes, and have multiple manifestation (shapes) including: vertical column, laterally spread, avalanches that are generated by lava dome and moving downslope of the volcano, and some volcanic eruptions can produce natural mushroom clouds under the gravity force.
(a) (b) (c) (d)
(e) (f) (g) (h)
Figure 3.1 Patterns of PDCs. (a) The volcanic eruption of Soufriere Hills in Montserrat occurred on January 16, 1997 (photo credit: Richard Heard, Montserrat Volcano Observatory) [25]; (b) Mayon volcano occurred on September 23, 1984 (photo credit: Nicolas Lardot, Wikimedia Commons website) [26]; (c) Soufriere Hills volcano, Montserrat (photo credit: Barry Voight, National Science Foundation website - date of the image is unknown) [27]; (d) Bromo volcano, East Java, Indonesia, occurred on 8 June, 2004 (photo credit: D. Wijayanto, Tom Pfeiffer/ www.VolcanoDiscovery.com) [28]; (e) The eruption of Guagua Pichincha volcano, west of the capital Quito, Ecuador occurred on October 7, 1999 (photo credit: U.S. Geological Survey, Department of the Interior) [29]; (f) Mt. St. Helens volcano, Washington State, USA, occurred on May 18, 1980 (photo credit: U.S. Geological Survey, Department of the Interior) [30]; (g) The Tonga undersea volcanic eruption occurred on March 18, 2009 (photo credit: YouTube website) [31]; (h) The photo description and credit as per Figure 3.1g [31].
17
3.1.2 Patterns of Lava Fountains
Effusive eruptions such as shield volcanoes and fissure volcanoes produce lava that is magma rises towards the surface of the Earth, and flows out of the volcano as a viscous liquid. Typically, lava fountains and flows are varied and have multiple physical properties including [32]: (1) thickness, (2) length, (3) shape, and (4) width which depends on the following factors: lava type that is being erupted, discharge, slope of the ground where the lava travels, and the eruption duration. For example, Figure 3.2a shows Kamoamoa eruption in Kilauea, Hawaii, on March 5, 2011 [33], and Figure 3.2b displays the Kilauea's
East Rift Zone (Puʻu ʻŌʻō) eruption on September 1983 [34].
(a) (b)
Figure 3.2 Patterns of lava fountains. (a) Fissure volcano: Kamoamoa eruption, Kilauea, Hawaii, on March 5, 2011 [33] (photo credit: U.S. Geological Survey, Department of the Interior); (b) The
outpouring of lava fountains from the active shield volcano of Kilauea's East Rift Zone (Puʻu ʻŌʻō)
on September 1983 (photo credit: U.S. Geological Survey, Department of the Interior) [34].
Lava fountains patterns have two properties from image processing point of view. First, a luminous glowing region. Second, the color of the lava during the eruption [1]. Accordingly, the color of the lava is based on its temperature. For example, it is stated in [35] that lava may glow white at approximately 1150 ºC, golden yellow when its
18
temperature nearly 1090 ºC, orange at about 900 ºC, bright cherry red at almost 700 ºC, dull red when its temperature around 600 ºC, or has the lowest visible red color at approximately 475 ºC. As a matter of fact, the hotter the object, the brighter the light emitted will be. This process is called incandescence where the heat energy is turning into light energy.
3.1.3 Patterns of Lava and Tephra Fallout
During an explosive or effusive eruption, a pattern can be formed when both the lava and tephra fallout are emitted directly from a volcano [1]. Tephra can be defined as a generic phrase for the accumulation of any airborne pyroclastic materials, for instance, fine ash, coarse ash, lapilli (cinders), Pele’s hair, Pele’s tears, blocks, bombs, and others. These materials are different in terms of type, size, shape, and condition when ejected from a volcanic vent [36].
Furthermore, Figure 3.3a depicts a volcanic fissure at which lava fountains of 100-400m high and massive billowing volcanic ash clouds expelled near the Montagnola summit on July 24, 2001 [37]. Figure 3.3b represents lava and tephra fallout generated
from the Eruption of Pu‘u ‘Ö‘ö, Kilauea, Hawaii, in 1984. Tephra fallout, in this example,
is a combination of cinder, Pele’s hair, and Pele’s tears [38]. Figure 3.3c demonstrates lava and tephra fallout generated from the explosive eruption of Eyjafjallajökull in the island of Iceland that occurred on April 14, 2010 [39]. Figure 3.3d illustrates the effusive eruption (basaltic volcanism) of Mt. Etna, Sicily, Italy which occurred in November 2002 [40].
19
(a) (b) (c) (d)
Figure 3.3 Patterns of lava and tephra fallout. (a) Lava fountains and massive billowing volcanic ash clouds expelled near the Montagnola summit of Etna volcano which occurred on July 24, 2001 (photo credit: Tom Pfeiffer/ www.VolcanoDiscovery.com) [37]; (b) lava and tephra fallout
generated from the Pu‘u ‘Ö‘ö eruption, Kilauea, Hawaii, in 1984 (photo credit: U.S. Geological
Survey, Department of the Interior) [38]; (c) Explosive eruption of Eyjafjallajökull in the island of Iceland occurred on April 14, 2010 (photo credit: David Karnå, Wikimedia Commons website) [39]; (d) Effusive eruption (basaltic volcanism) of Mt. Etna, Sicily, Italy, occurred in November 2002 (photo credit: Tom Pfeiffer/ www.VolcanoDiscovery.com) [40].
From image processing point of view, lava and tephra patterns have the following properties. (1) A luminous glowing region that represents the lava, (2) a non-luminous region that represents the tephra fallout, (3) the color of the lava that relates to its temperature, and (4) the color of the tephra that depends on the pyroclastic materials types that are being emitted during an explosive or effusive eruption [1]. For example, the tephra fallout can be either dark colored pyroclastic of basaltic to andesitic scoria or light colored pyroclastic of felsic pumice and ash [41].
3.2 Nuclear Explosions
A nuclear explosion is defined as an explosion for which the energy is released by a nuclear transformation, either by fission or fusion [4]. Typically, nuclear explosions are classified based on the location of the point of burst in relation to ground zero [1]. Hence,
20
nuclear explosions have the following five subcategories. (1) high altitude nuclear explosion (outer space detonation), (2) atmospheric nuclear explosion (air burst), (3) surface nuclear explosion, (4) deep underground nuclear explosion, and (5) shallow underwater nuclear explosion. In contrast, we propose to classify nuclear explosions based on the shape characteristic from image processing point of view. Thus, we define two patterns. (1) a mushroom-shaped cloud that is typically formed by the following types of nuclear explosions: atmospheric, surface, deep underground, and shallow underwater, and (2) an artificial aurora view associated with an ionized region that is formed by the space (high-altitude) explosion. A brief description behind the scientific formation of both nuclear explosion patterns is given in this section.
3.2.1 Patterns of Mushroom-Shaped Clouds
The formation of a nuclear mushroom-shaped cloud can be described through an example of a shallow underwater explosion, the Baker test that was conducted at Bikini Lagoon in 1946 [42]. At the beginning of the explosion, the water near the explosion was illuminated by the fireball formation. However, the water waves caused distortion on the surface of the lagoon that prevented a clear view of the fireball. The hot gas bubble underwater initiates a shock wave. Intersection of the shock wave with the surface produces a slick that is a ring of darkened water that is rapidly expanding, while the reflection of the water shock wave at the surface causes a crack. A crack is a white circular patch behind the dark region. Then, a spray dome (a column of broken water and spray) is thrown up over the point of burst. The sides of the spray dome become steeper when the water rises.
21
The disturbance created by the underwater burst causes a series of waves to move outward from the center of the explosion across the surface of the lagoon, where the test was conducted. The water flowed into the cavity as the pressure of the bubble was released that caused the water to be thrown up as a hollow cylinder, or chimney of spray, called the
“column/plume.” The radioactive contents of the bubble were vented through the hollow column and formed a cauliflower-shaped cloud at the top in a shallow underwater explosion that concealed part of the upper portion of the column. The cloud contained some of the fission products, weapon residues, and a large amount of water in droplet form [42]. Figure 3.4 depicts the mushroom-shaped cloud of the underwater Baker nuclear explosion [43].
Figure 3.4 Mushroom-shaped cloud of the underwater Baker nuclear explosion in 1946 (photo courtesy of National Nuclear Security Administration/ Nevada Field Office) [43].
22
From image processing viewpoint, nuclear explosions patterns have the following five properties. First, the color property where the initial color of the mushroom cloud of a nuclear expulsion is red/reddish. When the fireball cools, water condensation leads to the white color characteristic of the explosion cloud [4], and secondly, growth of the nuclear mushroom-shaped cloud, where it keeps rising until it reaches its maximum height. Third, the shape which can be either mushroom-shaped cloud, or artificial aurora display with ionized region in case of space explosions. Fourth, the luminous region of the image at which a luminous fireball can be viewed as flash or light from hundreds of miles away for about 10s, and then it is no longer luminous. Thus, the non-luminous growing cloud appears for approximately 1–14 minutes, and fifth, the orientation where the mushroom-shaped cloud has a single orientation.
3.2.2 Patterns of the Artificial Aurora Display with an Ionized Region
The display of the artificial aurora with an ionized region is due to the effect of the electromagnetic pulse (EMP) of the high-altitude nuclear explosion from outer space. EMP effect can be described as follows [4]: a photon has an energy of several million electron volts that is a typical energy for gamma radiation emitted by a high-altitude nuclear explosion. When photons interact with atoms of the air in the atmosphere (nitrogen and oxygen), large parts of its energy will be transferred to the electrons on atoms. As a result of this collision process, gamma rays have reduced energy, while the electrons have accelerated and are thus stripped from atoms, producing an extensive ionized region called
23
a “deposition region” where the electron currents are formed. This is known as the Compton Effect. A charged particle (electrons) in the magnetic field of the Earth will describe a circular motion. In order to maintain a circular motion or helical path, the electrons must continually accelerate inward toward the circle’s center. The acceleration is
due to the continual charge in the direction of the electron velocity, and it produces electromagnetic radiation known as synchrotron radiation. These effects make up an EMP. However, this representation is not possible for other kinds of explosion phenomena. Figure 3.5 represents the artificial aurora with deposition region formed by Starfish space explosion in 1962 [44].
Figure 3.5 Starfish artificial aurora with deposition region as seen from an aircraft in 1962 (photo credit: Gregory Walker, Trinity Atomic Web Site) [44].
This dissertation will only focus through the experiments on identifying and classifying the nuclear explosions that form the mushroom-shaped cloud because of the lack of images of the high-altitude explosions.
24
3.3 Non-Explosion Phenomena
In this section, we propose to define three patterns of non-explosion phenomena from image processing point of view against the aforementioned patterns of explosion phenomena that were defined in sections 3.1 and 3.2. Consequently, non-explosion patterns include: wildfires, fireworks, and sky clouds. The aim of adding these patterns to the framework is to evaluate the reliability and the robustness of the strategy adopted in this dissertation.
3.3.1 Patterns of Wildfires
Wildfires patterns from image processing point of view contain a non-luminous region, a luminous region, or both. The luminous region that usually appears in the scene of a wildfire is related to the flame that is produced during the flaming phase of the combustion process, and its color variation depends on the type of the material being burned, how hot it's burning, and the amount of oxygen that is available to turn all the carbon into Carbon dioxide (CO2). The flame color of the wildfires typically glows red
transmitting to orange, then to yellow. On the other hand, the non-luminous region of a wildfire scene is related to the smoke that is generated during the smoldering phase of the combustion process. This smoke tends to reflect the light making the smoke appears white. Likewise, tree trunks and big branches may have large amounts of moisture that are prone to smolder and emit steam that turns the smoke white. In addition, a black soot of fine particles is formed and released into the air during the hot burning of the dry underbrush. Thus, the smoke may appear black in a wildfire scene [1,45].
25
3.3.2 Patterns of Fireworks
Fireworks patterns from image processing point of view have the following properties. First, a black background because they are typically displayed in the night. Second, they have multiple ignitable shapes such as: glitter, spinner, tail, willow, brocade, stars, and others. Third, they have different colors that are related to the type of the metal salt which produces a light that travels at a specific wavelength [46-48].
3.3.3 Patterns of Sky Clouds
Clouds patterns from image processing point of view have different shapes. For example, high-level clouds include Cirrus that have wispy and feathery shape, Cirrostratus have relatively transparent form of a widespread veil-like layer, and Cirrocumulus that are layered clouds performed with small cumuliform lumpiness, and have rippled shapes, whereas mid-level clouds include Altostratus that possess a flat and uniform type texture, Altocumulus that are heap-like clouds, and Nimbostratus that have dark, thick, and lumpy layer. Furthermore, low-level clouds include Stratus that are dull gray clouds that developed horizontally, and Cumulus that are the stereotypical fluffy clouds that developed vertically, Stratocumulus that are small lumpy clouds, and Cumulonimbus that are tall and fluffy. In addition, color of the clouds is the second property. When all different colors of light hit a water droplet or ice crystal of the cloud that has an average size of about 10 micrometers. They scatter equally into colors of rainbow; then they combine to produce a white light. Hence, clouds typically appear white [49,50].
26
CHAPTER 4: LITERATURE SURVEY
In this section, we explore existing literature that addresses various approaches for detection and categorization of nuclear explosions and volcanic eruptions. Moreover, we provide examples of the current programs for monitoring these phenomena in the United States. In addition, we highlight the limitations of the existing surveillance systems for explosions.
4.1
Existing Literature on Monitoring Volcanic Eruptions and
Nuclear Explosions
Roth and Guritz [51] developed a system to predict and to display volcanic ash cloud movements utilizing meteorological data and eruption parameters for input. The model can predict the volcanic ash particle density in the atmosphere as a time function. Eruption parameters for the model include: the volcano’s geographical location, time, the
eruption duration, the plume’s altitude, the particle density, and the distribution of the
particle density.
Ando [52] conducted experiments to remove the interfering signals of temperature and pressure from the output of continuously running spring gravity meters. Hence, more accurate results can be achieved using high sensitive instruments in a harsh environment to monitor an active volcano such as the Mt. Etna volcano located in Italy. Furthermore, Ando monitored the physical behavior of lava flow by measuring two components of the cooling process of lava flow that included conductive and radiant heat transfers.
27
Nugroho and Winarko [53] built a conceptual surveillance system for volcanic eruptions by integrating the Geographical Information System (GIS) and the concept of Service-Oriented Architecture (SOA) using Enterprise Service Bus software (ESB). This system may improve the job performance of geologists and volcanologists when volcanoes occur in order to mitigate the volcanoes’ impact.
Werner-Allen et al. [54] deployed a small wireless sensor array for three days at the Tungurahua volcano in Ecuador in 2004. Three Mica2 motes equipped with microphones were installed to detect infrasonic signals (low frequency acoustic) that were produced from the erupting volcano. In addition, an event detector was developed to trigger the transmission of data automatically as soon as multiple nodes received a well-correlated signal. This technique was evaluated based on bandwidth usage, reduced energy, and detection accuracy of infrasonic signals.
Likewise, Werner-Allen et al. [55] deployed a sensor network of 16 nodes for 19 days on the Reventador volcano in Ecuador. Moteiv TMote Sky platform of the wireless sensor network was used. Each node was equipped with a seismometer and a microphone to gather seismic and acoustic data of the volcanic eruption activity. Data were transmitted through a multi-hop path to a gateway node which, in turn, is connected to a long-distance FreeWave modem that provides a radio connectivity with a laptop. Additionally, a GPS receiver was used for time synchronization.
Tan et al. [56] proposed a real-time quality-driven technique to detect volcanic earthquakes. Two sensing algorithms were developed: (1) the Bayesian detection approach that used the joint statistical model of the seismic signal energy as well as the frequency spectrum, and (2) a sensor selection algorithm. Furthermore, a two-phase earthquake onset
28
time estimation technique was developed. Lastly, these algorithms were implemented on a 24 TelosB motes testbed, and then experiments were conducted based on traces of real data gathered for five and a half months from the Mt. St. Helens volcano, which contained over 128 important earthquake events.
In addition to the wireless sensor-based techniques used to detect seismic and acoustic data of volcanic eruptions, several computer vision-based techniques were used to monitor volcanic eruptions. In this view, Jinguuji and Ehara [57] proposed a remote sensing system by employing satellite images to compute the volcanic ash. This system is based on a physical model of volcanic ash motion. The model was tested on the Kuju volcanic eruption in Japan that occurred in 1995.
In the Lawrence Livermore National Laboratory [58], researchers presented the use of radar images taken from satellites that used the InSAR technique to monitor the Earth’s
surface from space. Researchers analyze these images to detect very small subsurface changes caused by underground nuclear explosions, and volcanic hazards. In addition, these researchers run simulations to characterize deformations.
Andò and Pecora [59] presented a new measurement tool that performed a real-time automatic thermographic analysis that used frames acquired by a thermal camera for volcanic activities of Mt. Etna and Stromboli in Italy. After the processing of a frame sequence, various information was provided that includes: the typology of the eruption, aspect, aspect ratio, maximum height, maximum width, and the duration of the analyzed sequence.
Langer et al. [60] classified volcanic tremor data at Mt. Etna in Italy based on supervised and unsupervised pattern classification techniques. Supervised classification
29
was applied on an image dataset of four target categories namely: post-eruptive, eruptive, pre-eruptive, and lava fountain (effusive eruption). The totality of their dataset was 425 samples. Furthermore, the power feature was measured in frequency intervals, then a multilayer perceptron technique (MPL) and support vector machine approach (SVM) were employed for classification. During the testing scheme, the output label was either ‘1’ for
the class, or ‘0’ for all other classes. The SVM achieved an accuracy of 94.8%, and the MLP achieved an accuracy of 81.9%. On the other hand, unsupervised categorization was attained by employing self-organizing maps and cluster analysis approaches.
Iyer et al. [61] introduced a detection system for volcanic eruptions based on infrasonic signals. These signals contain information regarding the volcano’s intensity that provides an approximation of ash column height. Consequently, unique cepstral-based features were extracted from the infrasonic signature of the volcano, and then fed into a radial basis function neural network to distinguish eruptive activity among these three volcanoes including: Kasatochi located in Alaska, Tungurahua located in Ecuador, and Mt. St. Helens located in USA. Consequently, a total number of 25, 356 infrasonic data was obtained from the global infrasonic monitoring network dataset, and the waveform of each class was divided into 20 segments. Volcanic eruptions, based on the height of the ash column, were classified into the following classes: Strombolian, Vulcanian, Subplinian, and Plinian. As a result, a classification rate of 97% was achieved.
Also, Picchiani et al. [62] employed a single layer neural network to classify ash, or non-ash, and to retrieve the ash mass. Moreover, five datasets of MODIS images in the TIR spectral range were gathered in the 2001, 2002, and 2006 from the Mt. Etna volcanic eruptions. Each dataset includes 810, 000 samples. The architecture of the neural network
30
included: the input space of three MODIS channels: CH28, CH31, and CH32, as well as a single hidden layer, and a single output layer. Results showed that approximately 90% accuracy was achieved.
Additionally, Marzano et al. [63] utilized a ground-based microwave weather radar system to perform the detection (dynamical monitoring) of a volcanic ash cloud, a quantitative retrieval of a volcanic ash cloud, concentration, and fall rate. The quantitative information was based on three classes: lapilli, coarse ash, and fine ash. As a result, in Plinian and sub-Plinian volcanic eruptions cases, ash particles can be characterized through modeling results and experimental results.
Similarly, Boccia et al. [64] introduced a ground-based remote sensing system for volcanoes using the L-band microstrip array. The developed antenna is part of the Volcano Doppler Radar (Voldorad). The system retrieves the mass data and the velocity. The proposed array configuration was designed via shortened rectangular patch antennas (microstrip radiators with improved directivity). Hence, the Voldorad antenna was integrated with the radar for the remote sensing of the summit eruptions of Mt. Etna [64].
Aside from the discussion of volcanic eruptions monitoring found in the literature, several researchers studied many techniques to monitor nuclear explosions.
Dickinson and Tamarkin [15] explored several approaches to retrieve detection, location, and time information about nuclear explosions that are conducted in the atmosphere and in space (high-altitude). These approaches include: (1) acoustic; (2) debris sampling; (3) radio flash or electromagnetic pulse (EMP); (4) satellites which use instruments to measure radiation from a nuclear detonation, such as X-rays, gamma-rays, and neutrons; (5) atmospheric fluorescence; (6) radio techniques that include: very low
31
frequency (VLF), low frequency (LF), high frequency (HF), radio sounders, cosmic noise (Riometer); (7) magnetic telluric; and (8) sunlight resonance scatter from debris.
Additionally, Lindgen [65] provided criteria on how to identify and detect seismic waves of underground nuclear explosions versus earthquakes.
4.2
Programs for Monitoring Volcanic Eruptions and Nuclear
Explosions in the U.S.
Current literature addresses how the U.S. Geological Survey (USGS) monitors volcanic eruption phenomena [10, 66-69]. Figure 4.1 depicts the volcanic monitoring techniques that are employed by the USGS Volcano Hazards Program as follows: (1) detecting volcanic tremor (harmonic tremor); (2) hydrologic monitoring; (3) gas emission; (4) temperature measurements using thermocouples, Thermal Infrared Radiation (TIR) video cameras, and infrared satellite sensors; (5) satellite remote sensing such as Moderate Resolution Imaging Spectroradiometer (MODIS); and (6) monitoring volcano ground deformation by using: Electronic Distance Meter (EDM), Tiltmeter, Global Positioning System (GPS), and Interferometric Synthetic Aperture Radar (InSAR) images.
32
Figure 4.1 Volcanic monitoring techniques that are employed by the USGS Volcano Hazards Program (photo credit: U.S. Geological Survey, Department of the Interior) [68].
In addition to the programs that are currently applied by USGS to monitor volcanic eruptions, the EarthScope USArray program deploys a dense network of seismographic stations across United States. USArray consists of 400 broadband stations in a Transportable Array (TA) in a grid of locations with approximately 70 km spacing. Data that are acquired and analyzed from TA will lead to detection of abnormal seismic events such as an underground nuclear explosion [70]. Figure 4.2 illustrates the TA [71].
33
Figure 4.2 Transportable Array (photo credit: IRIS Data Management Center, EarthScope, and National Science Foundation) [71].
4.3 Limitations of the Existing Surveillance Systems for
Explosions
Current systems that are installed for monitoring volcanic eruptions have limitations in temperature measurements, detection of ash clouds, detection of ground deformation, and transmission time of satellite systems. For example, the thermocouple probe that is used for measuring the lava temperature cannot be applied to difficult volcano locations. Since volcanologist can only perform the direct temperature measurements within the vicinity of a volcano, safe conditions must exist. Temperature measurements can also be made from a distance with cameras that measure thermal infrared radiation
34
(TIR). However, TIR cameras can be completely or partially obscured by volcanic thick clouds (PDCs). Moreover, existing infrared satellite sensors capture only lava images of large areas with low resolution that limit the retrieval of fine-scale details from the volcanic thermal features [10].
Another limitation occurs when ground-based microwave radar systems are employed to measure volcanic fine ash. The fine ash becomes invisible to the radar system for distances greater than 50 km. Hence, the radio waves will not be reflected towards Earth, and might not be detected [11]. Conversely, ash cloud height and depth can be measured through observations generated from ground-based Light Detection and Ranging (LiDAR) optical systems. LiDAR systems typically demonstrate a higher sensitivity to the content of ash clouds as compared to microwave instruments, but counterbalanced by stronger path attenuation effects [12]. The data collection and processing performed by LiDAR systems can be time consuming. LiDAR equipment is also expensive [13].
The GPS is deployed to monitor the ground deformation of a volcano. However, the operational utility of the GPS is limited because it provides a small spatial and temporal coverage [14]. Furthermore, the limitation of the MODIS satellite remote sensing instrument is that MODIS retrieves ash clouds images within a lengthy time frame of fifteen to thirty minutes [6].
With regard to the limitations of nuclear detection systems that are deployed in the atmosphere and space, there are several contextual problems and difficulties related to the grid pattern of the system, the geography, and the site location.
Accordingly, acoustic systems can be affected by some natural phenomena such as volcanic eruptions, tornado, aurora, meteor, earthquake, wind patterns, an
![Figure 3.1 Patterns of PDCs. (a) The volcanic eruption of Soufriere Hills in Montserrat occurred on January 16, 1997 (photo credit: Richard Heard, Montserrat Volcano Observatory) [25]; (b) Mayon volcano occurred on September 23, 1984 (](https://thumb-us.123doks.com/thumbv2/123dok_us/472465.2555806/35.918.163.817.451.764/patterns-volcanic-eruption-soufriere-montserrat-montserrat-observatory-september.webp)
![Figure 3.2 Patterns of lava fountains. (a) Fissure volcano: Kamoamoa eruption, Kilauea, Hawaii, on March 5, 2011 [33] (photo credit: U.S](https://thumb-us.123doks.com/thumbv2/123dok_us/472465.2555806/36.918.227.737.518.727/figure-patterns-fountains-fissure-volcano-kamoamoa-eruption-kilauea.webp)

![Figure 3.4 depicts the mushroom-shaped cloud of the underwater Baker nuclear explosion [43]](https://thumb-us.123doks.com/thumbv2/123dok_us/472465.2555806/40.918.170.779.528.949/figure-depicts-mushroom-shaped-underwater-baker-nuclear-explosion.webp)
![Figure 3.5 represents the artificial aurora with deposition region formed by Starfish space explosion in 1962 [44]](https://thumb-us.123doks.com/thumbv2/123dok_us/472465.2555806/42.918.165.811.480.810/figure-represents-artificial-aurora-deposition-region-starfish-explosion.webp)

![Figure 4.2 Transportable Array (photo credit: IRIS Data Management Center, EarthScope, and National Science Foundation) [71]](https://thumb-us.123doks.com/thumbv2/123dok_us/472465.2555806/52.918.173.798.105.518/figure-transportable-management-center-earthscope-national-science-foundation.webp)