Gender Differences
in Investment Behavior*
Milestone 3 Report
August 31, 2006
Please direct inquiries to:
Tahira HiraIowa State University, President’s Office 1750 Beardshear Hall Ames, Iowa 50011-2035 Phone: 515-294-2042, Fax: 515-294-0565 E-mail: [email protected] or Cäzilia Loibl
The Ohio State University,
Department of Consumer Sciences 1787 Neil Avenue, 265N Campbell Hall Columbus, Ohio 43210
Phone: 614-292-4226; E-Mail: [email protected]
Presented to the
NASD Investor Education Foundation * Funded by NASD Investor
Table of Contents
Executive summary... 1
1. Study objectives... 7
Procedures and methods ... 7
2. Demographic and economic characteristics... 10
Demographic characteristics ... 10 Age ... 12 Race... 13 Marital status... 14 Family size ... 15 Education ... 16 Economic characteristics ... 17 Employment status... 19 Occupation ... 19 Household income ... 21 Household assets ... 22 Financial obligations ... 23
3. Investor financial management behavior... 24
Saving behavior ... 24
Daily money management ... 26
Savings behavior during the past six months... 27
Ownership of various savings and retirement accounts... 28
Investment behavior... 29
Household investment decision-maker ... 31
Investment activities over the past twelve months ... 32
Investment activities planned for the future six months ... 34
Willingness to take investment risk ... 35
Ownership in investment accounts ... 36
4. Investor actions... 37
Sources of investment information and the use of technology ... 37
Sources of financial information... 37
Use of technology and computer-related investment tools... 40
Reasons for not using the Internet for investment purposes ... 41
Reasons for not using investment software ... 43
Investment decision-making processes... 44
Actions taken before making investment decisions... 44
Actions taken when investment results were below expectations ... 46
Change in involvement in saving and investing over the years... 48
Change in level of involvement in saving and investing ... 49
Change in involvement as a result of specific life events ... 50
Specific life events causing change in saving and investing involvement ... 51
5. Investor socialization... 52
Parents’ influence on money management ... 52
Parents’ conversations about money... 54
Gender Differences in Investment Behavior
Parents’ and teachers’ influence on investment learning... 57
6. Predictors of investor intention... 59
Investment learning preferences ... 59
Attitudes and beliefs about investing ... 61
Investor attitudes ... 65
Investor perceived behavioral control... 66
Opinions toward financial advisors ... 68
7. Conclusion and implications... 71
8. References... 77
9. Appendix... 78
Telephone interview questionnaire ... 78
Telephone interview screening questions ... 93
Tables Table 1: Demographic characteristics... 11
Table 2: Respondents’ socio-economic characteristics ... 17
Table 3: Respondents’ socio-economic characteristics continued... 18
Table 4: Savings behavior... 25
Table 5: Investment behavior characteristics... 30
Table 6: Sources of financial information ... 39
Table 7: Use of computer-related investment tools ... 41
Table 8: Reasons for not using Internet for investment purposes... 42
Table 9: Reasons for not using investment software ... 44
Table 10: Actions taken before making investment decisions... 46
Table 11: Actions taken when investment results were below expectations ... 47
Table 12: Change in involvement in saving and investing over the years... 48
Table 13: One’s parents’ influence on money management... 53
Table 14: Parents’ conversations about money ... 55
Table 15: Feeling financially secure in one’s family... 56
Table 16: Parents’/teachers’ influence on investment learning ... 58
Table 17: Learning about investing ... 61
Table 18: Investor beliefs... 64
Table 19: Investor attitudes... 66
Table 20: Respondents’ perceived investment control ... 68
Table 21: Respondents’ experience with financial advisors... 70
Figures
Figure 1: Age groups (in percent)... 12
Figure 2: Race (in percent) ... 13
Figure 3: Marital status (in percent)... 14
Figure 4: Family size (in percent)... 15
Figure 5: Education (in percent) ... 16
Figure 6: Employment status (in percent)... 19
Figure 7: Occupation (in percent) ... 20
Figure 8: Household income categories (in percent) ... 21
Figure 9: Household assets (in percent)... 22
Figure 10: Financial obligations (in percent)... 23
Figure 11: Daily money management (in percent) ... 26
Figure 12: Savings or investment deposits in past six months (in percent)... 27
Figure 13: Ownership in banking products (“yes” responses in percent)... 28
Figure 14: Investment decision maker (in percent) ... 31
Figure 15: Investment activities of the previous twelve months (in percent)... 33
Figure 16: Investment activities of the future six months (“yes” responses in percent)... 34
Figure 17: Willingness to take investment risk (in percent) ... 35
Figure 18: Ownership in investment accounts (in percent) ... 36
Figure 19: Sources of financial information ... 38
Figure 20: Use of computer-related investment tools... 40
Figure 21: Reasons for not using Internet for investment purposes ... 42
Figure 22: Reasons for not using investment software (“yes” responses in percent) ... 43
Figure 23: Actions taken before making investment decisions ... 45
Figure 24: Actions taken when investment results were below expectations... 47
Figure 25: Change in involvement in saving and investing (in percent) ... 49
Figure 26: Changes in involvement as a result of unfolding events or critical incidences... 50
Figure 27: Specific life events causing change in involvement (in percent) ... 51
Figure 28: One’s parents’ influence on money management (in percent)... 53
Figure 29: Parents’ conversations about money (“often” responses in percent) ... 54
Figure 30: Feeling financially secure in one’s family ... 56
Figure 31: Parents’/teachers’ influence on investment learning... 57
Figure 32: Learning about investing ... 60
Figure 33: Investor beliefs (“agree” and “strongly agree” responses in percent)... 62
Figure 34: Investor beliefs continued (“agree” and “strongly agree” responses in percent) ... 63
Figure 35: Investor attitudes (“agree” and “strongly agree” responses in percent) ... 65
Figure 36: Perceived behavioral control ... 67
EXECUTIVE SUMMAR
Y
Gender Differences
in Investment Behavior*
Executive summary
Study objectives
The overall purpose of this research project is to gain knowledge about key factors that influence investment behavior and ways these key factors impact investment decision-making processes among men and women. It further explores types of educational processes and materials that can transform investment behaviors among women. To this end, the proposed research project consists of two distinct parts: (1) collection of data on key variables using a national random sample, followed by analysis of these data to produce results that can be generalized to all Americans; and (2) development of guidelines and approaches to develop gender-specific investment education materials.
Unique features of the study
The unique features of this study are: (a) a randomly selected national data set; (b)
generalizability of the results to American investors; (c) empirical evidence for the roles personal and environmental factors play in influencing the investment behavior; (d) application of the transformative learning concept to explain how key personal and environmental factors interact through socialization and acculturalization, resulting in a gender-related view about teachable moments and investing; (e) the development of gender-specific investment educational
guidelines and materials; and (f) the development of a new approach to investment education for adult women.
Procedures
This study is based on the responses of a randomly selected national sample of 911 U.S. households with annual household incomes of $75,000 or higher. The data were collected through telephone interviews conducted from October 2005 to February 2006 by trained staff of the Center for Survey Statistics and Methodology (CSSM) at Iowa State University. The average interview length was twenty-two minutes. Information was collected on various aspects of respondents’ investment behaviors, attitudes, and beliefs. The overall adjusted response rate for this study was 22%.
Key findings
Investor profile
The average participant was highly educated, male, forty-nine years old, white, married, and living in a three-member household. He was employed full-time in a professional field and had an average annual household income of $126,290, average total assets of $1,129,477, and average financial obligations of $231,791. Only one-third of the respondents in the study were
Gender Differences in Investment Behavior
women. On average the women of this sample were highly educated, employed in professional fields, and had good salaries and large asset bases. Compared to their male counterparts, however, they had lower annual incomes, owned fewer assets, and faced greater financial obligations.
Financial management behavior
More women than men indicated that they were responsible for daily money management tasks; however, most of them seemed to be doing so in partnership with a spouse or partner. On the other hand, men who were involved in taking care of these tasks mostly did it on their own. A majority of the participants reported that they saved regularly during the past six months and that they had savings accounts, retirement accounts, and life insurance policies. Equal proportions of men and women indicated saving money during six months prior to the interview, but women were more likely to have Certificates of Deposit whereas more men had IRA accounts.
Investment behavior
A majority of the respondents said that they made investment decisions jointly with their spouse or partner and invested in stocks or stock mutual funds. About half of them had invested in money market mutual funds, bonds, or bond mutual funds.
Almost all of the respondents indicated that they had reviewed their investment performance over the twelve months prior to the interview. About half of them had either increased the amount invested, changed the asset allocation, or consulted with financial advisors. Similarly, almost all of them suggested that during the next six months they would pay attention to how their investments performed. Gender differences in these areas were not significant, but the willingness to take risk varied significantly between men and women. A majority of the women in the study preferred taking average or below-average risks, whereas about half of the men preferred taking above-average or substantial investment risks.
Investment information
Financial advisors and print media were the major sources of financial information for this sample. Less frequently, respondents used personal computer-based investment tools primarily for investment analysis or management. While reluctance to use personal computers and the Internet is described often in the literature, we also inquired about the little-known reasons for this behavior. We learned that security concerns and confusing websites were the most common deterrents. More than half of respondents, however, said that they are simply not interested in using investment software. It became clear that a majority of participants preferred to talk to a person when making an investment decision.
More women than men indicated preferences to receive their information from personal sources such as friends or colleagues. Men were more likely to report preferences to get information on their own. Women and men also differed in their use of computer-based investment tools, particularly the Internet. More men than women reported the use of computers and the Internet.
Investment decision-making processes
Most participants said evaluating risk was important before making an investment decision. Other criteria, mentioned by relatively fewer respondents, included investment returns, market conditions, other investment options, and investment goals. It was interesting to note that most participants preferred to “wait it out” when their investments did not produce expected returns. Men were more likely than women to make investment changes when an investment did not produce an expected return. On the other hand, more women than men were willing to wait it out when an investment did not produce expected results. Similarly, women were more likely than men to consult with an advisor.
Involvement in investing
Over half of the respondents reported that their involvement in saving and investment had gradually increased over the years. For some, however, investment involvement increased as a result of a critical life incident such as marriage, divorce, or the birth of a child.
Women were more likely than men to have experienced a change in their involvement in investing due to a change in marital status, the arrival of a child, or the death of a family member. Men were more likely to increase their involvement due to retirement or sudden
financial gain. For women, divorce was an important factor in bringing about increased financial involvement; for men, on the other hand, divorce was the least likely event to change their investment involvement.
Sources of financial influence
About one-third of the respondents identified either both parents or their fathers as the most important influence on their understanding of money management. Most participants recalled their parents talking about managing money, financial concerns, and the importance of saving, and as children, most respondents felt that their families were financially secure. However, when specifically asked who taught them about investing, very few participants mentioned their
parents and teachers as strong influences. Instead, a large percentage of the respondents indicated that they enjoyed learning about investing and were particularly interested in getting this
information from a personal contact.
When parental influence was a factor, it differed by gender. Women often said that their mothers had the most important influence on their money management strategies. On the other hand, more men than women said were influenced by their fathers. Men also reported that teachers and other adults had an impact on their money management and investment decisions more often than women did.
Investment beliefs and learning preferences
A majority of respondents felt responsible for their own financial well-being and believed
Gender Differences in Investment Behavior
that they enjoyed learning about investing, a majority also indicated that they find investing a satisfying but time-consuming experience. However, a gender difference was visible here: Women were less likely than men to say that they find investing exciting or satisfying. They also found making investment decisions more stressful, difficult, and time-consuming than men did. Fewer women than men described themselves as being confident or knowledgeable about investing, and far more men reported that they regularly review and compare their investment performances with market benchmarks.
The single-most preferred means of learning about investments for both men and women was to consult with a financial advisor. Most respondents characterized financial advisors as
information providers and good listeners, but again, the gender differences were pronounced. While women were more likely to describe financial advisors as sources of information and careful listeners, men were more likely to describe financial advisors as exerting too much pressure and charging too much for their services.
Implications of the study
In general, this survey raises more questions than it produces answers. However, it is these questions that provide guidance in establishing a shared context for learning and a focus for exploring the underlying beliefs held by women about the management of money and investments. For instance:
Fewer women than men participated in this survey. Does this reflect women’s lack of access to financial information or lack of authority to share this information? Or is it due to a lack of confidence?
Among the white participants the majority of respondents was men, but among African-Americans the majority was women. Are women of color more likely to assume control of money matters in their family? Are they more confident than white women? Is this indicative of the predominance of women of color as the family head of household? The issue of racial difference could have curricular and instructional implications and would be important to explore in greater depth in the educational program.
More women are in charge of daily money management than men. Educationally, it would be important to explore why women see daily money management as their responsibility. Also, as discussed in a later finding, there is a need to understand why long-term money management (investments) is less of a focus or interest for women.
Women prefer less risk than men when it comes to money matters. Educationally, it would be important to explore what participants mean by risk. What does it mean to experience no risk, below average risk, or average risk when it comes to money matters and investments?
A majority of the women reviewed performance of their investments over the last twelve months. What does reviewing performance mean? This seems open to a wide range of interpretations. It would be important to explore this behavior, and participants’ definitions of this term, in greater depth.
The regularity and timing of conversations about money with children needs further exploration. Do most people only talk about money when it is a problem? Do they
regularly share the financial challenges of daily living with children? More importantly, how do we make money worries (crises, debts, etc) learning opportunities for both women and their children?
Many respondents prefer waiting when investments do not produce results. Why? This needs to be explored in greater depth in a workshop on investment education. Is this due to women’s more conservative approach to investing or due to a lack of understanding of how to respond? Curricular implications should include assessment strategies for low-performance investments and appropriate, timely, and responsible responses to those investments.
Women are less confident than men about their financial futures, about their knowledge of their retirement needs, and about their present financial situations. Women are more dependent than men on their spouses for financial security. About what areas/issues concerning money and investments they are least confident? This issue needs to be further explored.
Women find investing more stressful and less exciting than men. Why? What do women find so stressful about investing? It is likely to be related to their perception of risk? In view of the discussion above, some dominant themes that begin to emerge. These themes will provide the basis for the further analysis and development of recommendations about general financial education materials and an investment educational program for women. Such materials and programs would need to be grounded in the everyday realities of the lives of the female learner. In other words, they need to be relevant, realistic and of interest to the needs of women. An investment educational program for women also needs to provide investment strategies that are responsive to their concerns and appreciative of the high demands they experience in their everyday lives. The educational materials must prepare women to be both critical of the available financial investments instruments and aware of their surroundings’ roles (e.g., family, culture, and media) in shaping their confidence and influencing their decisions about money matters and investments.
The overall objective of the fourth phase of this study is to conduct further analysis to explore significant relationships among sets of variables such as socio-economic characteristics,
socialization, beliefs, financial behaviors, investment decision-making processes, etc. to develop dominant themes. These themes will provide basis for the development of financial and
investment educational programs, materials, and educational approaches to learning for investors in general but for women in particular.
Next steps
During the next study period (September 2006 - February 2007) the work will focus on the development of research-based educational guidelines, materials, and strategies. Specifically, the objectives for the next phase of the study (Milestone 4) can be divided into two areas: research and education.
Gender Differences in Investment Behavior
Research
Determine how personal characteristics, such as age, marital status, education,
employment status, occupation, job position, and environmental forces affect investment behavior and the investment decision-making process;
Provide empirical evidence to show that socialization and acculturalization play significant roles in one’s ability and comfort in making financial decisions, and show how socialization and acculturalization impact the level of knowledge, information, experience, and confidence necessary to make investment decisions;
Analyze whether, when, and to what extent women make long-term financial decisions independently;
Describe the roles that male partners play in investment decision-making;
Determine the factors (such as socialization, investment information/knowledge, experiences, and investor confidence) that may help explain why gender differences in financial and investment behaviors exist.
Education
Explain how research results can guide investment education to be effective in
influencing investment behavior among women and identify the learning environment that is conducive to enhance investment learning among female investors;
Identify teachable moments and appropriate strategies to use those moments to effectively teach key investment topics;
Use the concept of transformative pedagogy to propose a new approach to investment education;
Develop inquiry-based educational, instructional, and learning materials and strategies, particularly to meet the needs of women investors.
Y OBJECTIVES
Gender Differences
in Investment Behavior*
Gender Differences in Investment Behavior
1. Study objectives
Specific goals of this project are to: (1) identify significant personal and environmental factors that influence investment behavior and specify the investment decision-making process, particularly with respect to female investors; (2) explain how significant personal and
environmental factors interact through socialization and acculturalization and, in turn, result in a gender-related view—a general frame of reference—about investing; (3) use the results of this research to identify teachable moments and the related key investment educational topics; and (4) use the results of this study and the concept of transformative pedagogy to propose a new approach to investment education.
A discussion of preliminary results indicating differences between men’s and women’s financial and investment behaviors is the main focus of this report, which is part of the Milestone 3 progress reports.
Procedures and methods
Sample
The project sample consisted of households with listed telephone numbers in targeted
geographical areas with average household incomes of $100,000 per year. Eligible households consisted of primary residences with household incomes of $75,000 or more, as determined in the screening process. This strategy was based on the likelihood that there would be a greater percentage of investors found in households with higher annual incomes. In order to increase the probability of including minority households in the study, the sample also included areas with at least 30% African-American, Asian, or Hispanic populations.
A national randomized sample of 7,500 telephone numbers was purchased from Survey Sampling International (see www.surveysampling.com). The first sample purchased included 6,000 numbers. Since natural disasters in Louisiana, Mississippi, and Florida (Hurricanes Katrina and Rita) coincided with the onset of data collection (October 17, 2005), the households selected in those areas were either deleted from the sample (Louisiana, Mississippi, and surrounding coastal areas) or were contacted later during the survey (Florida).
Survey Instrument
Particular emphasis was given to the development of the survey instrument. The analysis of the literature in the first project progress report (submitted on August 31, 2005) had already
identified previously conducted research on investment behaviors. Particular consideration was given to the Self-Directed Learning Readiness Scale; the standard measures of the
Transtheoretical Model of Change; the Market Knowledge Questions of the NASD Investor Literacy Research; the Jumpstart 2004 Personal Finance Survey; and the Merrill Lynch Investment Managers Survey.
The greatest focus in this pre-data collection phase was the development of new survey items to specifically address research concerns. During the process, detailed attention was paid to the selection of survey items, word choices, and item ordering, which are major factors of a successful phone interview (Groves 2004, p. 227-235). The Iowa State University Center for Survey Statistics and Methodology (the Center) staff sought feedback from local investors and financial advisorsand conducted fifteen pre-tests before the final survey draft was completed on September 27, 2005. The survey instrument included a total of thirty-eight questions, which addressed the following five guiding themes of our analysis: (a) demographic and economic characteristics; (b) financial management behavior; (c) sources of investment information and the investment decision-making process; (d) investor socialization/parents’ influence on respondents’ money management and investing; and (e) predictors of investor intentions including respondents’ investment-learning preferences, investor beliefs, attitudes, perceived behavioral control, and opinions about investment advisors.
Telephone survey topics included items on the investors’ economic and socio-demographic characteristics, investment characteristics, information technology use, financial planning, investment behaviors, and attitudes. Once the final survey draft was developed, the questionnaire was programmed for computer-assisted-telephone-interviewing (CATI) using Blaise 4.6
software and tested for accuracy by the Center, which conducted the telephone survey using a targeted, randomly selected, national white pages phone directory sample. Once the survey procedure, instruments, and materials were finalized, the project was reviewed by the Iowa State University Institutional Review Board and approved for data collection on October 13, 2005.
Resistance to participation due to the survey topic became a significant concern to the
researchers during the survey pre-tests. In order to augment survey compliance, four significant adjustments were made to the original study design described in the grant proposal: (1) The national random-digit-dial sample design that was originally described in the grant proposal was replaced with a targeted white pages phone directory sample design. By using a white pages sample, researchers were able to contact potential participants with an advance letter prior to attempted telephone contacts and higher income households could be targeted to increase the probability of locating households with investors. (2) The survey length was reduced from the thirty-minute length originally proposed in the grant proposal. On average, the interview itself (not including screening items) took twenty-two minutes. (3) The participation incentive was increased from $10 to $20 to achieve a higher response rate. (4) Finally, as a practical matter, it was acknowledged that either the targeted goal of 1,000 completed interviews or the original timeline might need to be amended. This proved to be the case and the project timeline only allowed the completion of 911 interviews despite major efforts to achieve the goal.
Data collection
The Center was responsible for recruitment, training, and supervision of telephone interviewers. Center professional staff and the principal investigator collaborated in presenting training sessions for twenty-one telephone interviewers. Interviewers were trained in appropriate techniques for screening households, identifying selected respondents and for the interviewing process itself. Question-by-question specifications for each survey item were reviewed with staff as part of the training protocol. A manual with interviewing procedures and question-by-question
Gender Differences in Investment Behavior
specifications was developed and used both for training and for reference throughout the interviewing process. Project training was conducted on October 3, 2005and interviewers then participated in practice sessions until the beginning of data collection on October 17, 2005. Advance letters were sent to each sampled household prior to telephone contact in order to explain the purpose and nature of the project and to encourage participation. Data collection ended on February 24, 2006.
Completed interviews were edited by project staff to check for consistency and were re-coded as needed. A data file was constructed and frequencies and cross tabulations were analyzed to identify and correct entry or coding errors.
AND ECONOMIC CHARA
CTERS
Gender Differences
in Investment Behavior*
DEMOGRAPHICS AND
ECONOMIC CHARACTERS
Gender Differences in Investment Behavior
2. Demographic and economic characteristics
Demographic characteristics
In this section we present the demographic and economic characteristics of the respondents with emphasis on gender differences. These characteristics include age, marital status, education, employment status, occupation, job position, socialization, and educational experiences. About two-thirds of the respondents were men (65%), and about one-third were women (35%). On average, respondents were forty-eight years old. A majority were white (84%) and married (90%). About three-quarters of the respondents held a college degree. About half of the
respondents were living in three- or four-person households. Most respondents worked full-time, typically in highly professional positions. While the largest single income group earned over $200,000 annually, half of the sample reported an annual household income below $120,000. On average, respondents reported household assets of $1,139,477 and obligations of $232,767.
The following two sections provide detailed information on these findings and on gender differences. For example, Table 1 summarizes respondents’ demographic characteristics and highlights differences in men’s and women’s responses. Comparisons between men and women are also presented in Figure 1 through Figure 5.
Table 1: Demographic characteristics
Variable All Men Women
N % N % N % Gender 911 100.0 591 64.9 320 35.1 Age 909 100.0 591 100.0 318 100.0 20-29 years 20 2.2 11 1.9 9 2.8 30-39 years 175 19.3 103 17.4 72 22.6 40-49 years 324 35.6 198 33.5 126 39.6 50-59 years 277 30.5 196 33.2 81 25.5 60-69 years 82 9.0 60 10.2 22 6.9 70-89 years 31 3.4 23 3.9 8 2.5 Race 894 100.0 581 100.0 313 100.0 European-American 749 83.8 497 85.5 252 80.5 African-American 71 7.9 34 5.9 37 11.8 Asian-American 69 0.6 46 0.7 23 0.3 American Indian, Alaska Native 5 7.7 4 7.9 1 7.3 Hispanic 71 7.8 46 7.8 25 7.8 Marital status 911 100.0 591 100.0 320 100.0 Married 816 89.6 541 91.5 275 85.9 Living with partner 9 1.0 4 0.7 5 1.6 Divorced 40 4.4 18 3.0 22 6.9 Widowed 15 1.6 3 0.5 12 3.8 Single, never married 31 3.4 25 4.2 6 1.9 Family size 911 100.0 591 100.0 320 100.0 1 person 38 4.2 19 3.2 19 5.9 2 persons 235 25.8 162 27.4 73 22.8 3 persons 185 20.3 120 20.3 65 20.3 4 persons 273 30.0 170 28.8 103 32.2 5 persons 131 14.4 87 14.7 44 13.8 6 plus persons 49 5.4 33 5.5 16 4.9 Education 911 100.0 591 100.0 320 100.0
Less than high school diploma 3 0.3 2 0.3 1 0.3 High school/GED 54 5.9 36 6.1 18 5.6 Some college 160 17.6 94 15.9 66 20.6 Bachelor’s degree 366 40.2 235 39.8 131 40.9 Master’s degree 242 26.6 161 27.2 81 25.3 PhD, MD, DDS. 86 9.4 63 10.7 23 7.2
Gender Differences in Investment Behavior
Age
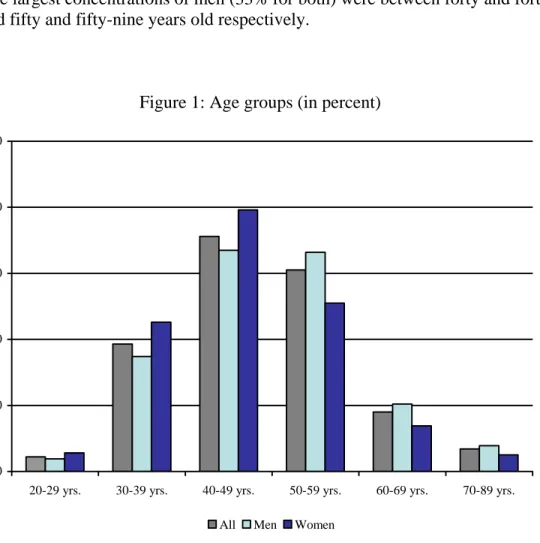
It is evident from the information presented in Table 1 and Figure 1 that a majority of the respondents (67%) were between forty and sixty years old. Almost two-thirds of the women (64%) were under the age of fifty, while just slightly over half of the men (52%) were under the age of fifty. The largest concentration of women (39%) was between forty and forty-nine years old, while the largest concentrations of men (33% for both) were between forty and forty-nine years old and fifty and fifty-nine years old respectively.
Figure 1: Age groups (in percent)
0 10 20 30 40 50
20-29 yrs. 30-39 yrs. 40-49 yrs. 50-59 yrs. 60-69 yrs. 70-89 yrs. All Men Women
Race
Participants were asked to identify their race by selecting one of the following options: White; Black/African-American; American Indian, Alaskan Native; Asian; or another race.
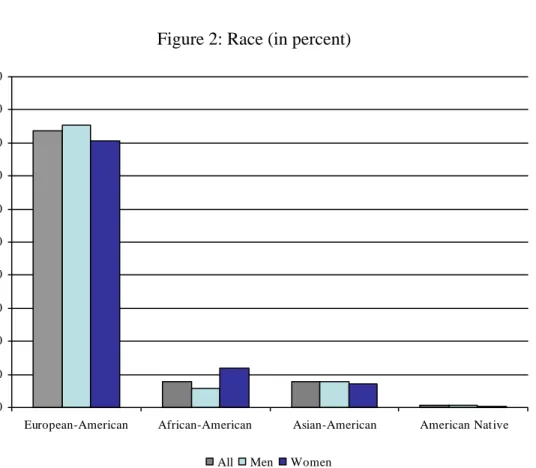
As can be seen in Figure 2, the majority of the respondents in this study were white (82.2%), with a slightly larger percentage of men (86%) than women (81%) being white. Figure 2 also shows that the percentage of Asian Americans (m: 8%; w: 7%) and Native Americans (m: 1%; w: 0.5%) were similar for both men and women. However, it is noteworthy that the number of African-American female respondents was twice as high as African-American male respondents (m: 6%; w: 12 %.).
Figure 2: Race (in percent)
0 10 20 30 40 50 60 70 80 90 100
European-American African-American Asian-American American Native All Men Women
Gender Differences in Investment Behavior
Marital status
To indicate their marital status, participants could choose among the following options: married; living as married; divorced; widowed; or single, never married.
Overall, the majority of the respondents were married (89.6%). More men (92%) were married than women (86%). A slightly higher percentage of the men were also single (4%) when compared with the women (2%).
A larger percentage of the female respondents reported being divorced (7%) or widowed (4%) compared with the males who reported being divorced (3%) or widowed (1%). Only 1% of the respondents reported living with a partner (presumably not married); of these, more were women (1.6%) than men (0.7%).
Figure 3: Marital status (in percent)
0 10 20 30 40 50 60 70 80 90 100
Married Living with a partner
Divorced Widowed Single, never married All Men Women
Family size
To capture information on the size of respondents’ households, each respondent was asked to provide the total number of people living in his or her household, including dependent children away at college.
Information presented in Table 1 and Figure 4 shows that about one-third (30.0%) of the
respondents lived in four-person households. The second largest group (25.8%) reported living in two-person households. A slightly lower percentage of the respondents lived in three-person households (20.3%). A smaller percentage (14.4%) lived in larger households of five, and a very small percentage of the respondents (5.4%) reported living in households with six or more members.
It is evident from the information presented in Figure 4 that the size of households varied by gender of the respondent. The percentage of men who lived in households of five persons or more was slightly larger than women (m: 20.2%, w: 18.7%). On the other hand, a slightly larger percentage of women lived in four-person households (w: 32.2%; m: 28.8%), and twice as many women reported living in one-person households (w: 5.9%, m: 3.2%).
Figure 4: Family size (in percent)
0 10 20 30 40 50
1 person 2 persons 3 persons 4 persons 5 persons 6 plus persons All Men Women
Gender Differences in Investment Behavior
Education
The survey instrument requested information about the highest level of schooling that participants of this study had completed. Possible answers included less than high school
diploma, high school diploma (includes GED), some college but no four-year degree, Bachelor’s degree, Master’s degree, and PhD, MD, DDS, etc.
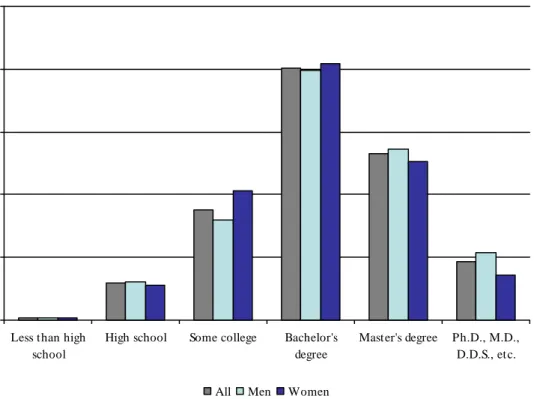
A majority (76.2%) of the participants in this sample had at least a Bachelor’s degree. A very small percentage of the total sample (6.2%) indicated that they had a high school degree
(including GED) or less. Gender differences in levels of education for most categories were not that pronounced. The exception was noted amongst those who reported some college or a professional degree. A larger percentage of women (20.6%) than men (15.9%) reported having had some college without having graduated with a four-year degree. On the other hand, a higher percentage of men (10.7%) than women (7.2%) reported that they had a professional degree. Well over a quarter of the respondents had Masters’ degrees; however, a larger percentage of men (27.2%) than women (25.3%) were found in this category. Slightly more than 9% of the respondents had post-Masters’ degrees, and once again a slightly larger percentage of men (10.7%) than women (7.2%) held these higher education degrees.
Figure 5: Education (in percent)
0 10 20 30 40 50
Less than high school
High school Some college Bachelor's degree
Master's degree Ph.D., M.D., D.D.S., etc. All Men Women
Economic characteristics
The survey instrument also included questions about respondents’ occupations, employment levels (full- or part-time), and their household incomes.
The following sections provide detailed information on these findings, and also highlight the gender differences. Specifically,
Table 2 provides detailed information about employment status and occupations, whereas Table 3 details information about respondents’ household incomes, total assets and total obligations. Figure 6 through Figure 10 illustrate the details regarding these variables for the total sample and for each gender.
Table 2: Respondents’ socio-economic characteristics
Variable All Men Women
N % N % N % Employment status 911 100.0 591 100.0 320 100.0
Employed full-time 686 75.3 494 83.6 192 60.0
Employed part-time 82 9.0 25 4.2 57 17.8
Retired 89 9.8 64 10.8 25 7.8
Not currently employed 54 5.9 8 1.4 46 14.4
Occupation 910 100.0 590 100.0 320 100.0
Professional 372 40.9 227 38.5 145 45.3
Business and Finance Management 155 17.0 111 18.8 44 13.8 Other Management 84 9.2 59 10.0 25 7.8 Technical 114 12.5 95 16.1 19 5.9 Sales 79 8.7 48 8.1 31 9.7 Administrative Support 38 4.2 10 1.7 28 8.8 Construction and Maintenance 27 3.0 23 3.9 4 1.3 Operative 5 0.5 4 0.7 1 0.3 Service Occupations 20 2.2 12 2.0 8 2.5 Homemaker 16 1.8 1 0.2 15 4.7
Gender Differences in Investment Behavior
Table 3: Respondents’ socio-economic characteristics - continued
Variable All Men Women
N % N % N % Annual household income 843 100.0 550 100.0 293 100.0 $75k-$80k 84 10.0 51 9.3 33 11.3 $80k-$90k 113 13.4 72 13.1 41 14.0 $90k-$100k 104 12.3 66 12.0 38 13.0 $100k-$110k 63 7.5 45 8.2 18 6.1 $110k-$120k 76 9.0 52 9.5 24 8.2 $120k-$130k 64 7.6 43 7.8 21 7.2 $130k-$140k 51 6.0 36 6.5 15 5.1 $140k-$150k 63 7.5 35 6.4 28 9.6 $150k-$160k 27 3.2 21 3.8 6 2.0 $160k-$170k 18 2.1 11 2.0 7 2.4 $170k-$180k 31 3.7 24 4.4 7 2.4 $180k-$190k 10 1.2 7 1.3 3 1.0 $190k-$200k 23 2.7 13 2.4 10 3.4 $200k and higher 116 13.8 74 13.5 42 14.3 Total Assets 819 100.0 540 100.0 279 100.0 $125k or less 15 1.9 9 1.7 6 2.2 $125k-$250k 66 8.1 38 7.0 28 10.0 $250k-$500k 225 27.5 140 25.9 85 30.5 $500k-$1m 282 34.4 185 34.3 97 34.7 $1m-$2m 154 18.8 108 20.0 46 16.5 $2m and higher 77 9.4 60 11.1 17 6.1 Total Obligations 868 100.0 566 100.0 302 100.0 $100k or less 254 29.3 173 30.6 81 26.8 $100k-$200k 254 29.3 159 28.1 96 31.8 $200k-$300k 168 19.4 119 21.0 49 16.2 $300k-$400k 74 8.5 41 7.2 33 11.0 $400k-$500k 51 5.9 35 6.2 16 5.3 $500k and higher 66 7.6 39 6.9 27 8.9 18
Employment status
Respondents were asked to report their employment status at the time of their participation in the study. To provide their responses they could select one of the following options: employed full time; employed part-time; or not employed/retired.
A majority of the respondents was employed full-time (75.3%). However, a much larger percentage of men than women were fully employed (m: 83.6%, w: 60%). On the other hand, a much larger percentage of women were employed part-time (w: 17.8%, m: 4.2%) or unemployed (w: 14.4%, m: 1.4%). And among the 10% retirees, more were men (10.8%) than women (7.8%).
Figure 6: Employment status (in percent)
0 10 20 30 40 50 60 70 80 90 100
Full time Part time Retired Not employed All Men Women
Occupation
Respondents were asked to provide information about their current occupations and, if retired or unemployed, their previous occupation. Information provided about their occupations was grouped in nine occupational categories that are recognized by the Department of Labor: professional, business and finance management, other management, technical, sales,
administrative support, construction and maintenance, service occupations and homemaker. Detailed information on respondents’ occupations is presented in Table 2.
Gender Differences in Investment Behavior
As can be seen in Table 2, slightly less than half (40.9%) of the respondents were in professional occupations. They were engineers, physicians, attorneys, teachers, and architects. Slightly more than a quarter (26.2%) indicated that they held managerial positions such as financial analysts, accountants, executives, educational administrators, and managers. A small percentage of the respondents (12.5%) indicated that they held technical positions such as programmers, technicians, therapists or inspectors.
As can be seen from the information presented in Figure 7 below, there were notable differences between the occupations of men and women in the study. The percentage of women employed in the professional occupational category (45.3%) was slightly higher than that of men (38.5%). On the other hand, more men (16.1%) than women (5.9%) were working in the technical fields. Information presented in Figure 7 (see Table 2) shows a few more occupational differences between genders. For example, more women than men worked in service occupations, administration, and sales. More men than women were employed in the fields of operation, construction, management, and business and finance.
Figure 7: Occupation (in percent)
0 10 20 30 40 50 Prof ession al Bus ines s & F inance Techn ical Othe r M anag eme nt Sales Admin istra tion Home mak er Con stru ctio n Serv ice Oper ativ e
All Men Women
Household income
In order for people to qualify to participate in this survey they had to have a household income of $75,000 or higher. Household income was the sum of income from all sources including income employment, social security, investments, and interest for all members of the household.
Respondents were able to provide income information by selecting one of fourteen income categories. Table 2 provides detailed information about these categories, which start with an income of $75,000 and build to more than $200,000 a year.
Figure 8 represents information about the percentage of respondents who selected one of these fourteen income categories.
As can be seen from Table 2, a majority of the respondents (73.3%) reported household incomes between $75,000 and $150,000. However, 14% of the respondents were in highest income category, more than $200,000 annually. Almost similar percentages of the respondents (13.4%) identified their household incomes as between $80,000 and $90,000.
Gender differences were notable on both ends of the income scale. On the one hand, a slightly larger percentage of women (38.3%) than men (34.4%) reported an annual household income of $100,000 or less, but on the other hand, slightly more women (17.7%) than men (15.9%) also reported their household income to be $200,000 or higher. Finally, a larger percentage of men (49.7%) than women (44.0%) reported their household income to be between $100,000 and $200,000.
Figure 8: Household income categories (in percent)
0 5 10 15 20 25 $75k -$80 k $80k -$90k $90k -$10 0K $10 0k-$ 110K $11 0k-$ 120K $12 0k-$13 0k $130 k-$1 40k $140 k-$1 50k $150 k-$160 k $160 k-$170 k $170 k-$1 80k $18 0k-$19 0k $19 0k-$20 0k more than $20 0k
Gender Differences in Investment Behavior
Household assets
The survey instrument also included a question about respondents’ households’ total gross assets including financial assets as well as homes and other real estate. For the purpose of this study the term financial assets refers to assets such as savings accounts, Certificates of Deposit, stocks, bonds, cash-value life insurance, mutual funds, etc. Respondents were asked to estimate the total overall value of all assets in dollars.
The information thus provided was grouped in six asset categories: $125,000 and less; $125,000 to $250,000; $250,000 to $500,000; $500,000 to $1 million; $1 million to $2 million; and $2 million and more.
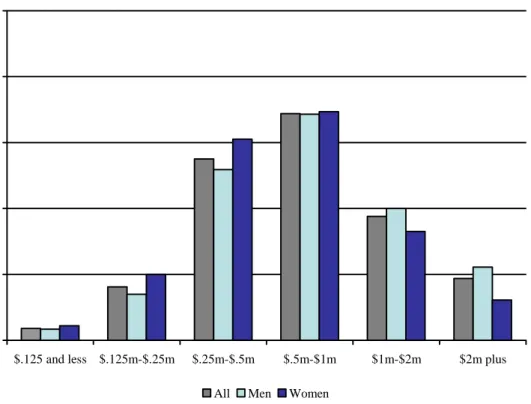
Figure 9 represents detailed information regarding the distribution of all respondents in these categories. Total value of assets varied from $5,000 to $20 million, representing a wide spread. About one-third of the respondents (34.4%) reported their household assets of $0.5 to $1 million. Gender differences in the total value of household assets are quite notable. The mean value of total assets is higher among men ($1,192,039) than women ($1,037,746). A significantly larger percentage of men (31.1%) than women (22.6%) reported total household assets over $1 million. An observation of the information presented in Table 2 and
Figure 9 shows that a larger percentage of women than men were found in the asset categories ranging from less than $125,000 to $1 million. On the other hand, a larger percentage of men than women reported assets that fell into the higher asset categories, ranging from $1 to $2 million and over $2 million.
Figure 9: Household assets (in percent)
0 10 20 30 40 50
$.125 and less $.125m-$.25m $.25m-$.5m $.5m-$1m $1m-$2m $2m plus All Men Women
Financial obligations
The final question in this section inquired about participants’ financial obligations. Respondents were asked to provide information about total household obligations including any mortgages, loans, and credit card debt. Information provided in response to this item was grouped in six categories ranging from less than $100,000 and to more than $500,000. Detailed information regarding households’ total debt is presented in Table 2 and Figure 10.
The financial obligations for participants of this study ranged from a low of no debt at all to a high of $2.5 million. However, over half of the respondents were found in the two debt categories: less than $100,000 (29.3%) and between $100,000 and $200,000 (29.3%). The mean value of financial obligations was slightly higher for women ($245,872) than men ($224,278). Similarly, the percentage of women was higher than men in three of the six total obligations categories: $100,000 to $200,000; $300,000 to $400,000; and $500,000 and higher.
Figure 10: Financial obligations (in percent)
0 10 20 30 40 50
100k and less 100-200k 200-300k 300-400k 400-500k 500k plus All Men Women
INVEST
OR FINANCIAL MANA
GEMENT BEHA
VIOR
Gender Differences
in Investment Behavior*
INVESTOR FINANCIAL
MANAGEMENT BEHAVIOR
3. Investor financial management behavior
In this section, we describe respondents’ regular savings and investment behavior. Overall, we found that the majority of respondents were involved in daily money management, saved regularly, and were well-equipped with regular banking products, such as checking accounts, retirement accounts, and life insurance. In particular, we found that the women of our sample took on more responsibility for daily money management whereas the men were the investment decision-makers. Men were more active investors than the women in our sample with respect to changing sums invested, reviewing performances, and altering asset allocations. Likewise, the men of our sample reported a higher financial risk tolerance. Women said more often that they consult with an advisor. The ownership of savings and investment vehicles mirrors these differences between men and women.
The following sections provide detailed information on investor financial management behavior as well as the specific results for men and women. Table 4 and Table 5 present the statistics of these measures for the full sample and break down the statistics for men and women,
respectively. Figure 11 through Figure 18 illustrate the findings.
Saving behavior
The questions in this section inquired about respondents’ management of their personal finances, their savings regularity, and their asset holdings.
Overall we found that 73.8% of respondents were responsible for daily money management, either on their own or in shared capacity with their spouses or partners. Likewise, 79.8% of respondents saved or invested money every month during the past six-month period and were well-equipped with banking products such as checking accounts, retirement accounts, and insurance products.
The following sections provide detailed information on these findings as well as the specific results for men and women. Table 4 presents the saving behavior of the full sample as well as details for men and women, respectively. Figure 11 to Figure 13 illustrate the findings.
Gender Differences in Investment Behavior
Table 4: Saving behavior
Variable All Men Women
N % N % N % Daily money management 911 100.0 544 100.0 280 100.0
Respondent 393 47.7 226 41.5 167 59.6
Spouse or partner 216 26.2 169 31.1 47 16.8
Both of them 215 26.1 149 27.4 66 23.6
Past 6-month saving regularity 911 100.0 591 100.0 320 100.0 none 66 7.2 42 7.1 24 7.5 1 or 2 months 51 5.6 30 5.1 21 6.6 3 to 5 months 67 7.4 41 6.9 26 8.1 6 months 727 79.8 478 80.9 249 77.8 Asset types (“yes” responses) Savings account 844 92.6 541 91.5 303 94.7 Certificates of deposit 309 34.1 181 30.7 128 40.4 Employer-provided retirement account 795 87.4 516 87.3 279 87.5
Personal IRA or Keogh account
649 71.4 436 74.0 213 66.6
Annuities 273 30.2 166 28.2 107 33.9
Cash-value life insurance 592 65.9 374 63.6 218 70.3
Other financial assets 67 7.4 43 7.3 24 7.5
Daily money management
Participants were asked to indicate who in their household handled daily money management tasks, such as paying bills. Response categories included: you, your spouse or partner, or both of you. Responses presented in Figure 11 show that less than half of the respondents (47.7%) reported that they themselves handled the daily money management tasks.
Gender differences are quite evident. A slightly larger percentage of women (59.6%) than men (41.5%) reported handling daily money management tasks. On the other hand, almost twice as many men (31.1%) than women (16.8%) reported that their spouse or partner handles daily money management tasks. An almost equal percentage of men (27.4%) and women (23.6%) reported sharing daily money management tasks.
Figure 11: Daily money management (in percent)
0 10 20 30 40 50 60 70 80 90 100
Self Spouse or partner Both All Men Women
Gender Differences in Investment Behavior
Savings behavior during the past six months
Participants were asked to think about the past six months and respond to the question, “How many of those months did you put money into some type of investment or savings account?” Possible responses included: none, one or two months, three to five months, and all six months. Figure 12 shows that a majority of the respondents (79.8%) reported that they had saved or invested money in every one of the six months prior to the interview. However, a slightly higher percentage of men (80.9%) than women (77.8%) reported saving or investing in every month during the last six-month period. A very small percentage (7.2%) reported not having saved in any of the months, 5.6% of respondents reported saving for one or two months, and 7.4% reported saving for three to five months.
Figure 12: Savings or investment deposits in past six months (in percent)
0 10 20 30 40 50 60 70 80 90 100
None 1 or 2 months 3 to 5 months All 6 months All Men Women
Ownership of various savings and retirement accounts
Respondents were also asked if they had any of the following accounts: savings accounts, certificates of deposit, employer-provided retirement accounts, IRA or Keogh accounts, annuities, or cash-value life insurance. Detailed information regarding savings and retirement accounts is presented in Table 4, and Figure 13 shows that a large majority of the respondents had savings accounts (92.6%) and employer-sponsored retirement accounts (87.4%). A much smaller percentage of respondents reported having CDs or annuities.
It is evident from the information presented below that a larger percentage of women than men were likely to report having savings accounts (m: 91.5%; w: 94.7%), certificates of deposit (m: 30.7%; w: 40.4%), annuities (m: 28.2%; w: 33.9%), and life insurance with cash value (m: 63.6%; w: 70.3%). On the other hand, a much larger percentage of men reported having an IRA/Keogh plan (m: 74.0%; w: 66.6%).
Figure 13: Ownership in banking products (“yes” responses in percent)
0 10 20 30 40 50 60 70 80 90 100 Savings account CDs Retirement account at work
IRA or Keogh Annuities Cash value life insurance All Men Women
Gender Differences in Investment Behavior
Investment behavior
An important objective of this study is to understand many aspects of respondents’ investment behavior. In this section we discuss many of those aspects, beginning with the question, “Who makes the investment decisions in your household?” The study also explores respondents’ involvement in making investment changes during the twelve months prior to the interviews and their plans to make investment changes during the next six months. This section also explores their attitudes toward risk, including their willingness to take risks when making investments. Finally, this section includes detailed information on the types of assets these respondents chose for their investments.
From information gathered in response to the question, “Who makes the investment decisions in your household?”, we learned that slightly over half of the respondents (57.0%) made investment decisions with their spouse or partner and only 27.9% reported making these decisions by
themselves. A large majority of the respondents (84.1%) reported that they are comfortable in taking average or above-average risk when making investments in stocks or stock mutual funds. A large majority of the respondents (93.4%) also reported reviewing performance of their
investments, and many reported making changes in their investment allocations during the previous twelve months. Similarly, a large majority of the respondents indicated that they planned to review their assets’ performance in the upcoming six months. In addition, about half of them indicated that they plan to consult with a financial advisor.
The following sections provide much more detail on various aspects of respondents’ investment behavior with specific attention to gender differences in these areas. Table 5 contains detailed statistics of these measures for the whole sample as well as for men and women respectively. Figure 14 to Figure 18 illustrate the key findings visually.
Table 5: Investment behavior characteristics
Variable All Men Women
N % N % N % Investment decision maker 911 100.0 591 100.0 320 100.0
Respondent 254 27.9 207 35.0 47 14.7
Spouse (partner) 16 1.8 1 0.2 15 4.7
Both make decisions together 519 57.0 308 52.1 211 65.9
Respondent makes decisions with others
49 5.4 31 5.2 18 5.6
Spouse (partner) makes decisions with others
3 0.3 2 0.3 1 0.3
Household investment decisions are made in another way
70 7.7 42 7.1 28 8.8
Past 12-month changes (“yes” responses)
Increased the amount you invest 490 55.5 334 58.2 156 50.5
Reviewed your investment performance
825 93.4 541 94.3 284 91.9
Changed your investment mix 484 54.8 347 60.5 137 44.3
Consulted with a financial advisor 455 51.5 286 49.8 169 54.7
Future 6-month changes (“yes” responses)
Increase the amount you invest 390 44.2 256 44.6 134 43.4
Review your investment performance
819 92.9 539 93.9 280 90.9
Change your investment mix 285 32.4 206 36.1 79 25.6
Consult with a financial advisor 438 49.6 280 48.8 158 51.1
Investment risk taking 907 100.0 587 100.0 320 100.0
No financial risk 62 6.8 31 5.3 31 9.7
Below average risk 33 3.6 17 2.9 16 5.0
Average risk 413 45.5 240 40.9 173 54.1
Above average risk 350 38.6 261 44.5 89 27.8
Substantial risk 49 5.4 38 6.5 11 3.4
Investments types (“yes” responses)
Government savings bonds, bond mutual funds
460 50.7 296 50.1 164 51.734.5
Corporate bonds or bond mutual funds
282 31.2 203 34.5 79 25.2
Stocks or stock mutual funds 721 79.6 481 81.5 240 75.9
Gender Differences in Investment Behavior
Household investment decision-maker
The term investment decision-maker refers to the person in household who made all or most of the investment decisions. This could have been the respondent, the respondents’ spouse, both the respondent and the spouse, the respondent and another adult, the spouse with another adult, or another person.
Overall, the majority of respondents told us that investment decisions were made together with their spouses (57.0%). However, the responses differed by gender. A much smaller percentage of women (14.7%) than men (35.0%) reported making investment decisions on their own. This is opposite to the earlier observation that women were more likely than men to take care of the daily money management tasks in the household (see Figure 11). A much larger percentage of women (65.9%) than men (52.1%)reported that theymade investment decisions with their partners.
Figure 14: Investment decision maker (in percent)
0 10 20 30 40 50 60 70 80 90 100 Self Spouse or partner alone
Self and spouse or partner
Self with others Spouse or partner with
others
In another way
All Men Women
Investment activities over the past twelve months
Following the framework of the Transtheoretical Model of Change (Prochaska, Redding, and Evers 2002) to assess respondents’ level of investment sophistication, we inquired about
investment action steps taken by participants over the twelve months prior to the interviews and planned for the next six months.
Participants were asked to think about the past twelve months and then asked if, during these twelve months, they: (a) increased the amount they invested, (b) reviewed their investment performance, (c) changed their investment mix, (d) consulted with a financial advisor, or (e) learned about a new investment concept or product. They could give yes or no responses respond to these questions.
Results presented in Table 5 show that during the twelve months prior to the survey, a very large majority of the survey participants (93.4%) had reviewed the performance of their investments, and made some changes in their investment mix. Over half of these participants also reported that during this period they had increased the amount they invested (55.5%), changed investment allocations (54.8%), or had also consulted with a financial advisor (51.5%).
As can be seen from Figure 15, a large majority of both women and men reported that they reviewed investment performance over the previous twelve-month period. However, gender differences are clear in other aspects of investment behavior. Men seem to be more active or engaged investors than women. For example, a larger percentage of men (58.2%) than women (50.5%) indicated that they changed amounts they invested during this period. Similarly, a slightly larger percentage of men (60.5%) than women (44.3%) indicated that they altered asset allocations over the previous twelve months. However, a larger percentage of women (54.7%) than men (49.8%) said that they had consulted with financial advisors over the previous twelve months.
Gender Differences in Investment Behavior
Figure 15: Investment activities of the previous twelve months (in percent)
0 10 20 30 40 50 60 70 80 90 100
Increased amount Reviewed performance Changed mix Consulted with adviosor All Men Women
Investment activities planned for the future six months
Continuing with the Transtheoretical Model of Change framework, we also asked participants to think about the next six months and tell us whether they planned to: (a) increase the amount they invest, (b) review their investment performance, (c) change their investment portfolio mix, (d) consult with a financial advisor, or (e) learn about a new investment concept or product. Regarding the upcoming six-month investment activity, about an equal number of respondents planned to review the performance and to consult with an advisor as did in the previous year. Fewer planned to reallocate funds (32.4%) or to increase the invested amount (44.2%). As can be seen from information presented in Table 5 and Figure 16, a large majority of both men and women indicated that they plan to review their investment performances during the next six months (m: 93.9%, w: 90.9%). A slightly larger percentage of women (51.5%) than men (49.8%) indicated that they plan to consult with a financial advisor. On the other hand, a larger percentage of men (44.6%) than women (43.4%) said that they will change the amount of sums they plan to invest during the next six months. Similarly, a larger percentage of men reported that they plan to change their asset allocation during the next six months (m: 36.1%; w: 25.6%). From these results one can conclude that overall, more men than women in our sample planned to be actively engaged in investment activities during the upcoming six months.
Figure 16: Investment activities of the future six months (“yes” responses in percent)
0 10 20 30 40 50 60 70 80 90 100
Plan to increase amount Plan to review performance
Plan to change mix Plan to consult with advisor All Men Women
Gender Differences in Investment Behavior
Willingness to take investment risk
A review of investment literature clearly shows that one of the significant determinants of investment behavior is risk tolerance level. In our effort to better understand the behavior of this sample we included a question to determine their risk tolerance level. The question presented to them was: “Generally speaking, are you willing to take: (a) substantial financial risks to earn substantial returns, (b) above-average risks for above average returns, (c) average risks for average returns, (d) below-average risks for below average returns, or (d) no financial risks at all.”
The results presented in Table 5 and Figure 17 show that most respondents (45.5%) were willing to take average risk for average returns and a smaller percentage (38.6%) indicated that they were willing to take above average risk for an above average return.
The willingness to take specific levels of risk in anticipation of specific levels of return varied significantly between men and women. A majority of the women (68.8%) indicated that they preferred to take no, below-average, or average risks with their investments. On the other hand, slightly over half of the men (51.0%), as opposed to less than one-third of the women (32.1%), indicated that they prefer to take above-average or substantial risk to make above-average and substantial returns on their investments.
Figure 17: Willingness to take investment risk (in percent)
0 10 20 30 40 50 60 70 80 90 100
None Below average Average Above average Substantial All Men Women
Ownership in investment accounts
Next, participants were asked to respond by saying “yes” or “no” if they held any of the following investments: bonds, stocks, or bond and stock mutual funds. Detailed information is included in Table 5 and visually presented in Figure 18. A majority of the respondents (79.6%) owned stocks or stock mutual funds. About half of all respondents indicated that they had investments in government savings bonds (50.7%) and money market mutual funds (48.5%). Slightly less than one-third (31.2%) of the respondents reported that they have invested in corporate bonds or bond mutual funds.
Slightly more women than men in our sample invested in the less volatile money market mutual funds (w: 48.6%; m: 48.5%) and government savings bonds/bond mutual funds (w: 51.7%; m: 50.1%), while the men more often invested in the more volatile stocks/stock mutual funds (m: 81.5%; w: 75.9%) or corporate bonds/bond mutual funds (m: 34.5%; w: 25.2%).
It is evident from Figure 18 that gender differences were not very pronounced. Even though a large majority of both men and women invested in stocks or stock mutual funds, the percentage of women was slightly smaller than men. On the other hand, a much smaller percentage of women (25.2%) than men (34.5%) reported investing in bonds or bond mutual finds.
Figure 18: Ownership in investment accounts (in percent)
0 10 20 30 40 50 60 70 80 90 100
Stocks or stock mutual funds
Corporate bonds or bond mutual funds
Money market mutual funds
Govt. savings bond or bond mutual funds All Men Women
INVEST
OR
ACTIONS
Gender Differences
in Investment Behavior*
INVESTOR ACTIONS
4. Investor actions
In this section we present information in the following three major aspects of investment behavior used by the participants of our study: (a) sources and tools used by participants to gather investment information, (b) steps in investment decision-making processes, and (c) involvement in investment decisions. Detailed information regarding these areas is presented in Table 6 to Table 12 and Figure 19 to Figure 27.
The following sections discuss in detail various aspects of these three broad areas of investment behavior.
Sources of investment information and the use of technology
The questions presented in this section explored the participants’ sources for financial
information and use of personal computers and the Internet to gather investment information or make investments.
The survey instrument included a list of sources of financial information and the respondents were asked to indicate on a five-point scale how often they used any of these sources: 1=never, 2=seldom, 3=sometimes, 4=often and 5=very often. Results show that a large percentage of the respondents indicated using financial advisors, print media, and friends and colleagues as a source of financial information. A much smaller percentage of these participants indicated using personal computers and investment software to make investment decisions. It appears that the majority of these inventors preferred working with a person to make investment decisions. The following sections provide detailed information regarding these items and also show the differences between men and women in this regard. Detailed results are included in Table 6 to Table 9 and visually illustrated in Figure 14 to Figure 18. The tables in this section include two different statistics: the mean and the standard deviation from the mean to summarize multi-point response scales varying from never = 1 to very often = 5.
Figure 19 and Figure 20 report sums of percentages of two responses, “often” and “very often,” to the various statements. On the other hand, Figure 21 and Figure 22 show the percentages of yes responses to lists of statements.
Sources of financial information
This question explored the various sources of financial information that respondents use. We asked how frequently they have obtained information about investing from a financial advisor; the Internet; TV programs; radio programs; classes or workshops; newspapers, magazines,