An Architecture to Support Model Driven Software Visualization
R. Ian Bull and Margaret-Anne Storey
University of Victoria
British Columbia, Canada
{
irbull,mstorey
}
@cs.uvic.ca
Jean-Marie Favre
ADELE Team, Laboratoire LSR-IMAG
University of Grenoble, France
[email protected]
Marin Litoiu
IBM
Markham Ontario
[email protected]
Abstract
Program comprehension tools are a valuable resource for navigating and understanding large software systems. Package explorers, fan-in / fan-out views, dependency graphs and coverage analysis are example contributions from the program comprehension community. While many of these research projects have lead to exciting enhance-ments in our field, many other projects have failed to be adopted because of poor interface design or lack of inte-gration with existing tools. Designing, building, integrating and evaluating interfaces is a challenge to software engi-neering researchers.
In this paper we borrow from the field of Model Driven Engineering (MDE) to assist with the creation of highly cus-tomizable interfaces for software visualization. MDE moves the level of abstraction from implementation to design, and will help improve the efficiency of building software visual-izations. By moving away from implementation details, and providing researchers with the ability to customize their vi-sualizations in an efficient manner, software engineers will have more resources to design and evaluate their ideas.
1
Introduction
Large scale software development does not occur with-out tool support. Integrated Development Environments (IDEs), such as Emacs, Eclipse, or Microsoft Visual Stu-dio, provide a wide range of tools for software developers. IDEs integrate components such as incremental compilers, editors, bug tracking, automated documentation and source code management tools.
Extracting and representing information from these tools is fundamental to software development. The research on
just in time comprehension [22] has revealed the impor-tance of extracting information from many of these compo-nents and presenting meaningful information to the devel-opers when they need it. As systems continue to get larger, and the amount of information mined from source reposito-ries grows, CASE tool designers have to continually create new and innovative ways to present this information to the software engineers.
Through work with our industry partners, it has become evident that tool developers need more support when de-signing interfaces for manipulating and displaying complex data, such as the facts extracted from source repositories. Tool development is now being supported, and partially automated, through model driven development. To sup-port these tool developers, we propose combining view cre-ation and model driven development to help improve the efficiency of view creation. Using these techniques, re-searchers and tool designers will be able to spend more time designing and evaluating their tools and less time building them.
2
Motivating Example
Software artifact interchange languages such as the Graph eXchange Language (GXL) [13] and the Rigi Stan-dard Format (RSF) [17] have allowed program compre-hension researchers to integrate their work with one an-other. Following the reverse engineering process outlined by Chikofsky and Cross [9], researchers have been able to split the process into three distinct parts: the identification of artifacts and their interrelationships (extraction) [16, 8], the representation of these artifacts in another form or at a higher level of abstraction (abstraction) [23, 11], and the rendering of the information in a meaningful way (presenta-tion) [5, 19]. The common exchange formats have allowed
researchers focus on a single area of the pipeline and lever-age other tools to validate their work.
While GXL has reduced the barriers that existed between tools, integrating several reverse engineering tools into ex-isting development environments still remains a challenge. Many visualization tools do not directly support GXL, and the tools that do, require hand coding in order to customize the view to meet the user’s requirements. For example, consider a simple artifact extractor which generates a GXL document conforming to a programming model. Let us as-sume that the model contains elements such asPackages, Classes, Methods, and Fields, with simple relationships such asContains, Calls, Accesses,andInherits. In order to display a class hierarchy view, a traversal algorithm must be designed to walk the model and populate a Tree Control. If the language supports multiple inheritance, then a graph view may be more appropriate. LSEdit [19] and SHriMP [5] can be used to render the graph, but their integration with environments such as Eclipse and Visual Studio is not seam-less. Graph Editing frameworks, such as GEF [2], provide a rich interaction with its development environment, how-ever, these frameworks require strong graphical program-ming skills. Now consider the case in which the user would also like to see a grouping of classes based on packages; this requires yet another traversal algorithm and possibly another set of graph drawing libraries. It is this discon-nect between fact extraction and information visualization, which is not addressed by standard exchange formats, that has motivated the need for a more structured method of cus-tomizing visual interfaces.
3
Related Work
Several researchers have investigated how to generate customized views for program comprehension. The Bloom system [20] and the work by Consenset al.[10] both use a graph query language to generate their views. While both of these tools provide a mechanism to rapidly prototype visu-alizations, it is not clear whether graph algebra is the most appropriate means of views specification. Mackinlay pro-posed the use of graphical sentences to generate presenta-tions of relational information [15] a technique that maps more closely to the domain of interaction design. While this work was highly advanced for its time, the views cre-ated were limited to static charts.
The Graphical Modeling Framework [4] project for Eclipse has facilities to allow modelers to define graphi-cal editors for their data. These graphigraphi-cal editors can be used as viewers, however, the views they support are lim-ited to simple graphs with containers. Other views such as charts, zoomable interfaces and 3D visualizations are not supported. Software visualizations often contain 100’s or even 1,000’s of visual entities. GMF does not support the
layout or rendering of information spaces of this magnitude. Finally, the GMF project currently lacks the ability to spec-ify “Query Result” visualizations, meaning that the diagram definition language is not as powerful as the relational alge-bra used by other tools.
Each of these technologies has contributed to the groundwork needed to design Model Driven Visualizations (MDV), however, none of these technologies alone provides a complete solution. In order to generate effective views of a software system, the views should be designed for software engineers and integrated into existing environments. The visualizations must be easy to use and easily customized. We propose leveraging technologies from MDE to meet these requirements.
4
Proposed Solution: MDV
The Object Modeling Group’s Model Driven Architec-ture and the more general MDE [14, 6] initiatives describe how models can be used both to design and to deliver a software system. A model is considered to be a schematic description of a system. The MDE process requires design-ers to specify models at different levels of abstraction for a given problem and design transformations to translate be-tween the models.
The motivation behind MDE is to move the focus of de-velopment from programming to solution modeling [21]. MDE proposes to combat complexity through the use of abstraction, problem decomposition and separation of con-cerns [21]. Building on these ideas, we believe we have found a balance between the goals of MDE and traditional software development by allowing interaction designers to model their software views, leaving the implementation of visualization components and complex graph algorithms to expert graphics programmers. This technology will al-low program compression researchers to spend more time studying their tools rather than building them.
4.1
A Reference Architecture for MDV
From our experience building program comprehension tools and our work with industry partners, several criteria for visualization tools have emerged. Firstly, the views should integrate with existing development environments, and whenever a native viewer exists, it should be lever-aged. For example, if a development environment sup-ports a charting engine or widget toolkit, these components should be used. Developers become comfortable with their programming environments, and they may be reluctant to spend their time evaluating new stand-alone tools. If a pro-gram comprehension tool can be integrated within a familiar development environment, the cost for developers to evalu-ate it is reduced. Secondly, the toolkitshould allow
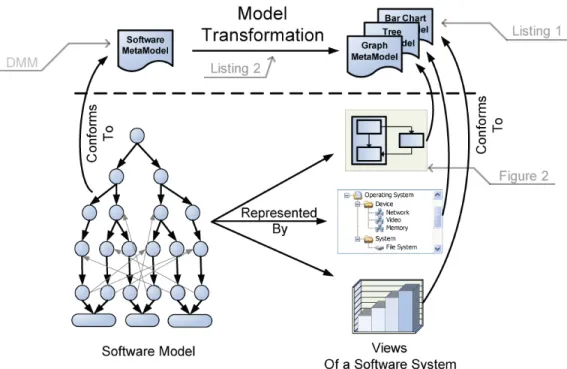
visual-Figure 1:The Reference Architecture for MDV in action
izations to be designed on existing, in-memory models,or at least provide integrated extractors that work on their exist-ing models such as databases. Users are more likely to use a tool that is already included within their environment than they are to export their source code just to produce a view. This is because exporting their data and creating a view in-volves more cognitive overhead and time. Finally, the views must be specified in a textual or visual language familiar to the interaction designer. Domain Specific Languages (DSLs), such as Macros for Excel, or Matlab for evaluating mathematical formulas, provide domain experts with facil-ities to specify their problem without getting caught up in the details of a general purpose programming language.
Using the criteria listed above, we have designed a ref-erence architecture to describe visualizations (Figure 1). The architecture makes use of techniques prescribed by the MDE community. In particular, the architecture recom-mends the use of meta-models for both the domain and the viewers. A DSL, targeted at interaction designers, is also needed to describe translations between the domain and viewer meta-models. Model Driven Visualization formal-izes theabstractionandpresentationcustomization phases of the reverse engineering pipeline.
4.2
Viewer Meta-Models
In order for a visualization tool to be leveraged within MDV, a meta-model (or schema) must be defined for the viewer. A viewer is a data-centric user interface control
such as a tree or table widget. A view, on the other hand, is an instantiation of a viewer. For example, a system hi-erarchy displayed as a tree is a view, while the tree control widget is the viewer.
Most information visualization toolkits are built as stand-alone applications to make them easier to use from an end user’s standpoint. This design decision makes them more difficult to integrate within other applications such as IDEs. While these tools may be built this way, inter-nally they follow the Model View Controller design pat-tern, meaning that they have separated the data from the view. We have documented meta-models for several stan-dard widget components including the Tree, List and Ta-ble controls. Also, we have successfully decoupled several viewers from the encompassing toolkit and extracted meta-models for these. Among our successes are the Business In-tegration and Reporting Tool (BIRT) charts [3], the Simple Hierarchical Multiple Perspective (SHriMP) tool [5], and the Prefuse Spring Graph Viewer [12]. To illustrate our ap-proach, we have included the Nested Viewer such as the ones provided by SHriMP, Zest [7] and LSEdit [19].
The meta-model for the Nested Viewer describes both entities and relationships (Listings 1)1. Each entity contains
a list of incoming and outgoing edges. The edges in this model have a single source and destination, as well as a label, type and weight. Other attributes, such as entity and edge colour could be added to this model.
1We have documented the meta-model for our viewers using the
c l a s s N e s t e d V i e w e r { v a l E n t i t y [∗] e n t i t i e s ; v a l Edge [∗] e d g e s ; } c l a s s E n t i t y { a t t r S t r i n g l a b e l ; r e f Edge [∗] # s o u r c e o u t g o i n g E d g e s ; r e f Edge [∗] # d e s t i n a t i o n i n c o m i n g E d g e s ; r e f E n t i t y [∗] c h i l d r e n ; } c l a s s Edge { r e f E n t i t y # o u t g o i n g E d g e s s o u r c e ; r e f E n t i t y # i n c o m i n g E d g e s d e s t i n a t i o n ; a t t r i n t w e i g h t ; a t t r S t r i n g l a b e l ; }
Listing 1:Nested Viewer Meta-Model
We have developed a prototype of our framework in Eclipse and imported several viewer meta-models. The framework was then used to generate several interactive vi-sualizations of a small Java application.
5
A Realization of the MDV Architecture
In order to validate our architecture, we have devel-oped a MDV framework for Eclipse [1]. We leveraged the Eclipse Modeling Framework (EMF), the Atlas Transfor-mation Language (ATL), and several visualization tools.
EMF is a modeling framework that supports meta-modeling, code generation and the loading and unloading of instance data. This means that a Java class hierarchy can be generated from the meta-models described in Sec-tion 4.2. EMF supports both containment and bi-direcSec-tional references, as well as a runtime environment capable of se-rializing and de-sese-rializing the instance data.
ATL supports a hybrid of declarative and imperative syn-tax to specify the transformation rules. Constraints can be stated using the Object Constraint Language (OCL) from the UML standard.
To render the views, a set of standard viewer are neces-sary. In our prototype we have leveraged the Eclipse JFace viewers such as Trees, Tables and Lists. BIRT was used to provide static charts, and Zest, an open source visualiza-tion toolkit, was included to support interactive graph visu-alizations. For each viewer an injector was written (usually
<100 LOC) to provide native EMF support. This means that any set of data conforming to a viewer model could be loaded directly into the viewer and rendered.
Using these three technologies, generating visualizations from EMF data consists of designing the appropriate trans-formation rules. r u l e P a c k a g e 2 E n t i t y { from p : j a v a ! J P a c k a g e t o e : n e s t e d v i e w e r ! E n t i t y ( l a b e l <− p . name , c h i l d r e n <− p . s u b P a c k a g e s } r u l e Method2Edges { from m : j a v a ! JMethod u s i n g { M e t h o d s A c c e s s e d : S e t(MOF! E C l a s s ) = m. c a l l s−>a s S e t ( ) −>f i l t e r (m. p a r e n t . p a c k a g e ) ; } t o e : d i s t i n c t n e s t e d v i e w e r ! Edge f o r e a c h ( a c c e s s e d i n M e t h o d s A c c e s s e d ) ( s o u r c e <−m. p a r e n t . p a c k a g e , d e s t i n a t i o n <− a c c e s s e d . p a c k a g e }
Listing 2:Method to Edges
6
Generating Software Visualizations
Modeling software visualizations involves designing transformation rules which map elements of source and target meta-models. Source meta-models are schemas to which extracted facts conform. One such example is the Dagstuhl Middle Model (DMM). Target meta-models are the meta-models to which the viewers conform.
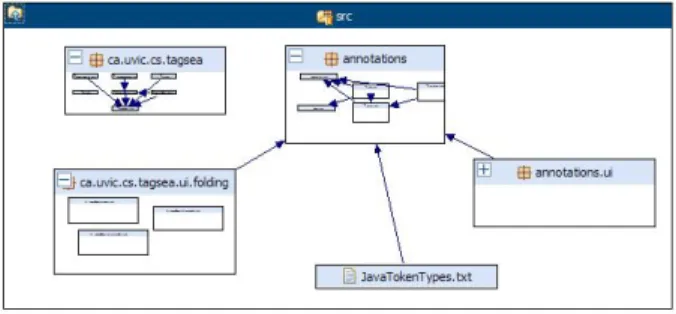
In order to demonstrate the feasibility of generating vi-sualizations with MDV, we have designed a visualization to help a developer address control dependencies between packages in a Java application. A control dependency tween packages is defined as a method call that exists be-tween methods contained within separate packages.
Zest was then used to visualize the package interaction as a nested graph. The elements of the view are the packages. Sub packages are nested within their parent and high-level relationships are computed to show dependencies.
Listing 2 shows the rules that generate the package de-pendency graph. The first rule matches all packages in the system and produced a visual entity for each. The label for the entity is mapped to the name of the package, and the children of the entity are all subpackages. The second rule matches each method. For each outgoing call from a method, an edge is generated. The source of the edge is linked to the package that contains the “calling” method. The destination of the edge corresponds to the package that contains the “called” method. Using an additional rule, the interaction designer can specify view properties such as the layout to apply. Figure 2 shows the result of this transfor-mation. The interactive nested viewer can now be navigated to explore the control dependencies between packages.
Figure 2:Visualizing Package Interaction with Zest
7
Conclusion and Future Work
Model Driven Visualization is intended to address the customization of information visualization tools, especially in the program comprehension domain. The MDV architec-ture describes how to leverage the work done in the Model Driven Engineering community and apply it to the problem of designing visualizations tools.
We are currently investigating two open problems in the area of MDV. Firstly, we are designing a more suitable transformation language. We are seeking support from the program comprehension community to help build a Do-main Specific Language for describing software visualiza-tion. We are currently reviewing the work done by Pacione
et al.[18], which should provide guidance for the DSL. Finally, we are investigating the feasibility of an incre-mental transformation engine. Many program comprehen-sion and reverse engineering tools only work in an “off-line” or “batch” mode. However, with incremental compil-ers and the continues feeds of information from sources like RSS, a real-time MDV transformation engine would help support just-in-time comprehension.
Acknowledgements
This research was supported by the IBM Centre for Advanced Studies (CAS), Toronto, and by National Science and Engineering Research Council (NSERC) of Canada.
References
[1] Eclipse. http://www.eclipse.org.
[2] Graphical Editor Framework. Website.
http://www.eclipse.org/gef.
[3] The Business Integration and Reporting Toolkit. http://www.eclipse.org/birt.
[4] The Graphical Modeling Framework.
http://www.eclipse.org/gmf.
[5] C. Best, M.-A. Storey, and J. Michaud. Designing a component-based framework for visualization in software engineering and knowledge engineering. InProceedings of
the 14th international conference on Software engineering and knowledge engineering, pages 323–326, 2002.
[6] J. Bezivin. In Search of a Basic Principle for Model Driven Engineering. Novatica Journal, Special Issue, V, No. 2:21– 24, 2004.
[7] R. I. Bull, C. Best, and M.-A. Storey. Advanced Widgets for Eclipse. InProceedings of 2nd workshop on Eclipse Tech-nology Exchange, pages 6–11, 2004.
[8] Y. Chen, M. Nishimoto, and C. Ramamoorthy. The C Infor-mation Abstraction System.IEEE Transactions on Software Engineering, pages 3:325–334, 1990.
[9] E. J. Chikofsky and J. H. C. II. Reverse Engineering and Design Recovery: A Taxonomy. 7:13–17, 1990.
[10] M. Consens, A. Mendelzon, and A. Ryman. Visualizing and Querying Software Structures. InProc of International Con-ference on Software Engineering, 1992.
[11] L. Feijs, R. Krikhaar, and R. V. Ommering. A Relational Ap-proach to Support Software Architecture Analysis. Software-Practice and Experience, 28(4):371–400, 1998.
[12] J. Heer, S. K. Card, and J. A. Landay. prefuse: A Toolkit for Interactive Information Visualization. InProceedings of the SIGCHI conference on Human factors in computing systems, pages 421 – 430, 2005.
[13] R. Holt, A. Sch˘urr, and A. Winter. GXL: Towards a Standard Exchange Format. InProc. of 2000 Working Conference on Reverse Engineering (WCRE-00), pages 162–171, Brisbane, Australia, November 2000.
[14] S. Kent. Model driven engineering. In 3rd international Conference on Integrated Formal Methods, pages 286–298, 2002.
[15] J. Mackinlay. Automating the Design of Graphical Presen-tations of Relational Information. ACM Transactions on Graphics, 5(2):110–141, April 1986.
[16] A. Malton and T. Dean. The CPPX home-page: A fact extractor for C++. Website, 2001. http://www.swag.uwaterloo.ca/˜cppx.
[17] H. A. M¨uller and K. Klashinsy. Rigi: A system for programming-in-the-large. InProc. of the10th Intl. Con-ference on Software Engineering (ICSE-10), pages 80–86, Singapore, April 1988.
[18] M. J. Pacione, M. Roper, and M. Wood. A Novel Visualiza-tion Model to Support Software Comprehension. InProc. of 11th Working Conference on Reverse Engineering (WCRE), pages 70–79, 2004.
[19] D. A. Penny. The Software Landscape: A Visual Formalism for Programming-In-The-Large. PhD thesis, University of Toronto, 1993.
[20] S. P. Reiss. An Overview of Bloom. InProceedings of the 2001 ACM SIGPLAN-SIGSOFT workshop on Program anal-ysis for software tools and engineering, pages 2–5, 2001. [21] S. Sendall and W. Kozaczynski. Model Transformation the
Heart and Soul of Model-Driven Software Development. Technical report, Ecole Polytechnique Federale De Lau-sanne, 2002.
[22] J. Singer, T. C. Lethbridge, N. Vinson, and N. Anquetil. An Examination of Software Engineering Work Practices. In Proceedings of the 1997 conference of the Centre for Advanced Studies on Collaborative research, pages 21–36, Toronto, ON, October 1997.
[23] S. R. Tilley, K. Wong, M.-A. D. Storey, and H. A. M¨uller. Programmable Reverse Engineering. Journal of Software Engineering and Knoweldge, 4(4):501–520, 1994.