85rd Annual Conference of the Agricultural Economics Society
Warwick University, 18 ‐ 20 April 2011
Climate change and adaptation of small-scale cattle and sheep farmers
B. Mandleni a, F.D.K. Anim b
a
UNISA, College of Agric. & Environmental. Sciences; Dept. of Agric., Animal Health & Human Ecology; Florida Campus, Private Bag X6 Florida 1710, South Africa, Tel: 011-471-2252; Fax: 011-471-2260;
E-mail: [email protected] b
UNISA, College of Agric. & Environmental. Sciences; Dept. of Agric., Animal Health & Human Ecology; Florida Campus, Private Bag X6 Florida 1710, South Africa, Tel: 011-471-3231; Fax: 011-471-2260;
E-mail: [email protected]
Abstract
The main objective of this study was to investigate the factors that affected the decision of small-scale farmers who kept cattle and sheep on whether to adapt or not to climate changes. The Binary Logistic Regression model was used to investigate farmers’ decision. The results implied that a large number of socio-economic variables affected the decision of farmers on adaptation to climate changes. The study concluded that the most significant factors affecting climate change and adaptation were non-farm income, type of weather perceived, livestock ownership, distance to weather stations, distance to input markets, adaptation choices and annual average temperature.
Key words: Climate change, small-scale cattle and sheep farming, Binary logistic
model
1. INTRODUCTION
Several studies have shown significant and alarming negative impacts of climate change and adaptation of livestock farmers in different parts of the world (Hassan and Nhemachena, 2008; Deressa et al., 2005; Kabubo-Mariara, 2007). Various research findings indicate that the damaging effects of global temperature is increasing and most damages are predicted to occur in sub-Saharan Africa where the region already faces average high temperatures and low precipitation, frequent droughts and scarcity of both ground and surface water (IPCC, 2001). In developing countries of Africa, including South Africa, global warming studies predict that by year 2100, increase in temperature is estimated to be in the region of 40C. Previous studies on climate change and adaptation of livestock farmers have shown that climate change affects livestock farming directly and indirectly (Kabubo-Mariara, 2008). Direct effects have been observed to include retardation of animal growth, low quality animal products including hides and skins, and animal production in general. Indirect effects have included general decline in quantity and quality of feedstuffs for example, pasture, forage, grain severity and distribution of different species of livestock, and other effects such as increase in livestock diseases and pests. In particular, extreme temperatures resulting
in drought have had devastating effects on livestock farming and the vulnerable rural poor have been left with marginal pasture and grazing lands (Kabubo-Mariara, 2005).
The vulnerability of livestock farming to climate change is an important concern in the world and in many African countries and in particular South Africa where many rural households depend on livestock as a store of wealth. Over the last decade when global warming was found to be detrimental to fauna and flora in the world, the relative contribution of the agricultural sector, including livestock numbers had declined. There are studies on the impact of climate change in agriculture in South Africa and other developing countries; however, there is limited research on its impact on livestock production particularly, cattle and sheep farmers. Moreover, few studies have been undertaken especially at the provincial and district levels (Hassan and Nhemachena, 2008).
2. OBJECTIVES
This study addresses the research gaps and examines cattle and sheep (livestock) farmers’ decision to adapt or not to climate changes in three district municipalities of the Eastern Cape Province of South Africa. The main objective of this study was to investigate the factors that affect the choices of adaptation by households who kept cattle and sheep in order to guide policy makers on adaptation decisions.
3. DATA COLLECTION
This study was based on a cross-sectional household survey data collected from 500 household heads during the 2005-2009 farming season in three district
municipalities in the Eastern Cape of South Africa namely: Amathole, Chris Hani and OR Tambo. The 500 households surveyed were from the three selected district municipalities based on representative agro-ecological zones and livestock farming systems in each municipality. The sample districts were selected purposefully to cover uniform or homogeneous characteristics of the three areas, namely: agro ecological zones, intensity of livestock (cattle and sheep) farming activities, average annual rainfall and household characteristics. The dependent variable in the empirical model was the two choices: the decision to adapt or not adapt, mentioned by households. The 500 household were proportionally selected according to the information on household sizes given by the Department of Agriculture and Rural Development office. The choice of exogenous variables used in the analysis was guided by available literature and economic theory.
4. EMPIRICAL MODEL
The Binary Logistic Regression model (BLR) model was used to determine cattle and sheep (livestock) farmers’ decision to adapt or not to climate change. The method has been used by researchers to analyse similar studies on livestock farmers’ choices in decision making on the impacts of climate change (Seo et. al., 2005). The main advantage of the BLR over other models of discrete and limited dependent variables is that it allows the analysis of decisions across two categories, allowing the determination of choice probabilities from different categories. In addition, its likelihood function, which is globally concave, makes it easy to compute. However, the main limitation is the independence of irrelevant alternative properties, which states that the ratio of the
probabilities of choosing any two alternatives is independent of the attributes of any other alternatives in the available choice selections (Deressa et. al., 2009).
In BLR, a single outcome variable Yi (i=1, ...,n) follows a Bernoulli probability function that takes on the value 1 with probability Pi and 0 with probability 1-Pi. Pi/1-Pi
and is referred to as the odds of an event occurring. Pi varies over the observations as an inverse logistic function of a vector Xi, which includes a constant and K explanatory variables (Greene, 2003). The Bernoulli probability function can be expressed as:
) / ( i i i Bernoulli Y P YΘ (1) or ⎥ ⎦ ⎤ ⎢ ⎣ ⎡ = − = ) 1 ( 1 ) 1 ( i i i i Y P Y P In = In (Odds)= (2) ik k k kX
∑
= + 1 0 β αEquation (2) above is referred to as the log odds and also the logit and by taking the antilog of both sides, the model can also be expressed in odds rather than log odds, i.e.
Odds = ⎥= ⎦ ⎤ ⎢ ⎣ ⎡ = − = ) 1 ( 1 ) 1 ( i i i i Y P Y P exp ⎥ (3) ⎦ ⎤ ⎢ ⎣ ⎡ +
∑
= k k ik kX 1 0 β α or =e
= (4) k k ik kX ∑ = + 1 β α k k k( )
k Xk k k k X e e ee
∏
∏
= = = 1 1 * * 0 0 β α β αThere are several alternatives to the BLM that might be just as plausible in a particular case. However, as stated above, the BLM is comparatively easy from a
computational point of view. There are many tools available which can be used to estimate logistic regression models but in practice the BLM tends to work fairly well. If either of the odds or the log odds is known it is easy to figure out the corresponding probability which can be written as:
⎥⎦ ⎤ ⎢⎣ ⎡ + = odds odds P 1 = ⎥⎦ ⎤ ⎢ ⎣ ⎡ + + + ) exp( 1 ) exp( ' 0 ' 0 X X β α β α (5)
The unknown α0 is a scalar constant term and β’ is a K x 1 vector with elements
corresponding to the explanatory variables. In this study, the parameters of the model were estimated by maximum likelihood. That is, the coefficients that make the observed results most likely were selected. The likelihood function formed by assuming independence over the observations can be written as:
i i i i Y n i x Y x P P L =
∏
= − 1− 1 (1 ) ) , (α β (6)To random sample (xi,yi), i=1,2,...,n, by taking logs and using equation (2), the log-likelihood simplified to:
{
∑
= + + − + = n i x In x y L In 1 0, )] ( ) (1 exp( ) ( [ α β α β α β } (7)The estimator of unknown parameter α and β can be gained from the following equations by means of maximum- likelihood estimation.
(
)
(
)
0 exp 1 exp )] , ( [ 1 0 0 = + + + − =∑
= n i i x x y L In β α β α δα β α δ (8)(
)
(
)
0 exp 1 exp )] , ( [ 1 0 0 = + + + − =∑
= n i i x x y L In β α β α δβ β α δ (9)Since equations (8) and (9) are non-linear, the maximum likelihood estimators must be obtained by an iterative process, such as the Newto-Raphson or Davidson-Flecher-Powell or Berndt-Hall-Hall-hausman algorithm (Greene, 2003).
A statistical model based on likelihood ratio (LR) was deemed appropriate. This ratio was defined as follows:
) (
2 LogLR LogLU
LR= −
Where LogLu was defined as the log-likelihood for the unrestricted model and LogLr was the log-likelihood for the model with k parametric restrictions imposed. The likelihood ratio statistic follows a chi-square (χ2 ) distribution with k degrees of freedom.
5. RESULTS AND DISCUSSION
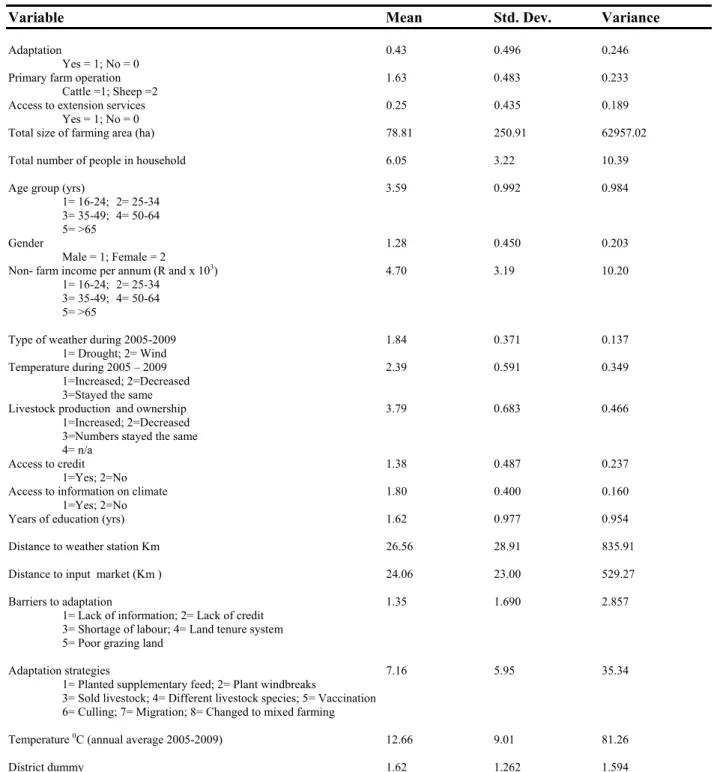
The descriptive statistics of the variables used in the model are presented in Table 1. The table gives the mean values, standard deviation and variance of the dichotomous endogenous variable (adaption and no adaption) and the exogenous variables used in the binary logistic model.
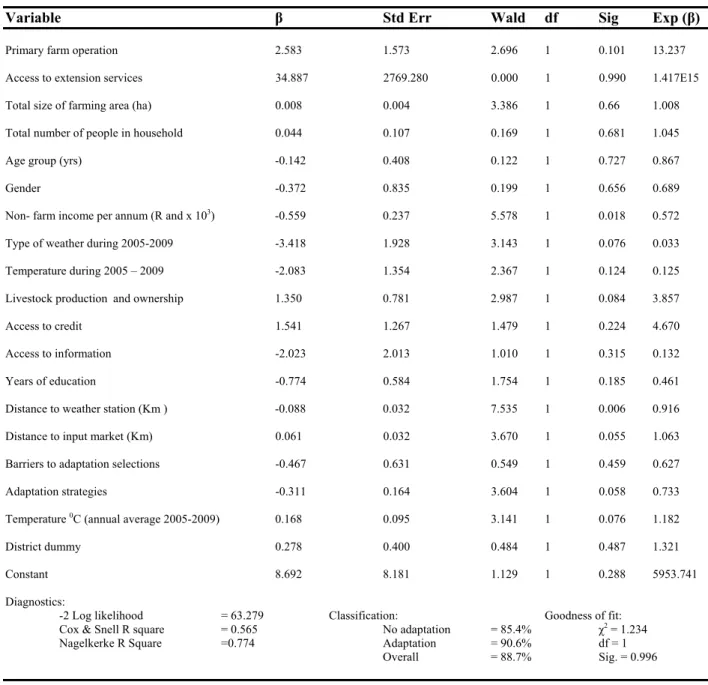
Table 2 presents the results of the estimated model. The estimated model indicated classification rates of 85.4% for no adaptation, 90.6% for adaptation and an overall classification rate of 88.7%. These results indicate the degree of accuracy of the model and therefore the reliability of the resulting estimated coefficients with their
accompanying statistics. From the data, the dependent variable would explain between 56.5% and 77.4% of the variation in results as indicated by the diagnostics. The non significance of the goodness of fit indicates that the model fits the data well (Spicer, 2004).
Primary farm operation had positive effect on adaptation. The t-value of more than unity also indicated 10% significance of the coefficient. The mean value of 1.63 indicated the presence of more sheep farmers than cattle in the study area. Judging from the coding of the variable “Primary farm operation’’ a plausible explanation of the results is that sheep farmers in the area are able to adapt to climate change more than cattle farmers.
Access to extension services was positively related to climate change. Among the exogenous variables it was the only variable that had the highest weighting coefficient. The result indicated that having access to extension services increased the likelihood of farmers adaptation to climate change. Total size of farm area also had positive effect on climate change but the likelihood of farmers’ adaptation to climate change varied by only 0.8%. Total number of people in household was also positively related to climate change and adaptation but the coefficient was not statistically significant even at the 10% level of significance. The results implied that large family sizes increased awareness and use of climate change and adaptation (Deressa et. al., 2005).
Table 1: Perceptions of cattle and sheep farmers on climate change and adaptation
Variable Mean Std. Dev. Variance
Adaptation 0.43 0.496 0.246
Yes = 1; No = 0
Primary farm operation 1.63 0.483 0.233 Cattle =1; Sheep =2
Access to extension services 0.25 0.435 0.189
Yes = 1; No = 0
Total size of farming area (ha) 78.81 250.91 62957.02
Total number of people in household 6.05 3.22 10.39
Age group (yrs) 3.59 0.992 0.984
1= 16-24; 2= 25-34 3= 35-49; 4= 50-64
5= >65
Gender 1.28 0.450 0.203
Male = 1; Female = 2
Non- farm income per annum (R and x 103) 4.70 3.19 10.20
1= 16-24; 2= 25-34 3= 35-49; 4= 50-64 5= >65
Type of weather during 2005-2009 1.84 0.371 0.137
1= Drought; 2= Wind
Temperature during 2005 – 2009 2.39 0.591 0.349
1=Increased; 2=Decreased 3=Stayed the same
Livestock production and ownership 3.79 0.683 0.466
1=Increased; 2=Decreased 3=Numbers stayed the same 4= n/a
Access to credit 1.38 0.487 0.237
1=Yes; 2=No
Access to information on climate 1.80 0.400 0.160
1=Yes; 2=No
Years of education (yrs) 1.62 0.977 0.954
Distance to weather station Km 26.56 28.91 835.91
Distance to input market (Km ) 24.06 23.00 529.27
Barriers to adaptation 1.35 1.690 2.857
1= Lack of information; 2= Lack of credit 3= Shortage of labour; 4= Land tenure system 5= Poor grazing land
Adaptation strategies 7.16 5.95 35.34
1= Planted supplementary feed; 2= Plant windbreaks
3= Sold livestock; 4= Different livestock species; 5= Vaccination 6= Culling; 7= Migration; 8= Changed to mixed farming
Temperature 0C (annual average 2005-2009) 12.66 9.01 81.26
District dummy 1.62 1.262 1.594
Sample size = 500; Valid N (list wise) = 133
Table 2: Parameter estimates of the binary logistic model of climate change and adaptation
Variable β Std Err Wald df Sig Exp (β)
Primary farm operation 2.583 1.573 2.696 1 0.101 13.237
Access to extension services 34.887 2769.280 0.000 1 0.990 1.417E15
Total size of farming area (ha) 0.008 0.004 3.386 1 0.66 1.008
Total number of people in household 0.044 0.107 0.169 1 0.681 1.045
Age group (yrs) -0.142 0.408 0.122 1 0.727 0.867
Gender -0.372 0.835 0.199 1 0.656 0.689
Non- farm income per annum (R and x 103) -0.559 0.237 5.578 1 0.018 0.572
Type of weather during 2005-2009 -3.418 1.928 3.143 1 0.076 0.033
Temperature during 2005 – 2009 -2.083 1.354 2.367 1 0.124 0.125
Livestock production and ownership 1.350 0.781 2.987 1 0.084 3.857
Access to credit 1.541 1.267 1.479 1 0.224 4.670
Access to information -2.023 2.013 1.010 1 0.315 0.132
Years of education -0.774 0.584 1.754 1 0.185 0.461
Distance to weather station (Km ) -0.088 0.032 7.535 1 0.006 0.916
Distance to input market (Km) 0.061 0.032 3.670 1 0.055 1.063
Barriers to adaptation selections -0.467 0.631 0.549 1 0.459 0.627
Adaptation strategies -0.311 0.164 3.604 1 0.058 0.733
Temperature 0C (annual average 2005-2009) 0.168 0.095 3.141 1 0.076 1.182
District dummy 0.278 0.400 0.484 1 0.487 1.321
Constant 8.692 8.181 1.129 1 0.288 5953.741
Diagnostics:
-2 Log likelihood = 63.279 Classification: Goodness of fit: Cox & Snell R square = 0.565 No adaptation = 85.4% χ2 = 1.234
Nagelkerke R Square =0.774 Adaptation = 90.6% df = 1
Overall = 88.7% Sig. = 0.996
Extensive literature indicates that households with large sizes tend to embark upon labour intensive technology (Featherstone and Goodwin, 1993). Alternatively, research has proved that a large family is mostly inclined to divert part of its labour force into non-farm activities to generate more income and reduce consumption demands (Mano and Nhemachena, 2006). However, according to Hassan and Nhemachena (2008) the opportunity cost might be too low in most smallholder farming systems as off-farm opportunities are difficult to find in most cases. Households that had large sizes were therefore expected to have enough labour to take up adaptation measures in response to climate change (Hassan and Nhemachena, 2008). The results indicated that household size increased the probability of adapting to climate change by 4.4% although the coefficient was not significant.
As mentioned by Galvin et. al., (2001) the influence of age on farmers’ decision has mixed results. Some researchers have found negative relationship between age and farmers’ decision to choice selection (Seo et. al., 2005; Sherlund et. al., 2002) whiles others have found positive relationships (Imai, 2003; Gbetibouo and Hassan, 2005). In this study it was hypothesised that old age would be associated with old farmers who wanted to maintain the status quo in farming and therefore resistant to change and expected age to be negatively related to climate change and adaptation measures. The results suggested that the likelihood of old farmers responding to climate change and adaptation decreased by 14.2%.
Gender is an important variable in decision taking among farmers. Bayard et. al., (2007) have indicated that female farmers have been found to be more likely to adopt
natural resource management and conservation practices than their male counterparts. However, studies have shown that the variable has no significant value in decision making process (Bekele and Drake, 2003). In this study, the results of the analysis indicated a negative relationship between the decision to adapt to climate change by farmers and the likelihood decreased by 37.2%.
The results showed that non-farm income significantly affected adaptation choice (P<5%) and was also a strong predictor of results. Farm income represents additional wealth for livestock farmers. Higher income farmers may however be less risk averse and have enough access to information. For this reason, non-farm income showed a negative effect on the likelihood of adaptation. The results indicated that when livestock farmers have the option for nonfarm incomes, they can afford not to adapt to climate changes.
Type of weather and the resulting temperature observed during 2005 and 2009 appeared to be negatively correlated to climate change and adaptation. This variable also had significant effect on adoption (P<10%) and a relatively high predictor among the independent variables. Households with windy and higher temperatures over the survey period were less likely to adapt to climate change through adoption of different practices. Furthermore, households who perceived great differences in seasonal temperatures during the survey period were less likely to adapt to climate changes. Empirical studies on the impact of climate change on agriculture indicated that climate attributes significantly affect net farm income and reduced adaptation (Mano and Nhemachena, 2006).
As expected, livestock production and ownership positively affected climate change and adaptation with high marginal impact. The variable also had significant effect on adaptation (P<10%). Livestock ownership plays a major role as a store of wealth in the households and also provides traction and manure required for grazing maintenance. Thus in this study the variable was hypothesised to have an increase in the likelihood of climate change and adaptation of farmers (Smith et. al., 2001).
Access to credit had a positive impact on climate change and adaptation. Having access to credit increased the likelihood of adaptation by farmers. The results implied that institutional support in terms of the provision of credit was an important factor in promoting adaptation options to reduce the negative effects of climate change (Deressa et. al., 2009). Several studies have shown that access to credit by farmers is an important determinant of the adoption of various technologies (Kandlinkar and Risbey, 2000). In this study it was hypothesised that the availability of credit to livestock farmers would be positively related to climate change and adaptation. Access to credit has been found to assist farmers to pay for information on agriculture. In this study such farmers were assumed to have been able to make comparative decisions on climate change and adaptation. Availability of financial resources would enable farmers to buy new breeds of livestock and other important inputs that they may require for the adaptation choices. The results suggested that access to information and years of education had negative impacts on famers’ likelihood to adapt to climate change. Education has been found to be negatively correlated with farmers’ decisions on climate change and adaptation measures (Gould et. al., 1989) whiles access to information has been found to have mixes impacts on the decision making of farmers (Dolisca et. al., 2006).
Distance to weather station had a negative but significant (P<1%) impact on adaptation. The results from this study indicated that long distances decreased the likelihood of adaptation by 8.8%. Distance to input markets was also positively and significantly (P< 10%) related to adaptation choices. Market access has been found to be an important factor in determining technology adoption choices among farmers (Luseno et. al., 2003). Access to input markets allow farmers to acquire inputs needed for adaptation choices such as planting of supplementary feed, windbreaks, purchase of new livestock species, vaccination etc. Zhang and Flick (2001) however, found that long distances to input markets decreased the likelihood of adaptation.
The presence of barriers to adaptation had negative impact on adaptation. Choice of adaptation strategies had negative and significant (P<10%) effect on adaptation indicating that households with proper choices of adaptation strategies needed not to adapt to climate changes. Farmer who perceived higher annual mean temperatures over the survey period were more likely to adapt to climate changes. The variable was also significant (P<10%) determinant of the likelihood of adaptation. The results showed that a rise in temperature one degree Celsius higher than the mean increased the likelihood of adaptation by 16.8%. The results indicated that with more warming, farmers would employ various adaptation measures to compensate for the loss of water associated with increased temperatures (Deressa et. al., 2009).
Differences in agro-ecological zones in the three district municipalities had positive influence on adaptation decisions of farmers. Empirical studies on climate change and adaptation of farmers in Africa have shown that climate attributes in
different agricultural zones significantly affected adaptation (Kurukulasuriya and Mendelsohn, 2006). Regional studies have also shown that the choice of livestock species is sensitive to climate changes (Seo et. al., 2005).
6. SUMMARY AND CONCLUSIONS
This study examined cattle and sheep (livestock) farmers’ decision to adapt to climate changes in three district municipalities of the Eastern Cape Province of South Africa. The main objective of this study was to investigate the factors that affected the choices of adaptation by small-scale livestock farmers who kept livestock. The study was based on a cross-sectional household survey data collected from 500 household heads during the 2005-2009 farming season. The Binary Logistic Regression model was used to determine cattle and sheep (livestock) farmers’ decision to adapt or not to climate changes.
The results indicated that primary farm operation had positive effect on adaptation decision. A plausible conclusion of the results was that the predominant sheep farmers in the area were able to adapt to climate change more than cattle farmers. Access to extension services was positively related to climate change and had the highest weighting coefficient. From the results it was concluded that having access to extension services increased the likelihood of adaptation to climate. Total size of farm area also had positive effect on climate change but the likelihood of farmers’ adaptation to climate change varied by only 0.8%. Total number of people in household was positively related to climate change and adaptation and the coefficient was not
statistically significant. The results implied that large family sizes increased awareness and use of climate change and adaptation.
From the results of the study it was concluded that household size increased the probability of farmers adapting to climate change. The results suggested that the likelihood of old farmers responding to climate change and adaptation decreased by 14.2%. The results of the analysis indicated a negative relationship between gender and the decision to adapt to climate change by farmers and the likelihood decreased by 37.2%. The conclusion was that when livestock farmers have the option for nonfarm incomes, they can afford not to adapt to climate changes.
Type of weather and nature of temperature observed during the study period appeared to be negatively correlated with adaptation. This variable also had significant effect on adoption (P<10%) and a relatively high predictor among the independent variables. It was concluded that households who experienced windy and higher temperatures over the survey period were less likely to adapt to climate change through adoption of different practices. Furthermore, households who perceived great differences in seasonal temperatures during the survey period were less likely to adapt to climate changes.
Livestock production and ownership positively affected adaptation with high marginal impact. The variable also had significant effect on adaptation (P<10%). Access to credit had a positive impact on climate change and adaptation. The results implied that institutional support in terms of the provision of credit was an important factor in promoting adaptation options to reduce the negative effects of climate change.
Access to information and years of education had negative impacts on famers’ likelihood to adapt to climate change.
Distance to weather station had a negative but significant (P<1%) impact on adaptation. The results indicated that long distances decreased the likelihood of adaptation. Distance to input markets was also positively and significantly (P< 10%) related to adaptation choices. The presence of barriers to adaptation had negative impact on adaptation. Choice of adaptation strategies had negative and significant (P<10%) effect on adaptation indicating that households with proper choices of adaptation strategies needed not to adapt to climate changes. Farmers who perceived higher annual mean temperatures over the survey period were more likely to adapt to climate changes. The variable was also a significant determinant of the likelihood of adaptation. The results showed that a rise in temperature one degree Celsius higher than the mean increased the likelihood of adaptation by 16.8%. The results indicated that with more warming, farmers would employ various adaptation measures to compensate for the loss of water associated with increased temperatures.
Differences in agro-ecological zones in the three district municipalities had positive influence on adaptation decisions of farmers. This study confirms other empirical studies on climate change and adaptation of farmers in Africa that have shown that climate attributed in different agricultural zones significantly affected adaptation. The study also confirms other regional studies that have also shown that the choice of livestock species is sensitive to climate changes.
REFERENCES
Bayard, B, Jolly C.M., and Shannon, D.A. 2007. The economics of adoption and
management of alley cropping in Haiti. Journal of Environmental Management, Vol 85:62-70.
Bekele, W and Drake, L. 2003. Soil and water conservation decision behavior of
subsistence farmers in Eastern Highlands of Ethiopia: a case study of the Hunde-lafto area. Ecological Economics, Vol 46:437-451.
Dolisca, F, Carter, R.D., Mcdaniel, J.M. Shannon, D.A. and Jolly, C.M. 2006. Factors affecting farmers participation in forestry management programs: A case study from Haiti. Forest Ecology and Management, Vol 236:324-331.
Deressa, T., Hassan, R., Poonyth, D. 2005. Measuring the economic impact of
climate change on South Africa’s sugarcane growing regions. Agrekon, 44(4): 524–542.
Deressa, T.T.; Hassan R.N.; Ringler C; Alemu, T and Yesuf, M. 2009. Determinants of farmers’ choice of adaptation methods to climate change in the Nile Basin of Ethiopia. Global Environmental Change, Vol 19:248-255.
invest in long-term conservation improvements. Land Economics, Vol 69:67–81.
Greene, W.H. 2003. Econometric analysis. Fifth edition. Prentice Hall, New Jersey.
Gould, B.W, Saupe, W.E., and Klemme, R.M. 1989. Conservation tillage: the role of farm and operator characteristics and the perception of soil erosion. Land Economics, Vol 65:167-182.
Galvin, K.A., Boone, R.B., Smith, N.M., Lynn, S.J. 2001. Impacts of climate variability on East African pastoralists: Linking social science and remote sensing. Climate Research, 19(1), 161–172.
Gbetibouo, G., Hassan, R. 2005. Economic impact of climate change on major South African field crops: A Ricardian approach. Global and Planetary Change, 47: 143–152. Hassan, R and Nhemachena, C. 2008. Determinants of African farmers’ strategies for
adaptation to climate change: Multinomial choice analysis. African Journal of Agricultural and Resource Economics, Vol 2 No. 1 March 2008.
Imai, K., 2003. Is livestock important for risk behaviour and activity choice in rural households? Evidence from Kenya. Journal of African Economies, 12: 271–295.
Intergovernmental Panel on Climate Change (IPCC), 2001. Climate Change: The scientific basis. New York: Cambridge University Press.
Kenya: An economic analysis. Natural Resource Forum, Vol 32; 131-141.
Kabubo-Mariara, J., 2005. Herders response to acute land pressure under changing property rights: Some insights from Kenya. Environment and Development Economics, 10(1): 67–85.
Kabubo-Mariara, J., 2007. Poverty and rural livelihoods in Kenya: Evidence from a semi-arid region. In: Tisdell, C. (Ed.) Poverty, Poverty Alleviation and Social Disadvantage: Analysis, Case Studies and Policies. Serials Publications, Vol III, Part VII, Chapter 56.
Kandlinkar, M and Risbey, J., 2000. Agricultural impacts of climate change: If
adaptation is the answer, what is the question? Climatic Change, Vol 45:529–39.
Kurukulasuriya, P and Mendelsohn, R., 2006. Crop selection: adaptation to climate change in Africa. CEEPA Discussion Paper No. 26. Centre for Environmental Economics and Policy in Africa, University of Pretoria, Pretoria.
Luseno, W.K., Mcpeak, J.G., Barrett, C.B., Little, D., Gebru, G., 2003. Assessing the value of climate forecast information for pastoralists: Evidence from Southern Ethiopia and Northern Kenya. World Development, 31(9): 1477–1494.
change on agriculture in Zimbabwe: A Ricardian approach. CEEPA Discussion Paper No. 11.
Sherlund, S.M., Barrett, C.B., Adesina, A.A., 2002. Smallholder technical efficiency controlling for environmental production conditions. Journal of Development Economics, 69(1): 85–101.
Smith, K., Barrett, C.B., Box, P.W., 2001. Not necessarily in the same boat:
Heterogeneous risk assessment among East African pastoralists. Journal of Development Studies, 37(5): 1–30.
Seo, S.N., Mendelsohn, R., Munasinghe, M., 2005. Climate change and agriculture in Sri Lanka. Environment and Development Economics, 10: 581–596.
Spicer, J., 2004. Making sense of multivariate data analysis. Sage Publications, California, pp123-151.
Zhang, D and Flick, W., 2001. Sticks, carrots, and reforestation investment. Land Economics 77 (3), 443–56.