The Value of Spatial Information
The impact of modern spatial information technologies on the Australian economy
Prepared for the CRC for Spatial Information & ANZLIC – the Spatial Information Council
© Spatial Information Systems Limited
This work is copyright. The Copyright Act 1968 permits fair dealing for study, research, news reporting, criticism or review. Selected passages, tables or diagrams may be reproduced for such purposes provided acknowledgment of the source is included. Permission for any more extensive reproduction must be obtained from Spatial Information Systems Limited through the Cooperative Research Centre for Spatial Information on (03) 8344 9200 or ACIL Tasman on (03) 9600 3144.
Reliance and Disclaimer
The professional analysis and advice in this report has been prepared by ACIL Tasman for the exclusive use of the party or parties to whom it is addressed (the addressee) and for the purposes specified in it. This report is supplied in good faith and reflects the knowledge, expertise and experience of the consultants involved. The report must not be published, quoted or disseminated to any other party without prior written consent from the Cooperative Research Centre for Spatial Information or ACIL Tasman. ACIL Tasman accepts no responsibility whatsoever for any loss occasioned by any person acting or refraining from action as a result of reliance on the report, other than the addressee.
In conducting the analysis in this report ACIL Tasman has endeavoured to use what it considers is the best information available at the date of publication, including information supplied by the addressee. Unless stated otherwise, ACIL Tasman does not warrant the accuracy of any forecast or prediction in the report. Although ACIL Tasman exercises reasonable care when making forecasts or predictions, factors in the process, such as future market behaviour, are inherently uncertain and cannot be forecast or predicted reliably.
ACIL Tasman shall not be liable in respect of any claim arising out of the failure of a client investment to perform to the advantage of the client or to the advantage of the client to the degree suggested or assumed in any advice or forecast given by ACIL Tasman.
ACIL Tasman Pty Ltd ABN 68 102 652 148
Internet www.aciltasman.com.au Melbourne (Head Office) Level 6, 224-236 Queen Street Melbourne VIC 3000 Telephone (+61 3) 9600 3144 Facsimile (+61 3) 9600 3155
Email [email protected]
Darwin
Suite G1, Paspalis Centrepoint 48-50 Smith Street Darwin NT 0800 GPO Box 908 Darwin NT 0801 Telephone (+61 8) 8943 0643 Facsimile (+61 8) 8941 0848 Email [email protected] Brisbane
Level 15, 127 Creek Street Brisbane QLD 4000 GPO Box 32 Brisbane QLD 4001 Telephone (+61 7) 3009 8700 Facsimile (+61 7) 3009 8799 Email [email protected] Perth
Centa Building C2, 118 Railway Street West Perth WA 6005
Telephone (+61 8) 9449 9600 Facsimile (+61 8) 9322 3955 Email [email protected]
Canberra
Level 1, 33 Ainslie Place Canberra City ACT 2600 GPO Box 1322 Canberra ACT 2601 Telephone (+61 2) 6103 8200 Facsimile (+61 2) 6103 8233 Email [email protected] Sydney PO Box 1554 Double Bay NSW 1360 Telephone (+61 2) 9958 6644 Facsimile (+61 2) 8080 8142 Email [email protected]
For information on this report
Please contact: Alan Smart
Telephone (02) 6103 8201
Mobile 0404 822 312
iii
Contents
Executive summary x
1 Introduction 1
1.1 Terms of reference for this report 1
1.2 What is spatial information and what does this report cover? 1
1.2.1 Relative and absolute spatial information 2
1.3 Users of ‘modern’ spatial information 3
2 The spatial information industry 4
2.1.1 The Australian spatial information industry 4
3 The industry’s role in the economy 7
3.1.1 The “Where?” question 7
3.1.2 Footprint versus impact 7
3.1.3 Spatial information and theories of economic growth 11
4 Assessing impacts 13
4.1 Theoretical underpinning 13
4.2 Methods for assessing economic value 14
4.2.1 Willingness to pay 14
4.2.2 Estimating value-added 14
4.2.3 Valuing options 15
4.3 Literature review of previous impact studies 15
5 Outline of the methodology 18
5.1 Approach 18
5.2 Assessing the direct impacts 19
5.3 Lessons learnt from previous technology waves 21
5.4 Assessment approach 23
5.4.1 Steps in the assessment 24
5.4.2 Generic impacts of spatial information technology 25
5.4.3 Impact of organisation scale 25
6 Direct impacts on business sectors 28
6.1 Introduction 28
6.2 Agriculture, fisheries and forestry 28
6.2.1 Case study – precision agriculture 30
6.2.2 Case studies – forestry 34
6.2.3 Case study – fisheries 37
iv
6.3 Mining and petroleum 42
6.3.1 Exploration 42
6.3.2 Development and production 46
6.3.3 Case study – Millmapper 47
6.3.4 Case study – robotic mining 48
6.3.5 Case study – QMASTOR Pit to Port 48
6.3.6 Case study – AuScope 50
6.3.7 Direct economic impacts 51
6.4 Property and business services 53
6.4.1 Land development 54
6.4.2 Case study – Western Australia land development 54
6.4.3 Engineering surveys 55
6.4.4 Case study – 3-D survey of Town Hall Station 56
6.4.5 Route and site selection 56
6.4.6 Case study – Pacific Highway upgrade programme 57
6.4.7 Design 59
6.4.8 Direct economic impacts 60
6.5 Construction 61
6.5.1 Construction machine guidance 64
6.5.2 Case study – The EastLink project 65
6.5.3 Case study – Barista 66
6.5.4 Case study – Forbes Shire Council 67
6.5.5 Maintenance work 68
6.5.6 Direct economic impacts 68
6.6 Transport and storage 69
6.6.1 Delivery routing, itinerary planning and vehicle tracking 70
6.6.2 Case study – Austroads 70
6.6.3 Rail use of GPS 71
6.6.4 Road traffic management and congestion management 72
6.6.5 Road and rail transport planning 72
6.6.6 Air traffic management 72
6.6.7 Case study – Airservices Australia 73
6.6.8 Impact of intelligent transport systems 74
6.6.9 Direct economic impacts 76
6.7 Utilities (electricity, water and gas) 76
6.7.1 Water supply authorities 77
6.7.2 Case study – Melbourne Water 78
6.7.3 Case study – Electricity distribution 80
6.7.4 Case study – Hazwatch and INDJI 81
v
6.8 Communications 85
6.8.1 Network planning 85
6.8.2 Asset management 85
6.8.3 Address management and route planning in postal 86
6.8.4 Direct economic impacts 86
6.9 Retail and trade 87
6.9.1 Where to trade 87
6.9.2 What to stock and where to market 87
6.9.3 Emerging applications 88
6.9.4 Impacts 88
6.10 Tourism 89
6.10.1 Holiday planning 89
6.10.2 Tourism management and provision of facilities 89
6.10.3 Facilities planning 89 6.10.4 Impacts 90 6.11 Manufacturing 90 6.11.1 Impacts 91 7 Impact on government 92 7.1 Government in general 92 7.1.1 Australian Government 92
7.1.2 Case study – Australian Government Information
Management Office (AGIMO) 95
7.1.3 Impacts – Australian government 96
7.2 State and territory government users of spatial information 96
7.2.1 State government strategies 98
7.2.2 Case study – Western Australian Land Information System 99
7.2.3 Case study – QSIIS 100
7.2.4 Case study – vegetation monitoring in Queensland 101
7.2.5 Case study – SIX 102
7.2.6 Impacts – State Governments 103
7.3 Local government users 103
7.3.1 Case study – local government in Queensland 104
7.3.2 Direct impacts – local government 105
7.4 Natural resources management, environment and climate change 106
7.4.1 Water resource management and markets 106
7.4.2 Case study – National Land and Water Resources Audit 107
7.4.3 Climate change 108
7.4.4 Case study – National Carbon Accounting System 109
7.4.5 Impacts 110
vi
7.5.1 Case study – controlling foot and mouth disease 112
7.5.2 Case study – Australian Plague Locust Commission 114
7.5.3 Future developments – BioSIRT 115
7.5.4 Impact 115
7.6 Defence and national security 116
7.6.1 Counterterrorism 117
7.6.2 Emergency management 117
7.6.3 Impact 119
7.7 Maritime and air safety 120
7.7.1 Case study – Australian Maritime Safety Authority 120
7.7.2 Case study – Australian Hydrographic Service 123
7.7.3 Innovation in bathymetry 124
7.7.4 Impact 125
7.8 Health and ageing 125
7.8.1 Case study – asthma 126
7.8.2 Health incident monitoring 127
7.8.3 Impacts 127
7.9 Direct impacts for Government 127
8 Indicative national economic impact in 2007 130
8.1 Overview of the Tasman Global model 130
8.2 Comparative Statics versus Dynamics 130
8.4 Factors of production 132
8.5 The labour market 132
8.6 National income, savings and consumption 132
8.8 Nature of the direct impacts 133
8.9 Results 134
8.9.1 Quantifiable ‘lower bound’ results 135
8.10 Estimated ‘realistic’ results 136
8.11 Impacts on industry output 136
8.11.1 Biosecurity and environmental benefits and social benefits 138
9 Impact of inefficient access to data 140
9.1 Overview 140
9.2 Fundamental data 141
9.2.1 National maps 142
9.2.2 National elevation data framework 142
9.2.3 Implications 143
9.3 Inadequacies in spatial data infrastructure 144
9.3.1 Virtual Australia 146
9.3.2 Positioning infrastructure 147
vii
9.4 Access to data 148
Simple and effective access 148
Fitness for purpose 150
9.4.1 Need for a national licensing framework 151
9.4.2 Implications 153
9.5 Pricing for access 154
9.5.1 Productivity Commission Report 154
9.5.2 Current policies 155
9.5.3 Implications 155
9.6 Overall cost of inefficient access to data 156
10 Future prospects 158
10.1 Medium term outlook 158
10.1.1 Future contribution of spatial information 158
10.2 Longer term 160
10.2.1 Falling costs of spatial data and systems 160
10.2.2 More powerful applications 161
10.2.3 The consumer mainstream 161
10.3 An evolving industry 163
10.3.1 The next phase 164
10.3.2 Knowledge based industries 166
10.3.3 International competitiveness 167
11 Implications for future research and development priorities 168
11.1 Generic issues 168
11.2 Increasing as adoption of established technologies 169
11.3 New applications and mainstream enterprise systems 170
11.4 Mainstream consumer markets 170
11.5 Concluding comments 171
A Terms of Reference CRC-SI A-1
B Literature review B-1
C Real options C-1
D List of organisations and individuals consulted D-1
E References E-1
viii
Boxes, figures and tables
Box 1 ABS Classification (ANZSIC) for ‘core’ spatial information industry
activities 5
Box 2 Footprint of the spatial information industry 8
Box 3 Direct and indirect impacts 10
Box 4 QMASTOR stockpile management system 49
Box 5 Statistical classification for construction 63
Box 6 Indji 83
Box 7 Australian Emergency Management Committee 119
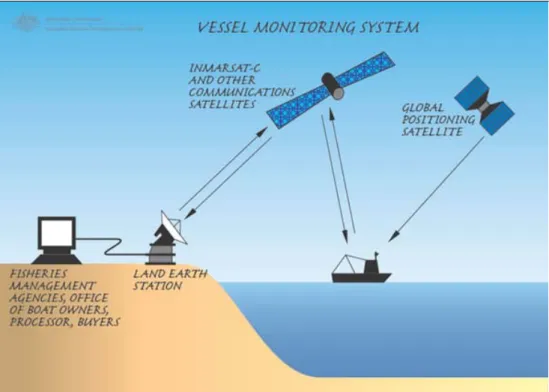
Box 8 Vessel tracking 122
Box 9 Electronic Navigation Charts in Australian Waters 124
Box 10 Airborne LIDAR Hydrography 125
Box 11 Guiding principles for access to spatial data – ANZLIC 2001 148
Box 12 Phases of adoption in enterprises 163
Box 13 Four phases of spatial information development 165
Figure 1 Industry value-add and intensity of use of spatial information 11
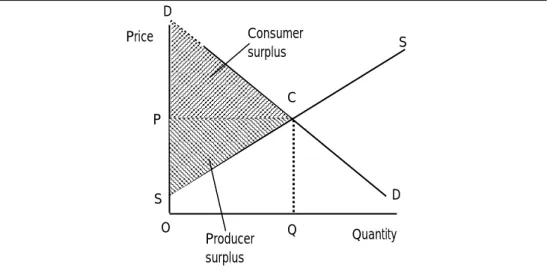
Figure 2 Standard concepts of producer and consumer surplus 13
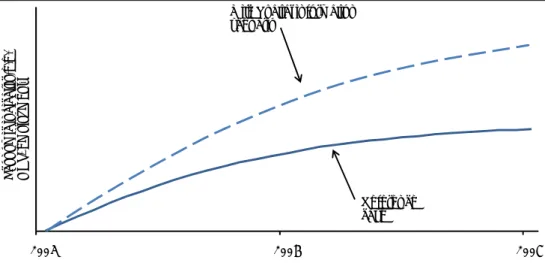
Figure 3 Economic indicators with and without spatial information 19
Figure 4 Technology adopter categories 25
Figure 5 Indicators of industry concentration 27
Figure 6 Productivity trends in agriculture, forestry and fishing, 1974-75 to
2005-06 (index, 2004-05 = 100) 29
Figure 7 Demonstration of auto-steering set-up 31
Figure 8 Vessel monitoring system 39
Figure 9 Australia’s initial and remaining commercial plus non-commercial
reserves of crude oil, condensate and sales gas 43
Figure 10 Australia’s annual production of crude oil and condensate 1975-2004 and forecast annual production at 90%, 50% and 10% cumulative probability
2005-2025 44 Figure 11 Increase of ‘in-ground’ resources since 1975, selected minerals, Australia 44
Figure 12 Increase in annual production of major minerals, Australia (1991-2006
average compared with 1975-1990 average) 45
Figure 13 AuScope geoscience research infrastructure 51
Figure 14 Route selection – spatial model 59
Figure 15 Productivity trends in the construction industry, 1974-75 to 2005-06
(index, 2004-05 = 100) 64
Figure 16 Value contributed by WALIS, per staff member, by sector 100
Figure 17 The SIX channels 103
Figure 18 Spatially enabled development approvals in Queensland 105
Figure 19 Spatial information supply chain 141
Figure 20 Effect of constraints on productivity impacts 157
Figure 21 Search volumes for Google Earth and Google Maps 162
Figure 22 Search volumes for Maps and Google Maps – Australia 163
Table 1 Direct impact of spatial information on productivity and resource
availability xviii
Table 2 Aggregate impact of spatial information in 2006-07 xix
Table 3 Effect of constraints on Scenario 1 outcomes xxiii
ix
Table 5 Forestry impacts 37
Table 6 Direct impacts for fisheries 41
Table 7 Direct impacts – mining and petroleum 53
Table 8 Total lots created in WA, 1995-96 to 2006-07 55
Table 9 Direct impacts – property and business services 61
Table 10 Direct impacts – construction 69
Table 11 Direct impacts – transport 76
Table 12 Direct impacts – utilities 84
Table 13 Direct impacts – Communications 87
Table 14 Direct impacts – retail and trade 88
Table 15 Direct impacts – manufacturing 91
Table 16 Direct impacts – government 128
Table 17 Sectors in the Tasman Global database 131
Table 18 Direct impact of spatial information on productivity and resource
availability 134
Table 19 Economic impacts of two scenarios 135
Table 20 Industry impacts of two scenarios – increase in output attributable to
spatial information 137
Executive summary x
Executive summary
The Cooperative Research Centre for Spatial Information (CRC-SI) commissioned this study with the following terms of reference: 1. to establish the verified and quantified economic impact of spatial
information to the Australian economy in 2006-7 year
2. to estimate the cost of inefficient access to data and identify the factors operating to create these inefficiencies
3. to consider the future prospects for spatial data to contribute to Australia’s economic, social and environmental development goals.
We gratefully acknowledge the assistance of the Australian Government Department of Finance and Administration – Consultative Committee on Knowledge Capital – and the Queensland Department of Treasury – Office of Statistical Research – for reviewing the original brief.
Key findings
Aggregate economic impacts
The National Accounts do not capture the full extent of the spatial information industry.
• However it is conservatively estimated that industry revenue in 2006-07 could have been of the order of $1.37 billion annually and industry gross value added around $682 million.
The economic footprint of the spatial information industry is considered to be larger than this. Spatial information is increasingly being used in most sectors of the economy where it is having a direct impact on productivity.
This study found that in 2006-07 the accumulated impact of these direct impacts:
• contributed to a cumulative gain of between $6.43 billion and $12.57 billion in Gross Domestic Product (GDP)
− equivalent to 0.6% and 1.2% of GDP respectively
• increased household consumption by between $3.57 billion and $6.87 billion on a cumulative basis
• increased investment by between $1.73 billion and $3.69 billion on a cumulative basis
• had a positive impact on the trade balance
− exports were between $1.26 billion and $2.30 billion higher than they would otherwise have been
Executive summary xi
− imports were between $1.18 billion and $2.23 billion higher than they would otherwise have been
• real wages by were between 0.60% and 1.12% than they would otherwise have been.
Other impacts
Beyond these results the spatial information industry also contributes to a range of public impacts, including biosecurity, environment and social benefits. The case studies undertaken for this report revealed that spatial information has an important and increasing role in biosecurity. A recent example was the role that spatial information played in managing the spread of equine influenza virus in Australia in 2007.
The Department of Agriculture Fisheries and Forestry has estimated that costs of control and reduced production from pests and diseases could be as high as $8 billion per year. The Productivity Commission estimated that the impact of an outbreak of Foot and Mouth Disease on GDP could be between $2 billion and $13 billion in the first year. The contribution of spatial information to implementing biosecurity programs could be in the order of hundreds of millions of dollars in some years.
The current and potential value of spatial information systems in natural resources management, water and carbon markets was not assessed for this report. However it is likely that this value is large both in economic terms as well as in terms of sustainability of natural systems.
The transport case studies in this report suggest that the use of intelligent transport systems could reduce greenhouse emissions by between 0.5 percent and 1.5 per cent estimated to be worth between $50 million and $150 million per annum assuming a carbon price of $15 per tonne CO2-e. These systems are heavily reliant on spatial information.
The spatially enabled National Carbon Accounting Scheme will provide significant support towards reducing net emissions of greenhouse gases. In terms of overall reduction in greenhouse gas emissions, the value of reducing emissions to 108% of Australia’s emission levels in 1990 (Australia’s Kyoto target) would be valued at around $1.4 billion at current carbon prices. There is therefore a sufficient body of evidence to suggest that the spatial information industry is delivering significant environmental and social benefits in addition to the economic benefits identified above. These benefits can be expected to increase significantly as spatial information systems are further integrated into the operation of water markets, carbon markets, natural
Executive summary xii
resources management and environmental management and monitoring programmes more generally.
Cost of inefficient access to data
Constraints on access to data are estimated to have reduced the direct
productivity impacts in certain sectors by between 5% and 15%. It is estimated that this could have resulted in GDP and consumption being around 7% lower in 2006-07 (around $0.5 billion) than it might otherwise have been.
Future potential
The contribution of spatial information is likely to increase as spatial information becomes a mainstream enterprise resource in government and business organisations and as it penetrates mainstream consumer markets. Increased adoption and new applications in existing sectors could increase the direct impacts in some sectors by up to 50% over the medium term. However a larger impact is likely to be in new applications in a wider range of industries. The scale of the future contribution will be driven by the policy environment in respect of data access and skills development, further innovation in existing and new applications, increased awareness in government and industry and, most importantly, future application of new innovations in business systems.
The report
This report is based on research and case studies in twenty two sectors of the Australian economy augmented by a literature review of international and Australian studies. For each sector, the direct impact of spatial information has been estimated under two scenarios.
In each sector, care has been taken to develop a realistic “counterfactual” to ensure that the direct impacts of spatial information are not overstated. These direct impacts have been applied to a general equilibrium model to calculate the aggregate impact of spatial information on the Australian economy.
Literature review of past research
There is a growing body of literature, both Australian and international documenting how business and government use spatial information, and the impacts it has had in specific sectors. The literature recognises the need for a systematic assessment of its overall impacts (Alexander, 2003). ACIL Tasman is not aware of any studies that have assessed the aggregate impact of spatial information on national economies.
Executive summary xiii
Case studies and reviews
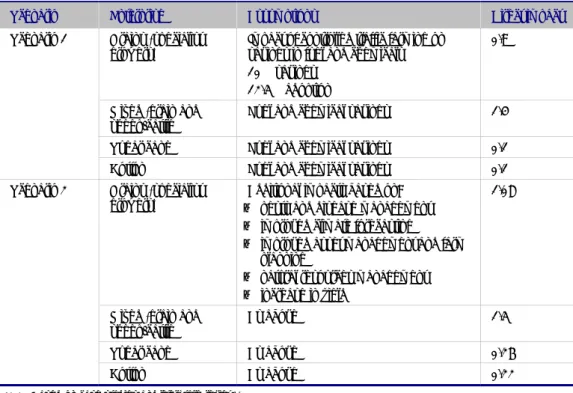
In the case study analysis, ACIL Tasman explored the level of impacts and extent of adoption of spatial information in the private and public sectors. These indicators, together with evidence from literature reviews and industry interviews, contributed to the estimates of the accumulated direct impact in each sector under two scenarios:
• a quantifiable ‘lower bound’ scenario (scenario 1) which reflects the impacts we have been able to confidently and verifiably quantify through the use of reliable statistics, existing literature, expert opinion and through our case studies
• a ‘realistic’ estimated scenario (scenario 2) which comes closer to what we believe to be the reality (as distinct from that which we can confidently quantify).
Some of the sectors and the basis for the estimates of the direct impacts are discussed below. The accumulated direct impacts are summarised in Table 1 at the end of this discussion.
Agriculture
Increases in productivity in broad acre agriculture of 10% can be attributed to controlled traffic farming using geospatial information systems (GIS),
augmented global navigation satellite systems (GNSS) and automated steering. Adoption in Australia is estimated to be around 10% in 2006-07. These
parameters were used to estimate the impact of spatial information in agriculture for scenario 1.
Use of spatial information in variable rate application, yield monitoring, whole farm planning, natural resources management and pest and disease
management were taken into account in scenario 2.
Forestry
Spatial information systems are increasingly being used in both public and private forestry. Applications include inventory management, remote assessment of forest attributes yield estimation, canopy health mapping and operations management.
The integration of a spatial information system developed by NGIS – ForMS- into Great Southern Plantations’ corporate systems has created a centrally located system for capturing, storing and tracking plantation activities. This has increased the area that can be managed by each manager by 50%.
Executive summary xiv
It was estimated that there is 100% adoption of these technologies in hardwood plantations and around 2.5% of the area managed by the public forestry sector in both scenarios.
Fisheries
Spatial information is used for recording fishing tracks, fisheries management and habitat mapping. A case study of the commercial fishing industry indicated that GPS plotters had improved productivity of commercial fishing operations by around 12%. Allowing for levels of adoption and limiting this to the fin fishing industry this is estimated to have produced a 4% improvement in total factor productivity in the fishing industry in scenario 1.
The additional benefits in improved fisheries management and productivity improvements in the non fin fish industry are taken into account in arriving at the estimate of 5.14% improvement in total factor productivity for scenario 2.
Mining and resources
The mining and petroleum sectors have been using spatial information in exploration and in planning, developing and managing operations for many years.
In the coal industry spatially enabled robotic mining is delivering around 37% improvements in productivity at around a 9 % adoption rate in 2006-07. Use of the spatial information application “Millmapper” in precious metals mining is estimated to have improved milling operations and generated costs savings of around 2.4% with an adoption rate of around 11%.
Spatial information also assists in the operation and upgrade of mines with 3D techniques improving management of faulting problems in coal mines and off-site fabrication of new equipment and in bulk commodities handling.
In the upstream petroleum industry, spatial information is improving site selection and management of infrastructure, lowering environmental
compliance costs and supporting deep water off-shore oil and gas operations. The geoscience and exploration communities were early adopters of spatial information using techniques such as 3D seismic and later airborne geophysics to identify and characterise potential commercial resources. A significant proportion of the major new minerals and petroleum projects established since the late 1970s were discovered with the aid of spatially enabled exploration techniques.
Executive summary xv
The additional production from oil (mainly condensate), gas and minerals (excluding coal) realised as a result of these technologies is estimated to be 3%, 5% and 7% respectively for the general equilibrium modelling in this report.
Property and services
This sector includes a key part of the ‘core’ spatial industry i.e. the surveying industry. However, there are also many other businesses that use new spatial information systems including advertising and market research (which now routinely use GIS packages), property, planning, engineering, architecture, retail and trade.
Spatial information has the potential to significantly enhance the speed of urban land and infrastructure development.
A case study based on the production of the land industry in WA indicated a productivity increase of around 61% arising from the use of new spatial information technologies by the surveying profession. This was the basis for estimating the 0.5% impact in scenario 1.
The impact of other applications, including technologies such terrestrial laser scanning for 3D surveying and improvements in route and site selection, has been taken into account in the 0.7% impact estimate in scenario 2.
Construction
Spatial information technologies are routinely applied in the construction industry to accelerate planning and design, coordinate contractors and sub-contractors, manage projects over multiple sites, and aid architects, engineers, fabricators during construction and in the maintenance phase.
Several case studies demonstrated the power of spatial information. Spatial information is reported to have delivered savings of around 10% in the East Link road project in Melbourne with 50% faster map production and 80% faster access to information. In another example, GNSS-enabled surveying and design when combined with automated machine guidance delivered costs savings to the Forbes Shire Council road works. Maintenance is also assisted by GPS and GIS mapping systems for recording repair requirements and managing maintenance.
A 10% improvement in productivity is estimated in the construction sector with and adoption rate of the order of 2.5% in scenario 1 and 5% in scenario 2.
Executive summary xvi
Transport and storage
The transport and storage sector was one of the earlier adopters of spatial information technologies. The use of GIS and GNSS technologies has been steadily growing for about a decade and it is now one of the fastest growing areas of GIS deployment.
Productivity gains in this sector are attributed to improvements in logistics, route selection and itinerary planning, transport planning, vehicle tracking, traffic and congestion management, transport operations in rail and air and intelligent transport systems.
The estimate of 1.4% productivity improvement in scenario 1 is based on the observed applications in intelligent transport systems, including route planning and GNSS enabled freight management. The estimate of 1.58% in scenario 2 is based on observations of applications in GNSS in taxi location services, lower congestion and road hazard management, improved supply chain transport planning and in air navigation.
Utilities
The utilities sector – electricity, gas and water – are significant users of spatial information. The main benefits to this sector are in improved asset
management, better management of supply and demand and in the planning and construction of new pipelines, power lines, generators and storages. The case studies of Melbourne Water and Ergon Energy confirmed that savings in asset management and planning are being realised.
The case study of a Hazwatch application illustrated the potential for innovation in the use of spatial data to improve the management of natural hazards by utilities managers.
In scenario 1, the 0.73% impact is based on improved asset management in the electricity and water sectors. In scenario 2, the 1.25% impact takes account of wider applications in water, gas and electricity including asset and operations management, market planning and hazard management.
Communications
Spatial information is used in the communications sector for network planning, asset management and address management and route planning in the case of postal services.
The productivity improvements in scenario 1 are based on estimates of improvements in asset management and network planning in
Executive summary xvii
2, the impacts of improvements in GNSS use in postal and courier services, telecommunications market analysis and targeted marketing (1.32%) is taken into account.
Government
Government is a major user of spatial information. Areas of application include geoscience, bathymetry, natural resources and environmental
management, biosecurity, defence and security, air and sea navigation safety, search and rescue, land development administration, development approvals, environment protection, program management and administration and policy formulation.
Spatial information is improving service delivery in all jurisdictions although there are only limited economic studies of the broader economic benefits. An economic assessment of the Western Australian Land Information System, demonstrated a benefit cost ratio of 9 to 1 to investment in coordination, capture and management of spatial data in Western Australia.
Case studies of the National Carbon Accounting Scheme and the National Water Audit undertaken for this report confirmed the importance of spatial information to policy formulation and management for climate change and water resources.
The case studies identify productivity improvements in administration of development approvals of around 7% in labour costs. The literature and case studies suggest that this is a conservative indicator of the improvement in administration in government services more broadly. A 50% adoption rate was assumed across all levels of government, leading to an estimate of a 0.34% productivity improvement in scenario 1.
In scenario 2, the 1.05% productivity improvement is based on observed – but not measured – improvements in asset management, service delivery more generally, infrastructure planning, defence, emergency services, risk
management, biosecurity, compliance and regulation.
Other areas
ACIL Tasman’s research also examined retail and trade, tourism and
manufacturing. The take-up of spatial information in these areas is occurring but not as fast as in the sectors discussed above. No productivity shocks are included in scenario 1 while small productivity improvements are included in scenario 2.
Executive summary xviii
Results
The accumulated direct impacts are summarised in Table 1.
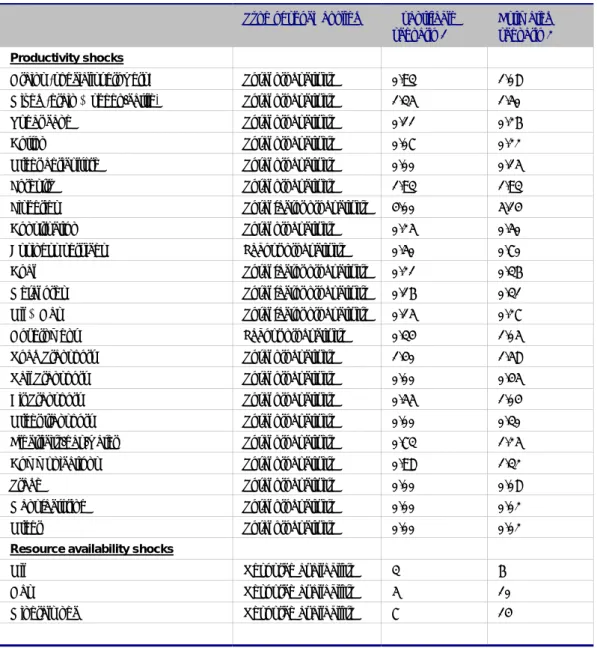
Table 1 Direct impact of spatial information on productivity and resource availability
Type of shock applied Quantifiable scenario 1
Estimated scenario 2
Productivity shocks
Grains (specialist growers) Total productivity 0.93% 1.08%
Mixed (grain & sheep/cattle) Total productivity 1.35% 1.50%
Sugar cane Total productivity 0.11% 0.26%
Cotton Total productivity 0.07% 0.22%
Other agriculture Total productivity 0.00% 0.15%
Forestry Total productivity 1.93% 1.93%
Fisheries Total factor productivity 4.00% 5.14%
Construction Total productivity 0.25% 0.50%
Business services Labour productivity 0.50% 0.70%
Coal Total factor productivity 0.21% 0.36%
Metal ores Total factor productivity 0.16% 0.31%
Oil & Gas Total factor productivity 0.15% 0.27%
Government Labour productivity 0.34% 1.05%
Road Transport Total productivity 1.40% 1.58%
Rail Transport Total productivity 0.00% 0.45%
Air Transport Total productivity 0.55% 1.04%
Other transport Total productivity 0.00% 0.30%
Electricity/gas/water Total productivity 0.73% 1.25%
Communications Total productivity 0.98% 1.32%
Trade Total productivity 0.00% 0.08%
Manufacturing Total productivity 0.00% 0.02%
Other Total productivity 0.00% 0.02%
Resource availability shocks
Oil Resource availability 3% 6%
Gas Resource availability 5% 10%
Minerals nec Resource availability 7% 14%
Data source: ACIL Tasman calculations and estimates
Executive summary xix
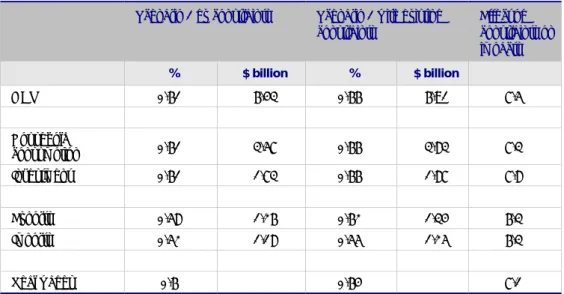
The aggregate model results are summarised in Table 2.
Table 2 Aggregate impact of spatial information in 2006-07
Scenario 1 Scenario 2 Productivity only Productivity plus
resources
Productivity only Productivity plus resources
% $ billion % $ billion % $ billion % $ billion
GDP 0.51% 5.31 0.61% 6.43 0.99% 10.31 1.20% 12.57 Household consumption 0.50% 2.89 0.61% 3.57 0.93% 5.39 1.16% 6.78 Investment 0.51% 1.43 0.61% 1.73 0.98% 2.78 1.20% 3.39 Capital stock 0.56% - 0.72% - 1.05% - 1.38% -Exports 0.45% 0.98 0.58% 1.26 0.80% 1.73 1.07% 2.30 Imports 0.39% 0.89 0.52% 1.18 0.72% 1.64 1.98% 2.23 Wages 0.50% - 0.60% - 0.92% - 1.12%
-Note: Scenario 1 is a ‘lower bound’ scenario which reflects the impacts ACIL Tasman has been able to confidently and verifiably quantify through the use of reliable statistics, existing literature, expert opinion and through case studies
Scenario 2 is considered a ‘realistic’ estimated scenario which is considered to be closer to the situation in 2006-07. Data source: ACIL Tasman
Cost of inefficient access to data
In 2001, the Spatial Information Industry Action Agenda launched an ambitious program of policy reform for government and industry. The
research undertaken for this report suggests that while progress has been made in some areas, success has been mixed.
Availability of fundamental data
Fundamental data includes data that is collected by agencies under public interest programmes and also data that is collected by agencies to meet specific agency purposes but may be made more widely available in the public interest (ANZLIC, 2001). Some fundamental data is created by the private sector (such as cadastral and some minerals exploration data) but captured by the public sector.
Some businesses consulted in the course of preparing this report, expressed a concern that Australia’s competitiveness in this areas is being hampered by gaps in fundamental data relative to the quantity and quality of information available to some of their overseas competitors.
The consequences of gaps in fundamental data include:
• inefficiencies in planning for future infrastructure and redoing surveys to collect data that may have been captured previously at a low marginal cost
Executive summary xx
• less well informed policy formulation in natural resources management, environment and climate change adaptation
• lost opportunities for innovation and development of new products by the private sector
• less efficient planning and responses to emergencies such as bush fires and flooding
• lower efficiencies in developing faster development approvals and land management
• less opportunity for new approaches to asset management.
State governments are attempting to address fundamental data sets such as cadastre, topography, property, roads and geo-referenced imagery. Examples include the Shared Land Information Platform (SLIP) in Western Australia and the Spatial Information Exchange in NSW. However gaps in fundamental data remain.
Spatial data infrastructure
An essential component of a spatially enabled economy is the enabling infrastructure. With current technology, such infrastructure can be a virtual system that does not require the centralised storage of data. However, to work effectively, this requires interoperable architecture, based on distributed custodial spatial information management and open standards.
Consistent with this, one of the goals of the Spatial Information Action Agenda was the development of the Australian Spatial Date Infrastructure (ASDI). However many businesses, consulted in the course of preparing this report, consider that the ASDI – as it is currently implemented – falls short of providing ready and seamless access to spatial data. Although progress has been made in some important areas, spatial data collected, managed and disseminated at each level of government remains somewhat fragmented. For example, an independent study into the accuracy and currency of the metadata records of the Australian Spatial Data Dictionary (ASDD) found that the metadata was out of date and could not be used to convert to the new ANZLIC profile.
There are specific examples of world’s best practice applications in spatial information management systems. The Queensland Spatial Industry Strategy (QSIIS), the Western Australian Land Information System (WALIS) and the Shared Land Information Platform (SLIP), the NSW Government Community Access to Natural Resources Information (CANRI) and the NSW Spatial Information Exchange (SIX), and the Victorian land and property information systems are good examples. However, overall progress towards whole-of-government approaches and engaging industry at state whole-of-government levels has been mixed.
Executive summary xxi
Australia’s vision for the ASDI was built on the idea of multi-agency co-operation which in itself is difficult, as well as collaboration across different levels of government and between government and industry.
The lack of a consistent whole-of-government approach and the inadequate engagement between governments and industry has consequences for the growth of the spatial information industry.
Access to data
Consistency in access arrangement to fundamental data is crucial for its
efficient use. ANZLIC has promulgated guidelines for best practice in enabling access to spatial information and hence spatially enabling the economy these guidelines are not being uniformly implemented across Australia.
Simple and effective access
An access arrangement should provide a simple, effective means of locating and obtaining spatial information.
For the widest possible access, custodians should offer a multi-faceted
approach to delivery of information, catering for all types of users. This is not yet being achieved uniformly. On another front, digital rights management (DRM) is an area of interest, as the internet has become the centre of distribution for digital goods of all sorts, including spatial information.
Fitness for purpose
Users of spatial data must be able to easily ascertain the quality of their information and its ability to meet their requirements. In 2003 ANZLIC nominated the topic of ‘data quality’ as being one of five core issues still needing to be addressed as part of the ASDI development. In 2007, the study of NSW metadata found issues with the accuracy and currency of records surveyed. A major project is underway to update its records to comply with the ANZLIC modified implementation profile.
Spatial information quality has progressed considerably in recent decades in line with data transfer standards, with the introduction of international geographic data quality-related standards and the widespread adoption of metadata entry tools for the production of metadata for entry in searchable, web-based directories. However, the metadata remains in many formats and are currently not totally valid.
Executive summary xxii
A national licensing framework
Custodians of spatial information must ensure that its distribution and use is in accordance with licences, agreements or other appropriate mechanisms that effectively manage the risks associated with the use of the information. The organisation acting as a data custodian is responsible for maintaining copyright provisions and ensuring that use of the information does not infringe any privacy or confidentiality requirements.
However current licensing practices have not kept up with the pace of technology.
An important development that is gaining widespread support in government is the development of a Government Information Licensing Framework (GILF). The GILF would be a standardised legal environment of terms and conditions within which all information transactions would occur.
A possible avenue of facilitating information sharing across jurisdictions is the Creative Commons licensing regime. Creative commons licenses are designed to facilitate and encourage more versatility and flexibility in copyright. The Queensland government, in consultation with other governments, has been developing a draft access regime based on this principle. An important feature of the proposed approach is its capability to enable licences to be executed at the time of data transfer. This will increase the efficiency of user access while at the same time achieving the above aims.
Pricing
Across and within levels of government there are differences in pricing and cost recovery policies. While governments adhere to the principles of cost recovery and competitive neutrality, individual agencies may interpret these principles in different ways.
Principles for pricing for fundamental data were set out by the Productivity Commission in a report released in 2001. The Australian Government implemented pricing principles in line with these recommendations in 2001. The impact on the dissemination of fundamental data from the
Commonwealth was a dramatic increase over the following years. However not all jurisdictions have implemented these policies and fundamental data is often issued at above the cost of its distribution. It is apparent that, in some cases, over-recovery of costs is occurring through the sale of value added spatial information by some government agencies.
Executive summary xxiii
Overall cost of inefficient access to data in 2006-07
Lack of completeness in policies relating to simple and effective access, fitness for purpose and development of a whole-of-government licensing framework are creating concern for spatial some information users.
The cost is in slower development of applications and less than optimal levels of application and innovation among users.
This is likely to have had an impact in the property and services, construction, government, transport and agricultural sectors. It is likely to have reduced the extension of spatial information into areas such as asset management in utilities, transport and storage applications and in emerging areas of consumer markets and applications in other industries.
The interviews and case studies in this report indicate that the biggest negative impact on productivity occurs in the areas of agriculture, transport, asset management and property and services. Productivity impacts in these sectors might have been between 5% and 15% lower as a result of these constraints. This could have resulted in the impact on GDP and consumption being
around 7% lower than it might otherwise have been under scenario 1 (Table 3).
Table 3 Effect of constraints on Scenario 1 outcomes
Scenario 1 ex constraints Scenario 1 with existing constraints Effect of constraints on impacts % $ billion % $ billion % GDP 0.61% 6.43 0.66% 6.91 7.5% Household consumption 0.61% 3.57 0.66% 3.83 7.3% Investment 0.61% 1.73 0.66% 1.87 7.8% Exports 0.58% 1.26 0.62% 1.34 6.3% Imports 0.52% 1.18 0.55% 1.25 6.3% Real wages 0.6% 0.64% 7.1%
Note: Based on impacts adjusted by the estimate of the effect of constraints on increased productivity shocks.
Data source: ACIL Tasman modelling using Tasman Global
These are broad estimates of the economic welfare loss arising from inefficient access to data. Policy formulation may benefit from more specific estimates of welfare losses from current arrangements, particularly pricing policies. This would assist agencies when building the business case for funding of future maintenance and dissemination of fundamental data sets.
Executive summary xxiv
Future prospects
The future prospects for the spatial information industry are promising both in the medium term (five years) and the longer term (ten years).
Medium term
The contribution of spatial information to future economic activity will continue to grow as awareness of its potential grows. Medium term growth is expected to be driven by the following factors:
• increased adoption in existing applications • introduction of new applications
• increased penetration into non traditional sectors and new markets • increased use by government in delivery of services.
It would not be unreasonable to expect that the adoption levels in some sectors would increase by up to 50% over the next five years with current policies in place.
It is also certain that adoption in low using sectors will also increase over the next five years – although the level and nature of the applications is hard to predict.
The importance to Australia in managing the challenges of climate change, water, energy, natural resources management and biosecurity are outlined in this report. Maintenance of defence, security and emergency management services is also highly valued by the community.
While it is not possible to quantify the value of the contribution that spatial information make to areas, this report suggests that the value of the
contribution is as significant in as the economic impacts discussed in this report.
Spatial information technology is crucial for effective and better management of these challenges. There are many examples cited in this report that show how spatial information is now crucial to many important government services. This report shows that that the application of spatial technologies in these areas is increasing.
Overall, it is possible that with the right policies the contribution of the spatial information sector to the economic aggregates over the medium term could be up to 50% higher than in 2006-07.
Executive summary xxv
Longer term
Important future developments in spatial information that are likely to further enhance its economic impacts in the longer term are:
• the falling cost of acquiring data
• continuing developments of computing power making more applications and richer data analysis possible
• the arrival of spatial technologies into the consumer mainstream. These developments are likely to lead to:
• a transition from spatial information as project based applications to mainstream enterprise systems
• The emergence of a new phase in the evolution of spatial information into mainstream consumer markets and business systems.
This will be a step up in the role that the spatial information plays in the Australian economy. It is likely to significantly increase in the value of its contribution to economic, social and environmental outcomes.
This evolution of the spatial information industry is likely to enhance the transformation from information based industries to knowledge based industries in Australia. This will be a crucial development for sustaining the international competitiveness of Australian industries.
The spatial information industry is creating valuable options for Australian society – in economic, environmental and social terms. The risk is that some of these options could be extinguished through non optimal policies and programs.
Implications for research priorities
The contribution of spatial information could be increased by addressing research priorities in the following categories:
• technologies to improve availability and access of data
− fundamental data
− data infrastructure
− data access
• increasing the effectiveness of spatial technologies and addressing determinants of adoption rates in traditional areas including
− agriculture
− property and services
− construction
Executive summary xxvi
− transport
− communications
− biosecurity
− environment
− carbon and water trading
− defence, security and emergency services
• developing technologies and techniques to support the move of spatial information into mainstream enterprise applications
− integrating with management systems
− exploring social and economic research applications
• developing technologies and techniques to support mainstream consumer applications
− personal applications
− locational systems
− property and consumer information
− public transport and infrastructure use.
These observations are a starting point for consideration of the research priorities.
Introduction 1
1
Introduction
1.1
Terms of reference for this report
The Cooperative Research Centre for Spatial Information (CRC-SI) commissioned ACIL Tasman in July 2006 to conduct an independent quantifiable analysis of the value of spatial information to the Australian economy.
The study had three objectives:
1. to establish the verified and quantified economic impact of spatial information to the Australian economy in 2006-7 year
2. to estimate the cost of inefficient access to data and identify the factors operating to create these inefficiencies
3. to consider the future prospects for spatial data to contribute to Australia’s economic, social and environmental development goals.
The terms of reference for this report are reproduced in full in Appendix A. We gratefully acknowledge the assistance of the Australian Government Department of Finance and Administration – Consultative Committee on Knowledge Capital – and the Queensland Department of Treasury – Office of Statistical Research – for reviewing the original brief.
1.2
What is spatial information and what does this
report cover?
Spatial information (SI) describes the physical location of objects and the metric relationships between objects.
Spatial information was originally recorded on paper maps and was the area of interest of surveyors, navigators, engineers and astronomers. This situation remained essentially unchanged until the advent of modern computers which has permitted maps to be produced, and therefore spatial information to be disseminated, in digitised form. The marginal cost of disseminating digitised spatial information is often close to zero.
Digital mapping, digital photography and remote sensing technologies fit easily into digital communications systems. When combined with in geographic information systems and accurate satellite positioning systems they provide an opportunity for layering data in ways that were not possible prior to say 1990. The increase in processing power has also allowed capture and analysis of spatial data to move beyond ‘surface description’ to subsurface or
three-Introduction 2
dimensional data, and from static points to real time analysis of moving objects. Seismic mapping, photogrammetry, and many other areas of application have consequently emerged as specialties in their own right. Modern technologies used to acquire and process spatial information include satellite based global positioning systems and imagery, geographical
information systems, information and computing technology systems and a range of simulation and modelling software that enables a wide range of geospatial data to be layered onto digital maps.
This report is primarily concerned with what may be termed ‘modern’ spatial information technologies. As already indicated this typically involves spatial information in digitised form, whether it is based on transmissions from satellites or based on modern ways of mapping the earth.
1.2.1 Relative and absolute spatial information
There is a basic distinction between relative and absolute spatial information. Absolute spatial information requires geographical coordinates and delivery of these has in recent years been made possible at increasing levels of accuracy due to the advent of global positioning systems (GPS). Absolute spatial information, delivered in digitised form, is certainly included in this report. Relative spatial information captures relationships of objects in space. A number of modern production techniques rely on very accurate relative spatial information. For example, underground mining machines are increasingly automated and use an array of high-tech sensors and tools to capture and process relative spatial information.
There is no ‘hard-and-fast’ or objective rule to decide whether new processes or products that rely on relative spatial information should be included in this economic assessment – for example modern computer assisted design (CAD) programs deal with relative spatial information. Basic CAD was however excluded from the scope of the present analysis as it was judged to fall within general ICT.
Inter-operability and layering was used several times as a criterion to help decide whether a process or application qualified as ‘modern’ spatial information technology.
For example, where absolute spatial information was integrated into CAD through layering of absolute spatial data over existing relative data this was accepted as being ‘modern’ spatial information technology.
Introduction 3
1.3
Users of ‘modern’ spatial information
There are currently few, if any, sectors of the economy that have not begun to use modern spatial information technologies. Sectors such as property and business services (including surveying), mining, energy and agriculture are already reaping significant benefits from their use.
Government is also one of the biggest users. Spatial technologies support a wide range of activities including geoscience, bathymetry, biosecurity, emergency management, defence, environmental and natural resources management, development approvals and public administration.
The spatial information industry 4
2
The spatial information industry
This report uses the term ‘industry’ to refer to the private sector element of the (broader) spatial information ‘sector’1. For the purposes of this study the
spatial industry is defined as follows:
The modern spatial information industry acquires, integrates, manages, analyses, maps, distributes, and uses geographic, temporal and spatial information and knowledge. The industry includes basic and applied research, technology development, education, and applications to address the planning, decision-making, and operational needs of people and organizations of all types.
Many of these activities are also carried out by members of the wider spatial information ‘sector’, which includes various government departments, public or semi-public agencies, universities and other not-for-profit institutions (such as the CRC for Spatial Information (CRC-SI) and some companies.
In the national accounting sense, all of these producers of spatial information and spatial information technology would be categorised as an industry. However, as already pointed out, this report reserves the term industry to the private sector only.
2.1.1 The Australian spatial information industry
Internationally, it is recognised that the spatial information sector is evolving rapidly. The (private sector) industry is expanding into a broad industry encompassing more than just surveying and cartographic activities.
Many of the technology enablers and value-adding organisations in the industry identify themselves as part of information and telecommunications services, or would classify their activities as services to areas such as transport, agriculture or mining. Their turnover and value-added contribution would accordingly be recorded in the national accounts as part of those service sectors. This makes it very difficult to get an accurate picture of the size of the industry.
As already noted, there is also a substantial amount of spatial activity in the public and not-for-profit sectors. This further complicates assessment of the spatial information sector as a whole.
1 Readers are warned that this terminology sometimes conflicts with the terminology used in
national accounts, where an industry may include government activities. The ABS tourism satellite account is a good example of a measure of the tourism industry which includes a wide range of activities that may or may not be within the private sector.
The spatial information industry 5
The latest Australian and New Zealand Standard Industrial Classification (ANZSIC (2006)) does not define the spatial information industry as a separate industry. ANZSIC does capture quantitative data at a micro level classification called ‘Surveying and Mapping Services – code 6922’, which does include a number of ‘core’ participants in the spatial industry(see Box 1).
Box 1 ABS Classification (ANZSIC) for ‘core’ spatial information industry activities
The updated ABS 2006 industry classification (ANZSIC) sector ‘Surveying and Mapping Services – code 6922’ includes the following services:
• Aerial Surveying Service
• Cadastral Surveying Service
• Engineering Surveying Service
• Geodetic Surveying Service
• Gravimetric Surveying Service
• Hydrographic Surveying Service
• Land Surveying Service
• Map Preparation Service
• Mining Surveying Service
• Oceanographic Surveying Service
• Photogrammetry
• Seismic Surveying Service
Whilst industry code 6922 does include businesses that fall within the spatial information industry, it is unclear to what extent these businesses rely on ‘modern’ spatial information technologies. Many surveyors, for example, still use traditional techniques, although our interviews with a number of surveyors revealed that they are increasingly acquiring more modern systems which integrate GPS or other modern spatial technologies.
In the absence of more accurate information on the exact composition of activity undertaken, however, ANZSIC industry code 6922 provides the best gauge of the size of the spatial information industry.
Estimates of the size of the industry at the time of the Spatial Industry Action Agenda (2001) included an ABS estimate for the total operating income of the Surveying Services industry of $926 million in 1998-99.
More recently, the industry in Victoria together with the Victorian Government conducted in a census of the spatial information industry in Victoria (Fivenines Consulting, 2005). Using this data and extrapolating the
The spatial information industry 6
results nationally ACIL Tasman estimates that the spatial information industry nationally consists of:
• 750 spatial information businesses with:
− total revenue of $1.37 billion annually
− industry gross value-added of $682 million.
The national industry footprint is thought to be much broader than illustrated in these figures. Recent research undertaken for the Spatial Education
Advisory Committee (SEAC) suggests that:
• the number of people employed directly in the spatial information industry was around 31,400 people
− with another 61,000 people engaged in using spatial information services in government and industry
• a total of around 93,000 people directly involved in spatial information services in industry and government (SEAC, 2007).
The industry’s role in the economy 7
3
The industry’s role in the economy
3.1.1 The “Where?” question
Expressed in the simplest terms, the spatial information industry seeks to provide better answers to “where?” questions such as:
• where are my assets? • where are my customers?
• where should we plant, build, drill, or fish?
As indicated in Section 1.2, these questions have always occupied decision makers, and resources have always been devoted to answering these types of questions.
In the past, however, it was often impossible to collect specific spatial
information, and even where it was possible, it was often too expensive to do so.
New spatial information technologies have made it possible to answer many of the “where?” questions that have previously gone unanswered. The
technologies also permit us to ask new types of “where?” questions. However, as the economy has evolved and adapted to function in the absence of this type of information, some decision makers have simply forgotten to ask the “where?” question. Others are not aware that their fundamental questions could perhaps be answered using these new technologies.
3.1.2 Footprint versus impact
In order to understand the role of any sector in the economy, several layers of analysis can be applied. For example, an estimate of the size of the sector (e.g., number of workers, turnover, value-added) might be presented as an indicator of the significance of that sector. Such types of measures capture what might be termed the direct ‘footprint’ of a sector on the economy.
Delineation of the economic footprint of spatial information technology on the economy involves a comprehensive overview of where activity is occurring and the extent of it. Footprint goes further than the estimates of the (private sector) industry presented in Section 2.1.1 above, because it would include all resources devoted to data capture and custodianship as well as R&D and other activities that do not occur in the private sector. Box 2 illustrates the scope of the footprint of spatial information.
The industry’s role in the economy 8
Understanding the full footprint of spatial information activity will ultimately involve developing a better understanding and characterisation of many
activities that are currently carried by government and non-profit organisations, including collaborative research undertakings such as those of the CRC-SI. Detailed surveys may therefore need to be carried out to identify the amount of spatial activity currently being undertaken in various sectors of the
economy.
Box 2 Footprint of the spatial information industry
Data source: ACIL Tasman
It is also important to note that footprint measures can be misleading if applied inappropriately. For example, a subsidised industry might have a significant footprint only because it receives government support. Fledgling industries or industries with a concentration on R&D in the early stages of
commercialisation tend to be more heavily dependent on direct and indirect government support. As a result, footprint measures do not always provide a good basis on which to draw inferences about long term or dynamic value to the economy.
Footprint measures also do not capture the value of the technology to users. Economic impact assessments should therefore be based on wider assessments of a sector – an assessment that would typically include and account for
dynamic effects as well as non-financial linkages such as unpriced spillovers. Such information might not ordinarily be reflected as a financial transaction between organisations. Also, to fully capture ‘impact’, firm, industry and economy-wide assessments must take into account what might have occurred in the absence of spatial technology (the ‘counterfactual’ scenario).
The industry’s role in the economy 9
Box 3 illustrates how new spatial information technologies impact on the economy in complex ways. The example uses Millmapper (see case study in Section 6.3.3 of this report), but the illustration would apply to any application. As the box shows, Millmapper has a direct impact on productivity in precious metals mining, a sub-sector of the mining industry. Millmapper also comprises a component of the spatial information industry and increases the value added in that sector.
The direct impact of Millmapper feeds through into the broader economy through these routes causing resource shifts in the economy ultimately
resulting in higher economic activity – reported in terms of increases in Gross Domestic Product (GDP), consumption, investment and real wages.
Independent growth in other sectors of the economy can in turn impact on the spatial information sector (and industry) as well as other industries that have already been affected by the spatial information industry.
As a simple example, consider the fact that strong economic growth tends to increase the government tax base. Increased government revenues might then be spent on increasing funding for various projects that have a spatial
The industry’s role in the economy 10
Box 3 Direct and indirect impacts
Direct impacts are those that improve productivity or increase markets for an industry or sector such as might occur in the mining industry through improved mill
maintenance.
Indirect impacts are the impacts on each sector that arise after the direct effects on each sector have worked their way through the economy.
Economy wide impacts are the cumulative net increase in economic activity that results. Value added Productivity Value added Value added Economy wide impacts GDP Consumption Investment Wages Exports Imports Mining industry Other industries Precious metals production Spatial industry value added Millmapper Productivity
Data source: ACIL Tasman
Advanced economic models such as computable general equilibrium (CGE) models, whilst abstracting from reality, do capture the way in which funds flow through the economy and resources shift between sectors as a consequence of productivity growth and other changes such as shifts in consumer demand or changing world prices for commodities.
Notice that advanced economic modelling recognises the role of users of technology, including intermediate users. Millmapper feeds into mining industry, but the mining industry does not itself sell to final household consumers. Other sectors further refine the product obtained from mining or utilise it to produce the products that households ultimately consume.
A good way of conceptualising the impact of the spatial information sector therefore recognises that the output of the sector is rarely targeted at ‘final’ household consumers, but usually enables other production processes. The sector produces ‘platform’ technologies which facilitate and assist in producing new solutions to existing problems.
The industry’s role in the economy 11
In this sense it is clearly production-enhancing (along the lines shown with the Millmapper example), and it should therefore not be controversial to claim a role for spatial information technology in generating economic growth benefits.
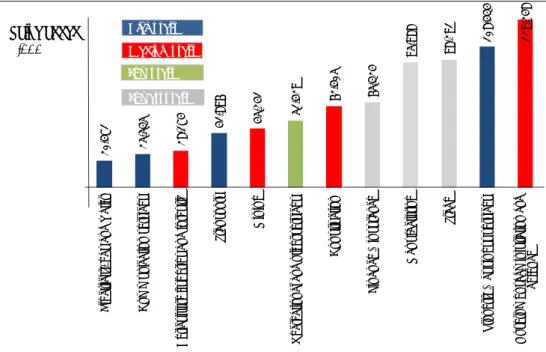
The impact of spatial information on the economy is also a function of the size of each industry and its level of use. Figure 1 shows the value added for
industry sectors by level of use of spatial information. High users include property and services, construction, mining, transport and agriculture. These areas are likely to be a major source of the national economic benefit from spatial information.
As spatial information penetrates other large sectors – such as retail and trade, recreation and other services and finance and insurance – further national gains might be expected.
Figure 1 Industry value-add and intensity of use of spatial information
20 ,4 71 25 ,535 28 ,174 41 ,8 96 45 ,241 51,42 9 62, 40 5 65 ,3 24 95, 98 8 98 ,2 91 108 ,4 34 129 ,2 48 Ele ct ric ity , g a s an d w at er C o m m u ni ca tion s e rv ic es A g ri cu ltu re f ish e ri es an d fo re st ry Tr an spor t M ini ng R e cr ea tion al an d ot h e r s e rv ic es C o ns tr uc tio n F ina nc e & in su ra n ce M anuf ac tu rin g Tr ad e P rope rt y & bu si n e ss ser vi ces G ov er n me n t a d mi n is tr at io n a n d de fe n ce Value added $'000 High users Medium users Low users Lowest users
Data source: ABS and ACIL Tasman
3.1.3 Spatial information and theories of economic growth
The idea that improvements in the production and use of spatial information will affect long term economic growth can also be firmly rooted in economic theory:
In the standard neoclassical models of economic growth based on the work of Robert Solow in the 1950s e.g., Solow 1956, 1957), the long run or stable equilibrium rate of growth