Methods
Volume 5 | Issue 1
Article 9
5-1-2006
Entropy Criterion In Logistic Regression And
Shapley Value Of Predictors
Stan Lipovetsky
GfK Custom Research North America, Minneapolis, MN, [email protected]
Follow this and additional works at:
http://digitalcommons.wayne.edu/jmasm
Part of the
Applied Statistics Commons
,
Social and Behavioral Sciences Commons
, and the
Statistical Theory Commons
This Regular Article is brought to you for free and open access by the Open Access Journals at DigitalCommons@WayneState. It has been accepted for inclusion in Journal of Modern Applied Statistical Methods by an authorized administrator of DigitalCommons@WayneState.
Recommended Citation
Lipovetsky, Stan (2006) "Entropy Criterion In Logistic Regression And Shapley Value Of Predictors,"Journal of Modern Applied Statistical Methods: Vol. 5: Iss. 1, Article 9.
95
Entropy Criterion In Logistic Regression And Shapley Value Of Predictors
Stan Lipovetsky
GfK Custom Research Inc.
Entropy criterion is used for constructing a binary response regression model with a logistic link. This approach yields a logistic model with coefficients proportional to the coefficients of linear regression. Based on this property, the Shapley value estimation of predictors’ contribution is applied for obtaining robust coefficients of the linear aggregate adjusted to the logistic model. This procedure produces a logistic regression with interpretable coefficients robust to multicollinearity. Numerical results demonstrate theoretical and practical advantages of the entropy-logistic regression.
Keywords: entropy, logistic regression, multicollinearity, net effects, Shapley value.
Introduction
Logistic regression is a widely used tool in regression modeling for a data with a binary output (Pregibon, 1981; Arminger et al., 1995; Long, 1997; Hastie & Tibshirani, 1997; McCullagh & Nelder, 1997; Lloyd, 1999; Lipovetsky & Conklin, 2000). The logistic model is usually obtained by the maximum likelihood criterion applied to the binary output with the logistic link. In this article, the criterion of entropy is applied for constructing a logistic model. Various techniques based on the entropy criterion are well known in information theory, fuzzy data analysis, and other statistical applications (Lindley, 1956; Zeimer & Tranter, 1976; Dukhovny, 2002; Levene & Loizou, 2003; Maes & Netocny, 2003; Handscombe & Patterson, 2004; Bar-Yam, 1997, 2004). The entropy-logistic model yields the coefficients and forecasts very similar to multiple linear regression. It opens a possibility to apply some techniques developed in linear regression to binary modeling, particularly, for estimation of
Stan Lipovetsky is an Analytical Services Manager for GfK Custom Research Inc. He serves as an internal and external consultant to GfK-CRI. His primary areas of research are multivariate statistics, multiple criteria decision making, econometrics, microeconomics, and marketing research.
the predictor’s contribution and construction of a model robust to the effects of multicollinearity. Contribution of the predictors in a linear aggregate can be found by the net effects technique. In linear regression analysis the net effect of a predictor is a combination of the direct (as measured by its coefficient squared) and the indirect effects (measured by the combination of its correlations with other variables). The sum of the net effects equals the coefficient of multiple determination of the model. However, the net effect values themselves can be subjected to the multicollinearity in the data so that the estimated net effects can be negative, which is difficult to interpret.
Even in presence of multicollinearity, it is often desirable to keep all variables in the model if their comparative importance is evaluated. A regression model can be considered from the perspective of a coalition among players (predictors) to maximize the total value (quality of fitting). In the cooperative games a useful decision tool developed to evaluate the worth of participants is the Shapley Value imputation (Shapley, 1953; Roth, 1988; Straffin, 1993; Jones, 2000). The Shapley Value (SV) presents each player's input over all possible combinations of players. This technique proved to be very useful in various complicated estimation problems (Conklin et al., 2004; Conklin & Lipovetsky, 2005). In application to statistical modeling, this approach yields a model called
Shapley Value regression (Lipovetsky & Conklin, 2001, 2004, 2005). In the current work, the SV approach to the logistic regression modeling is considered.
Entropy in Binary Response Modeling
Consider a data matrix with the elements xij of i-th observations (i=1, ..., N) by j-th
variables (j=0, 1, ..., n), and a dependent variable y of the observed event’s success or failure, presented by the binary output (yi equals
1 if the event occurs, and 0 if it does not). The logistic probability function can be presented as:
)
exp(
1
1
i iz
p
−
+
=
, (1) where z is a linear combination of the independent variables:
z
i=
a
0+
a
1x
i1+
a
2x
i2+
...
+
a
nx
in, (2) where the unknown parametersa
0,
a
1,
a
2,
...,
a
ncorrespond to the coefficients of the logistic regression model (1)-(2). Probability of the binary outcome is:
i yi i y i i p p P = (1− )1− . (3)
Maximum Likelihood objective is defined by the product of all probabilities (3):
∏
∏
= − =−
=
=
N i y i y i N i i i ip
p
P
ML
1 1 1)
1
(
, (4)or the logarithm of this ML is:
(
)
1 1 ln ln ln (1 ) ln(1 ) N i i N i i i i i ML P y p y p = = = = + − −∑
∑
. (5) Maximizing (5) by the parameters in (1)-(2)yields the procedure for constructing a regular logistic regression, as it is known by the literature on categorical data modeling.
Instead of the ML (4) it is possible to consider an objective of a Gibbs distribution:
∏
= −=
N i P i EntropyP
ie
1 , (6)so its logarithm that defines the entropy of the data:
∑
=−
=
≡
N i i iP
P
Entropy
E
1ln
, (7)where the binary probability outcome is defined in (3). The maximum entropy criterion (7) differs from the logarithm of maximum likelihood (5) by weighting the probabilities
P
iby their logarithms. The first-order conditions for maximizing the objective (7) by the parameters of the aggregate (2) yields a gradient vector with the elements:
( ) ln ln ln (1 ln ) 1 (1 ln ) 1 (1 ln ) (1 ) (1 ) (1 ln )( ) 0, k k i i i i i k k i i i i k i i i i i i i i k i i i i i i i i i i k i i i i ik i E U a P P P P a a P P P a y y p P P p p a y p z P P p p p p a P P y p x ∂ − ≡ ∂ ⎛ ∂ ∂ ⎞ = ⎜ + ⎟ ∂ ∂ ⎝ ⎠ ∂ = + ∂ ⎛ − ⎞ ∂ = + ⎜ − ⎟ − ∂ ⎝ ⎠ ⎛ − ⎞ ∂ = + ⎜ ⎟ − − ∂ ⎝ ⎠ = + − =
∑
∑
∑
∑
∑
(8) where the derivatives are sequentially taken from the functions (3), (1), and (2).To solve a non-linear system of equations the Newton-Raphson algorithm can be applied. The vector with elements (8) is approximated as:
(0) ( 1) ( ) 2 ( 1) ( ) ( ) ( ) ( ) ( ) 0 t t t t U U U a a a E E a a a a a + + ∂ = + − ∂ ∂ − ∂ − = + − ′ ′ ∂ ∂ ∂ = , (9) where a is a vector of the (n+1)-th order of all the coefficients ak (2), and t denotes a step of
iteration. The process of estimating the vector of parameters is: U H a a E a a E a at t (t) 1 1 2 ) ( ) 1 ( ( ) ( ) − − + = − ′ ∂ − ∂ ⎟⎟⎠ ⎞ ⎜⎜⎝ ⎛ ′ ∂ ∂ − ∂ − = , (10) where H is a matrix of second derivatives, or Hessian, and
H
−1 is this matrix inversed.Using (8), this matrix is constructed:
2 2 ( ) ln ln (2 ln )( ) (1 ln ) (2 ln ) ( ) (1 ) . (1 ) k jk j k j i i i i i i i ik i j j i i i i i i ij ik i i i U E H a a a P p P P y p P x a a P y p p p P x x p p ∂ ∂ − = = ∂ ∂ ∂
⎛
∂ ∂⎞
=⎜
⎜
+ − ∂ − + ∂⎟
⎟
⎝
⎠
⎧
+⎡
− − −⎤
⎫
⎪
⎣
⎦
⎪
=⎨
⎬
+ −⎪
⎪
⎩
⎭
∑
∑
(11) In the brackets at the right-hand side (11), the difference of the items (yi − pi)2 and)
1
(
ii
p
p
−
of two forms of the variance estimations is always small. The total of these items is negligible (Becker & Le Cun, 1988; Bender, 2000), so (11) can be presented as:(
)
(
1 2)
(1 ) (1 ) i i i i i y y i i H X diag P p p X X diag p p X X W X + − ′ = − ′ = − ′ ≡ , (12)where the diagonal matrix of weights W is defined using (1) and (3), and X is the data matrix in the aggregate (2) (with a uniform first column corresponded to the intercept). So (12) is a weighted matrix of the second moments of the predictors in the model (2).
The gradient vector (8) can be rewritten in a matrix form as:
U
=
X
′
diag
(
P
(
1
+
ln
P
)
)
(
y
−
p
)
, (13) where P, p, and y are the vectors with theelements Pi (3), pi (1), and the binary output yi,
respectively. Then the iterative process (10) is:
(
)
(
)
(
)
(
)
(
)
1 ( 1) ( ) ( ) 1 1 1 ( ) (1 ln ) ( ) (1 ln ) ( ) , t t t t a a X WX X diag P P y p Xa X WX X W diag W P P y p X WX X Wξ
− + − − − ′ ′ = − + −⎧
⎫
⎪
⎪
′ ′ =⎨
⎬
− + −⎪
⎪
⎩
⎭
′ ′ ≡ (14) whereξ
(t) is the so called working dependent variable that denotes the expression in figure parentheses (14). The right-hand side of the expression (14) presents the solution of the system (8) as a weighted linear regression with the adjusted response variable:
(
)
( ) ( ) 1 ( ) ( )(
)
(1 ln ) (
)
1 ln
(1
)
t t i i i i i i i t i t i i i iXa
diag W P
P
y
p
P
z
diag
p
p
ξ
ε
−=
−
+
−
⎛
+
⎞
=
−
⎜
⎟
−
⎝
⎠
, (15) wherez
(t)=
Xa
(t) is a vector of the linear aggregate (2),ε
(t)=
y
−
p
is a vector of deviations between the empirical binary response and the theoretical probability (1). The solution (14) corresponds to the normal system of equations of the weighted least square problem(
X
'
WX
)
a
=
X
′
W
ξ
with the adjusted dependent variable (15), so the process (14)-(15)is the Iteratively Reweighted Least Squares, or IRLS. Numerical simulations show that the weight matrix W in Hessian (12) quickly becomes approximately a scalar matrix, and the IRLS process converges already after several steps.
Consider numerical results from a real research project involving bank mortgages with the data elicited from 403 customers. The binary response defines the customers’ "Satisfied or not" feeling on the bank performance with a mortgage, and the independent variables from x1
to x8 are shown in Table 1. The management of
the bank is interested in estimating the predictors influence on increasing the client’s satisfaction with the bank. Table 1 presents the pair correlations of the dependent with independent variables, and the coefficients (beginning from
the intercept) with their t-statistics for the multiple linear, the regular logistic, and the entropy-logistic regressions. The entropy-logit model is constructed using the IRLS approach (14)-(15), and the t-statistics for the coefficients are estimated using bootstrapping.
Table 1 shows that the variables x2, x3,
x5, and also x7 are the most significant
predictors, while the other variables x1, x4, x6,
and x8 are unimportant in the models. In spite of
all positive pair correlations with the binary dependent variable, the coefficients of the least significant variables change their sign in the models (negative sign for x8 in the linear, for x1
in the logit, and for both of them in the entropy-logit model). It is the effect of multicollinearity that distorts the estimation by the models.
Table 1. Binary models of customer satisfaction.
Linear regression Regular Logistic Entropy Logistic
Variable Correlation coeff t-stat coeff t-stat coeff t-stat
Overall sat. w. mortgage loan y 1 -.919 -6.73 -10.841 -7.73 -1.600 -6.68
Satisfaction with rate x1 .347 .0002 0.01 -.026 -0.34 -.0002 -0.01
Right type of loan x2 .402 .038 3.11 .233 2.89 .043 2.35
Feel like a valued customer x3 .498 .049 3.43 .340 3.76 .055 2.91
Bank knows customers needs x4 .438 .007 0.57 .060 0.79 .007 0.36
Communication x5 .423 .026 2.61 .120 1.98 .031 1.95
Handling mortgage payment x6 .359 .023 1.13 .127 0.92 .027 0.89
Posting payments accurately x7 .352 .039 1.76 .396 2.34 .044 1.29
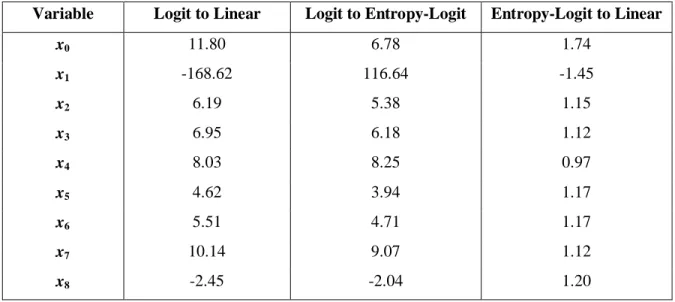
Table 2 contains the ratios of the coefficients of the regular logit to the linear model, of the regular logit to the entropy-logit model, and of the entropy-logit to the linear model, respectively. The coefficients themselves vary differently in each model, and the ratios of the regular logit coefficients to the coefficients of the other models belong to a wide span of values. However, the ratio of the coefficients of the entropy-logit to the linear model is amazingly stable.
The last column in Table 2 shows that with exception of the intercept (that incorporates the influence of all the predictors), and slightly different ratios for the most insignificant variables x1, x4, and x8, all absolute values of all
the ratios are practically the same.
Denoting the theoretical, predicted values of the output as
~
y
lin, ~ylog, and~
y
ent for the linear, logit, and entropy-logit models, respectively (where 0 and 1 values correspond to the rounded values of the probability below or above 0.5), and estimating the coefficient of pair correlation between the linear and entropy-logit predictions, it is possible to obtain a value of 0.9995, while the correlations between the predictions by the other models are about 0.94-0.95. Comparison of the models’ predictive ability is presented in Table 3 by several cross-sections.Section A of Table 3 presents the cross-tabulation of the empirical binary output y with the prediction
y
~
lin by the linear model, where 0 and 1 values are correctly identified 169 and 143 times, so the total of the correct forecasts is 312 within 403 observations, or 77.4%. The next section B in Table 3 shows the cross-tabulation of the empirical y with the prediction ~ylog by the regular logit model, where 0 and 1 outputs arecorrectly identified 173 and 138 times, with the total of correct forecasts equal 311, or 77.2%. Section C in this table presents the cross-tabulation of the empirical y with the prediction
ent
y
~
by the entropy-logit model, that correctly identifies 0 and 1 outputs 167 and 143 times, so the total rate of correct forecasts is 310, or 76.9%. It is interesting to note that both linear and entropy-logit models better identify the level y=1 of the satisfied customers. The other sections D, E, and F of Table 3 compare predictions by each two of the three constructed models, where again the linear and entropy-logit models yield very close counts of 204 and 195 for 0 and 1 binary outputs, so the total rate of the coinciding results equals 99%.The observed results are typical for various data sets. They show that all the considered models produce results of a similar quality. However, while a linear regression could yield an output beyond 0-1 interval in its prediction, both logistic regressions have the same link (1) with the linear aggregate of the predictors, so they always yield a probability in the 0-1 range. On the other hand, a close inspection of the results produced by the entropy-logit and linear models suggests a possibility to apply techniques developed for the linear models to a logistic model in its entropy-logit formulation. In the work (Lipovetsky and Conklin, 2001) the Shapley value regression was introduced for estimating the net effects of the predictors shares in the linear model. The proportionality between the coefficients of linear and entropy-logit models (see Table 2) suggests a possibility to extend the Shapley value net effects technique to the estimation of the contribution of the regressors into the linear aggregate (1) of the logistic link, and to adjust the coefficients of the logistic model using the obtained net effects.
Shapley Value Regression
A model of linear multiple regression can be presented as:
y
=
z
+
ε
=
X
b
+
ε
, (16)where z is a linear aggregate (2) by the parameters b of the linear model , and ε denotes a
vector of errors. The Least Squares (LS) objective for minimizing is:
2
(
) (
)
2
y
Xb
y
Xb
y y
b X y
b X Xb
ε
=
ε ε
′
′
=
−
−
′
′ ′
′ ′
=
−
+
. (17) Minimization of (17) by its parameters yields a normal system of equations with the solution: Table 2. Ratios of the models’ coefficients.Variable Logit to Linear Logit to Entropy-Logit Entropy-Logit to Linear
x0 11.80 6.78 1.74 x1 -168.62 116.64 -1.45 x2 6.19 5.38 1.15 x3 6.95 6.18 1.12 x4 8.03 8.25 0.97 x5 4.62 3.94 1.17 x6 5.51 4.71 1.17 x7 10.14 9.07 1.12 x8 -2.45 -2.04 1.20
Table 3. Predictive ability of binary models.
A 0 ~ = lin y 1 ~ = lin y B
0
~
log=
y
1
~
log=
y
C 0 ~ = ent y 1 ~ = ent y D 0 ~ = lin y 1 ~ = lin y E 0 ~ = ent y 1 ~ = ent y F 0 ~ = ent y 1 ~ = ent y0
=
y
169 530
=
y
173 490
=
y
167 550
~
log=
y
203 130
~
log=
y
201 15 0 ~ = lin y 204 31
=
y
38 1431
=
y
43 1381
=
y
38 1431
~
log=
y
4 1831
~
log=
y
4 183 1 ~ = lin y 1 195
b
=
(
X
'
X
)
−1X
'
y
. (18) Substituting (18) into (17) gives a value of LSobjective in minimum, or residual sum of squares
ε
ε
′ . The known LS relation y’y = z’z + ε’ε says that the original sum of squares of the dependent variable equals the theoretical sum of squares around the regression plus residual sum of squares. The coefficient of multiple determination for the regression is:
y
y
y
X
X
X
X
y
y
y
z
z
y
y
R
'
'
)
'
(
'
1
1 2 −=
′
′
=
′
′
−
=
ε
ε
(19)The minimum of the deviations (17) corresponds to the maximum regression quality estimated by R2 (19). In the standardized variables the coefficient of multiple determination can be represented in a convenient form:
r b b y X X X X y R = = ′ pair ≡
β
′ − ' ) ' ( ' 1 2 , (20) where b is the vector of multiple regressioncoefficients, and bpair is a vector compounded
from the coefficients of pairwise regressions of y by each x. The presentation R2 =β’r in (20) is given using a vector β of beta-coefficients of multiple regression (the coefficients of the standardized regression with all variables centered and normalized by their standard deviations), and vector r of pair correlations of y with each x (those correlations are equal to the coefficients in pair regressions by each predictor separately). Items of the scalar product at the right-hand side of total R2 (20) define the so called Net Effects (NEF) of each j-th regressor: NEFj = βj rj . (21)
The multiple determination and net effects are widely used in practice for estimation of the regressors’ contribution to the model.
Another measure of predictor comparative usefulness is utility Uj of each regressor that is
estimated via the increment of multiple each determination of the models with and without particular xj in the set of predictors(Darlington,
1968; Harris, 1975):
Uj = R 2
- R2-j (22)
Here R2 denotes multiple determination in the model with all predictors including xj, and R
2 -j
denotes multiple determination in the model without xj .
Consider the Shapley Value (SV) estimation of predictors’ shares. SV assigns a value for each predictor calculated over all possible combinations of predictors in the linear model, so it includes the competitive influence of any subsets of predictors in the analysis. The SV is defined as each j-th participant’s input to a coalition:
( )
M
[
(
M
{ }
j
)
( )
M
]
j
allM nSV
=
∑
γ
υ
∪
−
υ
(23)with weights of proportions to enter into a coalition M defined as
( )
!
/
)!
1
(
!
n
m
n
m
M
n=
−
−
γ
. (24)In (23)-(24) n is the total number of participants, m is the number of participants in the M-th coalition, and
υ
( )
is the characteristic function used for estimation of utility for each coalition. By M∪
{ }
j a set of participants which includes the j-th participant is denoted, when M means a coalition without the j-th participant. In regression, the participants of the coalition game are predictors incorporated into the model.As indicated above, the coefficient of multiple determination (20), net effects (21), and utility values (22) can be used as measures of quality in regression models. For ease of exposition, it is convenient to use notations A, B, C, etc., for variables x1, x2, x3, etc., so R
2
ABC , for
example, defines the multiple determination in the model with the corresponding predictors. The characteristic function
υ
(23) via these R2 values are estimated by the results of linear modeling. For instance, if n = 5, the characteristic function for variable A is:2 2 2
(0)
0,
( )
,
(
)
, ...,
(
)
A AB ABCDEA
R
AB
R
ABCDE
R
υ
υ
υ
υ
=
=
=
=
. (25) Substitution of characteristic function (25) into the SV (23) shows that each expression in brackets (23) coincides with the utility (22). So SVA is a measure of the predictor A usefulnessaveraged by all the models that contain this predictor. The weights (24) are:
( ) ( )
0
=
γ
4
=
0
.
20
,
γ
( ) ( )
1
=
γ
3
=
0
.
05
,
γ
( )
2
=
0
.
033
.
γ
(26) Then the SVA (23) for the variable A can be
written explicitly as:
( )
(
)
(
)
(
) (
)
.2
.05
.033
.05
.2
A A AB AC AD AE ABC ABD ABE ACD ACE ADE ABCD ABCE ACDE ABDE ABCDESV
U
U
U
U
U
U
U
U
U
U
U
U
U
U
U
U
=
+
+
+
+
+
+
+
+
+
+
+
+
+
+
+
(27) with the values of utility (22):UA = R2A , UAB = R 2 AB - R 2 B , ... , UABC = R 2 ABC - R 2 BC , ... , UABCD = R2ABCD - R2BCD , ... , UABCDE = R 2 ABCDE - R 2 BCDE . (28) The items in sum (27) correspond to the utility margins from the variable A to all coalitions, and the SVA is the mean margin over all coalitions.
Similar formulas are used for each of the other variables B, C, D, and E, and their SV define margins from each of the predictors. The total of margins from all the variables equals the value of R2 in the model with all the predictors together:
( )
ABCDE2.
n j jall
R
SV
=
=
∑
υ
(29)The SV are shares of total R2 defining importance of each predictor in their aggregate.
Regrouping items in (27) with help of (28) represents the SV as following:
(
)
(
)
(
)
(
)
2 2 1 2 2 * 2 2 2 ** 3 2 2 2 *...* 1 ... /( 1) /( 2) /( 3) /( ( 1)) / . A A A A A n AB Z R R n R R n R R n R R n n R nSV
− = − − + − − + − − + + − − − +…
(30) The first item in sum (30) presents a difference of2
A
R
for the model with one predictor A and mean valueR
12 (marked by bar over R2) for all the models with just one predictor (marked by sub-index 1). In the second item of this sum a difference between meanR
A2* for all the models with two predictors one of which is A (marked by sub-index A* with asterisk denoting any other variable x) and meanR
22 for all the models with any two predictors (marked by sub-index 2) is shown, etc.The last item presents a share that the predictor A has in the total R2 of the model with all predictors together. The important feature of the formula (30) is the presentation of sequential inputs of coalitions of the 1st, 2nd, etc. levels to the total SV. If the data is available only on the several initial stages of coalitions with one, two, and some other subsets of variables, it is possible to use (30) for approximation of the partial inputs to the total SV. Comparison of such cumulative values for each variable allows one to evaluate the stability of the SV imputation. This suggests an approach for reducing the computation time of the SV by limiting evaluation to the number of levels where stability is achieved. Each term in (30) is constructed via mean values of combinations with a predictor and without it, so these means can be estimated by sampling combinations.
The expression (29) presents the estimations of the net effects (20)-(21) obtained via the SV approach. So in place of the regular
net effects one can use decomposition of the multiple determination by the SV net effects: R2 = ∑j SVj . (31)
Each item in (31) is a very robust estimate of the net effect because SV is an average across all possible models with different subsets of predictors. These values are not as volatile as the regular net effects, and they are not prone to multicollinearity. In difference to regular net effects (21), the SV net effects (31) are always positive, so they are interpretable and suggest an easy way for graphical (pie-charts) presentation of predictors’ shares in their contribution to the linear aggregate of the model.
When the SV net effects are found, they can be used for adjusting the coefficients in the linear aggregate, that can be performed by the following procedure. The objective of multiple determination can be presented using (17) and (19) as: 2
1
1 (
) (
)
2
(2
)
R
y
X
y
X
X y
X X
r
S
ε ε
β
β
β
β
β
β
β
′
= −
′
= −
−
−
′ ′
′ ′
=
−
′
=
−
, (32) where the standardized beta-coefficients are used, and S denotes a matrix of predictors’ correlations. Equalizing items in sums (31) and (32) yields a system of quadratic equations that can be used for finding the coefficients of regression adjusted by the SV net effects:
β
j(2r−Sβ
)j =SVj , j=1,...,n. (33) Solution of the system (33) can be achieved by minimizing the objective:(
)
∑
=−
−
=
n j j j jr
S
SV
F
1 2)
2
(
β
β
. (34) Initial value for the parameters in minimization(34) can be taken as
β
j =SV /j rj obtained from(21) where the SV net effects are used. Having the adjusted beta-coefficients of the standardized
regression, one returns to the coefficients of the original regression (16) by the regular transformation bj =
β
jσ
y/σ
j, whereσ
y andj
σ
are the standard deviations of the dependent and the independent variables.Using the obtained coefficients b of the adjusted SV regression (34) and the property of approximate proportion between the coefficients of the entropy-logit and linear models (see Table 2), it is possible to use a proportionality:
aj =kbj , j=1,...,n, (35)
with a constant k between the coefficients aj of the logistic model and the SV regression coefficients bj for all the predictors. Then, the logistic aggregate (2) can be presented as a linear transformation
zi =q+ky~linSV (36) of the vector ~ylinSV of theoretical estimation of the
dependent variable by the adjusted SV model (34), with q and k as unknown parameters. The parameters of the transformation (36) can be found by a simple logistic model with only one variable ~ylinSV:
(
(
~
)
)
exp
1
1
SV liny
k
q
p
+
−
+
=
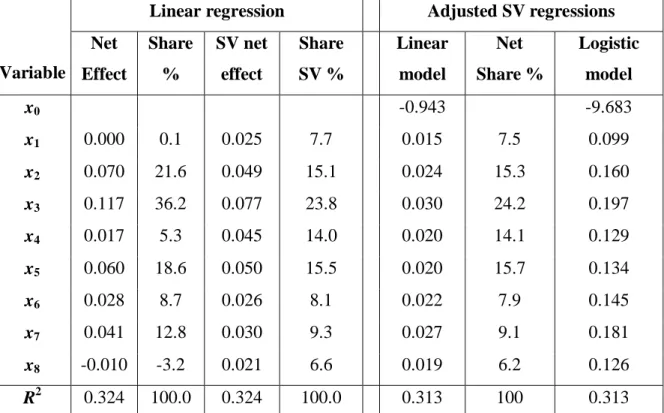
, (37)using the original data on the binary output. Table 4 in its left-hand side presents some additional estimates for the linear regression – there are columns of the net effects (21), their shares in the total coefficient of multiple determination (20), the SV net effects (31), and their shares in the same R2. The last predictor in the linear regression has negative sign in the model (see Table 1), and its net effect is negative in Table 4. Estimated by SV, the net effects are all positive, so all the predictors contribute to the model, as it should be expected because any additional variable increases the quality of data fitting. Shares of the SV net effects are rather substantial even for the
variables x1, x4, x6, and x8 (considered as
unimportant by the previous model – see the discussion by Table 1).
The right-hand section of Table 4 presents the results of the adjusted SV regressions. Procedure (34) yields the adjusted SV regression with all positive predictor coefficients, positive net effects, and R2 =0.313 that is slightly less than R2 =0.324 of the regular regression – this is a price of the trade-off for the adjusted model with interpretable coefficients and positive net effects. Although the coefficients of
the regular and adjusted linear regressions are rather different, the SV net effect shares by the regular linear and the adjusted linear models are very similar. They can be used as the estimates of the variables role in increasing the clients’ satisfaction with the bank’s mortgage products.
The last column in Table 4 presents the logistic model constructed by the procedure (35)-(37). At first a vector 8 2 1 .024 ... .019 015 . ~ x x x ylinSV = + + + of the
aggregate with the coefficients of the adjusted
Table 4. Net Effects, Shapley Value, Adjusted SV Linear and Logistic Models.
Linear regression
Adjusted SV regressions
Variable
Net
Effect
Share
%
SV net
effect
Share
SV %
Linear
model
Net
Share %
Logistic
model
x
0-0.943 -9.683
x
10.000 0.1 0.025 7.7
0.015 7.5 0.099
x
20.070 21.6 0.049 15.1
0.024 15.3 0.160
x
30.117 36.2 0.077 23.8
0.030 24.2 0.197
x
40.017 5.3 0.045 14.0
0.020 14.1 0.129
x
50.060 18.6 0.050 15.5
0.020 15.7 0.134
x
60.028 8.7 0.026 8.1
0.022 7.9 0.145
x
70.041 12.8 0.030
9.3
0.027 9.1 0.181
x
8-0.010 -3.2 0.021
6.6
0.019 6.2 0.126
R
20.324 100.0 0.324 100.0
0.313 100 0.313
SV linear model is constructed. Then the parameters of the logistic model (37) are estimated as q = -9.683 and k = 6.617, and by (35) the coefficients of the adjusted SV logistic model are obtained (the last column in Table 4). In this model all the coefficients are positive, and the shares of the predictor contributions coincide with the net effect shares (Table 4, the column before the last one) because the proportionality of the coefficients (35) does not change the shares of the net effect (20)-(21).
The predictive ability of the SV logistic model in comparison with several others is presented in Table 5. There are cross-sections of the binary output y~logSV of the SV logistic model with the empirical outcome y, and with the predictions
~
y
lin, ~ylog, andy
ent~
by the linear, regular logit, and entropy-logit models, respectively.Section A of Table 5 shows that the SV logistic correctly predicts (169+135)/403 or 75.4% of the original binary data. By Table 3, the rate of the correct identifications by the models with the coefficients non-adjusted to multicollinearity was about 77%. The next cross-sections in Table 5 show that the SV logit predictions coincides with the other models’ predictions at the total rate of 95%. Thus, the adjusted SV logit model has both high predictive rate and interpretable coefficients of the model.
So the management of the bank can elaborate an appropriate program for improving the clients service based on the results of the adjusted SV logistic model.
Conclusion
The entropy criterion applied to the binary response data with the logistic link yields a logistic model with the coefficients proportional to the linear regression, and with the predictive ability similar to both linear and regular logistic models. Using the properties of the entropy-logistic regression, the Shapley value net effects are applied for estimating the contributions of the predictors in the logistic model, and for adjusting the coefficient of regression itself. The Shapley value logistic regression is robust, has interpretable coefficients, and demonstrates a high rate of predictive ability. The partnership of the entropy-logistic approach and the Shapley value binary response regressions can enrich theoretical possibilities and serve as a useful tool for categorical data modeling in practical applications.
References
Arminger G., Clogg C. C., & Sobel M. E. (Eds). (1995). Handbook of Statistical Modeling for the Social and Behavioral Sciences, Plenum Press, New York, London. Table 5. Predictive ability of the SV logistic model.
A
B
C
D
0
=
y
1
=
y
0 ~ = lin y 1 ~ = lin y0
~
log=
y
1
~
log=
y
0 ~ = ent y 1 ~ = ent y0
~
log=
SVy
169
46
201
14
204
11
200
15
1
~
log=
SVy
53
135
6
182
12
176
5
183
Bar-Yam Y. (1997). Dynamics of complex systems. Reading, M.A.: Addison-Wesley.
Bar-Yam Y. (2004). Multiscale complexity/entropy. Advances in Complex Systems, 7, 47-63.
Becker, S. & Le Cun, Y. (1988). Improving the convergence of back-propagation learning with second order methods. In Touretzky D.S., Hinton G.E. and Sejnowski T.J. (Eds.), Proceedings of the 1988 Connectionist Models Summer School, Morgan Kaufmann, San Mateo, CA, 29-37.
Bender, E. A. (2000). Mathematical methods in artificial intelligence. Los Alamitos, C.A.: IEEE Computer Society Press.
Conklin, M., Powaga, K., & Lipovetsky, S. (2004). Customer satisfaction analysis: Identification of key drivers, European Journal of Operational Research, 154, 819-827.
Conklin, M. & Lipovetsky, S. (2005). Marketing decision analysis by TURF and shapley value. Information Technology and Decision Making, 4, 5-19.
Darlington, R. (1968). Multiple regression in psychological research and practice. Psychological Bulletin, 79, 161-182.
Dukhovny, A. (2002). General entropy of general measures. International Journal of Uncertainty, Fuzziness, and Knowledge-Based Systems, 10, 213-225.
Handscombe, R. D. & Patterson, E. A. (2004). The entropy vector: Connecting science and business. Sheffield, U.K.: World Scientific Publishing.
Harris, R. (1975). A primer of multivariate statistics. New York, N.Y.: Academic Press.
Hastie, T. J. & Tibshirani, R. J. (1997). Generalized additive models. London: Chapman and Hall.
Jones, A. J. (2000). Game theory: Mathematical models of conflict. Chichester: Horwood Publishing.
Levene, M. & Loizou, G. (2003). Computing the entropy of user navigation in the web. International Journal of Information Technology and Decision Making, 2, 459-476.
Lindley, D. (1956). On a measure of the information provided by an experiment, Annals of Mathematics and Statistics, 27, 986-1005.
Lipovetsky, S. & Conklin, M. (2000). Box-Cox generalization of logistic and algebraic binary response models. International Journal of Operations and Quantitative Management, 6, 276-285.
Lipovetsky, S. & Conklin, M. (2001). Analysis of regression in game theory approach. Applied Stochastic Models in Business and Industry, 17, 319-330.
Lipovetsky, S. & Conklin, M. (2004). Decision making by variable contribution in discriminant, logit, and regression analyses. Information Technology and Decision Making, 3, 265-279.
Lipovetsky, S. & Conklin, M. (2005). Incremental net effects in multiple regression. International Journal of Mathematical Education in Science and Technology, 36, 361-373.
Lloyd, C. J. (1999). Statistical analysis of categorical data. New York, N.Y.: Wiley.
Long, J. S. (1997). Regression models for categorical and limited dependent variables. London: Sage Publication.
Maes, C. & Netocny, K. (2003). Time reversal and entropy. Journal of Statistical Physics, 110, 269-310.
McCullagh, P. & Nelder, J. A. (1997). Generalized linear models. London: Chapman and Hall.
Pregibon, D. (1981). Logistic regression diagnostics. The Annals of Statistics, 9, 705-724.
Roth, A. E., (Ed.). (1988) The Shapley Value - Essays in Honor of Lloyd S. Shapley. Cambridge University Press, Cambridge.
Shapley, L. S. (1953). A value for n-person games. In Kuhn H. W., Tucker A. W. (Eds.) Contribution to the Theory of Games, II, Princeton University Press, Princeton, NJ, 307-317.
Straffin, P. D. (1993). Game theory and strategy. The Mathematical Association of America.
Zeimer, R. E. & Tranter, W. H. (1976). Systems, modulation, and noise. Boston: Houghton-Mifflin.