Contents lists available atSciVerse ScienceDirect
Computers and Mathematics with Applications
journal homepage:www.elsevier.com/locate/camwaDetection of DDoS attacks using optimized traffic matrix
Sang Min Lee
a, Dong Seong Kim
b,c,∗, Je Hak Lee
a, Jong Sou Park
aaDepartment of Computer Eng., Korea Aerospace University, Seoul, Republic of Korea bDepartment of Electrical and Computer Eng., Duke University, Durham, NC, USA
cDepartment of Computer Science and Software Eng., University of Canterbury, New Zealand
a r t i c l e i n f o Keywords: DDoS attacks Genetic algorithm Intrusion detection Traffic matrix
a b s t r a c t
Distributed Denial of Service (DDoS) attacks have been increasing with the growth of computer and network infrastructures in Ubiquitous computing. DDoS attacks generating mass traffic deplete network bandwidth and/or system resources. It is therefore significant to detect DDoS attacks in their early stage. Our previous approach used a traffic matrix to detect DDoS attacks quickly and accurately. However, it could not find out to tune up parameters of the traffic matrix including (i) size of traffic matrix, (ii) time based window size, and (iii) a threshold value of variance from packets information with respect to various monitored environments and DDoS attacks. Moreover, the time based window size led to computational overheads when DDoS attacks did not occur. To cope with it, we propose an enhanced DDoS attacks detection approach by optimizing the parameters of the traffic matrix using a Genetic Algorithm (GA) to maximize the detection rates. Furthermore, we improve the traffic matrix building operation by (i) reforming the hash function to decrease hash collisions and (ii) replacing the time based window size with a packet based window size to reduce the computational overheads. We perform experiments with DARPA 2000 LLDOS 1.0, LBL-PKT-4 of Lawrence Berkeley Laboratory and generated attack datasets. The experimental results show the feasibility of our approach in terms of detection accuracy and speed.
©2011 Elsevier Ltd. All rights reserved.
1. Introduction
In recent years, communication between mobile computing devices has become more common because of a rapid development of mobile computing devices, the performance improvement of communication devices, and a drop in their prices. In addition, microelectronic devices, such as a Radio Frequency IDentification (RFID) system, and Wireless Sensor Networks (WSNs) have been interconnected through the network. This Ubiquitous and Pervasive computing, which is considered as an Information Technology (IT) to fuse real physical space and cyber space, has improved human life. However, the mobile computing devices which are important components in Ubiquitous and Pervasive computing environments have been exposed in many kinds of security threats. Especially, Distributed Denial of Service (DDoS) attacks have emerged as one of the most serious threats among others [1,2]. The intensity of DDoS attacks has become stronger through the development of network infrastructure. Basically, DDoS attacks are launched by generating an extremely large volume of traffic and they rapidly exhaust resources of target systems, such as network bandwidth and computing power. Defense mechanisms against DDoS attacks to cope with them can be classified into four categories: prevention, detection, mitigation and response [3].
∗Corresponding author at: Department of Computer Science and Software Engineering, University of Canterbury, Christchurch, New Zealand. Tel.: +64 3 364 2362x7757; fax: +64 3 364 2569.
E-mail address:[email protected](D.S. Kim). 0898-1221/$ – see front matter©2011 Elsevier Ltd. All rights reserved. doi:10.1016/j.camwa.2011.08.020
When DDoS attacks occur, the first step to thwart DDoS attacks is detection and it should be done as quickly as possible. However, it is difficult to distinguish between a DDoS attacks and normal traffic, since DDoS attacks often do not contain malicious contents in the packets. Moreover, attackers forge their source addresses to conceal their locations to make DDoS attacks more sophisticated [4]. DDoS attack detection schemes should guarantee both short detection delay and high detection rates with low false positives. Computational overheads should be also considered because a detection engine (or module) has to deal with a large volume of real-time network traffics.
Detection mechanisms can mainly be divided into two categories; the first type is to use misuse detection relying on predefined DDoS attack patterns (or signatures). There are several well-known solutions, such as NetRanger [5], NID [6], SecureNet PRO [7], RealSecure [8], NFR-NID [9] and Snort [10–12]. However, pattern based detection mechanisms are hard to detect new intrusions. The second type is to use anomaly detection which focuses on comparing the normal behavior of the system with abnormal behaviors. Thus, anomaly detection schemes may be more effective to detect unknown intrusions. Some previous approaches on anomaly detection rely on monitoring IP (internet protocol) attributes of incoming packets. Peng et al. [13] proposed a simple detection scheme using arrival rates of new source IP addresses but it takes at least 10 seconds, which is not an appropriate detection delay. Feinstein et al. [14] presented an entropy based statistical detection model that is computed on selected IP attributes of some consecutive packets. However, they did not perform any parameters optimization for their detection model so that they could not provide the optimal window size. In addition, Kim et al. [15] collected a baseline profile on various attribute combinations but the combined attributes increased computational overheads. Our previous work [16] proposed a traffic matrix to detect DDoS attacks quickly and accurately. However, it could not find out to tune up parameters of the traffic matrix and time based window size, leading to computational overheads when DDoS attacks did not occur. Moreover, the proposed hash function creates many hash collisions.
In this paper, we propose an enhanced DDoS detection model using a revised traffic matrix from our previous work [16]. The traffic matrix is built up with packet based window size to reduce the computational overheads and a reformed hash function to reduce hash collisions. It makes our proposed model effective in terms of processing overheads and detection delay. Therefore, our proposed approach can be used to detect DDoS attacks at the early stage in real-time. Furthermore, we use a Genetic Algorithm (GA) for optimization of parameters used in the traffic matrix. The GA is a well-known heuristic approach to figure out an optimal value in large search space. To maximize detection rates, we optimize three parameters in our detection model; (i) size of traffic matrix, (ii) packet based window size, and (iii) threshold value of variance from
packet information. Then, we carry out experiments on not only a LBL-PKT-4 [17] dataset but also a DARPA 2000 LLDOS
1.0 [18] dataset and an attack traffic dataset that we created. The experimental results show the feasibility of our proposed approach. A preliminary version of this paper appeared in [19].
The rest of this paper is organized as follows. In Section2, related work is presented briefly. Our proposed detection model is presented in Section3. In Section4, the experiments and analysis are described. Finally, we conclude this paper in Section5.
2. Related work
Anomaly detection schemes can mainly be divided into the following technical categories; rate limiting, data mining, and statistical analysis techniques. At first, rate limiting techniques detect anomalous connection behavior based on the premise that an infected host will try to connect to many different machines in a short period of time. It detects portscans by putting new connections exceeding a certain threshold in a queue. An alarm is raised when the queue length exceeds a threshold. The rate limiting techniques are easy to understand and implement as well. However, they are too simple to detect sophisticated intrusions and it is hard to set up proper threshold values. Next, data mining techniques are used to build a detection model (classifier) that can discover profile of network features. Lee and Stolfo [20] built a classification model to detect anomalies. They achieved a reasonable success in terms of classifying normal and intrusion data and reduced misclassification rates by using additional statistical features. A meta-detection model [21] was proposed to improve their previous approach. It used combined multiple detection models to increase detection accuracy but multiple models definitely made computation more complex. Finally, many detection techniques have been proposed in a statistical analysis field. Several statistical analysis based detection models, in particular those relying on
monitoring IP attributes of arrival packets were proposed. Talpade et al. [22] proposed NOMAD which is a scalable and
passive network monitoring system. It can detect attacks by analyzing IP packet header information such as a time to live (TTL) field, packet delay variation and traffic flow. It does not support creating the classifier for high-bandwidth
traffic that is aggregated from distributed sources [3]. Peng et al. [13] proposed a simple detection scheme called
Source IP address Monitoring (SIM) to detect high bandwidth attacks. The model monitors arrival rates of new source
IP addresses and detects changes of them using a non-parametric Cumulative Sum (CUSUM) algorithm [23,24] which
is more suitable for analyzing a complex network environment than a parametric algorithm. Their approach showed
high detection accuracy with low computational overheads. Attacks including subnet spoofed IP addresses [3,25] can
be also detected by this model. But their experimental results showed that the detection delay was between 10 and 127.3 seconds which is not satisfactory in terms of the detection delay for a real-time detection system. Feinstein et al. [14] proposed a statistical detection model to identify DDoS attacks by computing entropy and frequency-sorted distributions of specific IP attributes. The entropy could be calculated through a number of consecutive packets called a sliding window
Table 1
Notation table for symbols.
Symbols Description
T Threshold value
Pc Crossover probability
Pm Mutation probability
xj Thejth parameter of parameters (x1,x2,x3, . . . ,xn)
x(jL) Lower bound ofxj
x(jU) Upper bound ofxj
lj The least binary string length ofxj
H(x) Hash function of traffic matrix
t Time
n Matrix size
i Row of traffic matrix
j Column of traffic matrix
V Variance
M Traffic matrix
K The number of non-zero elements inM M(i,j) An element which has(i,j)index ofM
validate it in various network traces. However, the size of a sliding window, a tunable parameter was not optimized. They set it from their experiential knowledge. Moreover, they were not concerned about subnet spoofed attacks in the experiments.
The aforementioned approaches do not satisfy several major requirements which should be achieved in DDoS detection approaches such as low processing overheads, a short detection delay and high detection rates. Our model can be operated in a real-time network environment because of an optimized traffic matrix, which is constructed by a lightweight hash function. Also, a packet based variable time window enables our model to detect DDoS attacks within a very short period of time. The parameters for detection are optimized by GA and it guarantees very high detection rates. In addition, our proposed model can detect DDoS attacks including subnet spoofed and relatively low bandwidth attacks. The details of our proposed detection model are presented in the next section.
3. Proposed detection model 3.1. Preliminaries
The symbols and their description in the paper are summarized inTable 1. 3.2. Overall flow of the proposed model
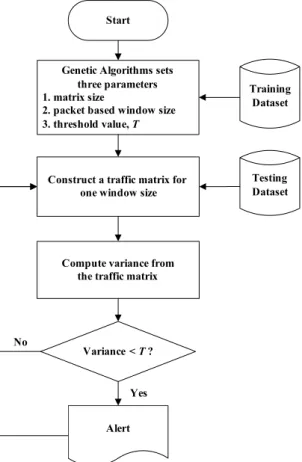
Fig. 1shows the overall flow of our proposed detection model. Our model consists of three main steps: (1) parameters optimization using GA, (2) traffic matrix construction, and (3) calculation of variance. In the first step, GA optimizes three detection parameters with a training dataset. The detection parameters consist of matrix size, packet based window size,
and threshold value,T. When these parameters are optimized, our proposed detection model becomes suitable for the
corresponding network environments and obtains maximum detection rates. In the second step, we build up the traffic matrix by extracting source IP addresses from an inbound traffic stream and locate packets to the traffic matrix using a reformed hash function. In this paper, we use packet based window size instead of time based window size to reduce computational overheads and a new hash function to avoid hash collisions. The size of the traffic matrix and the number of packets for one traffic matrix are set by the GA in the previous step. In the final step, variance is computed from the traffic matrix. The variance of DDoS attacks is low because of dispersibility of DDoS attacks but normal traffic has a high variance. Then, we can decide whether inbound traffic is an attack or normal through comparing the computed variance and a threshold value set by the GA. Finally, our proposed detection model generates alerts when DDoS attacks are detected. Otherwise, the second and third steps are iterated continuously. Details of each step are presented in the following subsections.
3.3. Parameters optimization using the Genetic Algorithm (GA)
It is necessary to figure out optimal values of three detection parameters to maximize detection rates, since victims have different network environments. These parameters consist of traffic matrix size, the number of packets for a time window, and a threshold value of variance which makes a decision whether the state of the network is normal or under DDoS attacks. However, it is difficult to optimize these parameters because they have wide ranges. The GA is a heuristic approach for figuring out an optimal value, i.e. a suitable solution of the problem which has a large searching space. Therefore, we can achieve maximum detection rates by optimizing parameters for the corresponding network environments through the GA.
Fig. 1. Overall flow of our proposed model.
Table 2
Properties of detection parameters.
Parameters Range (closed interval) Degree of precision Length of binary strings Size of matrix (length of row and column) [1, 512] 100 9 bit
The number of packets for a time window [1, 1024] 100 10 bit
Threshold value (T) [0.1, 2048.0] 10−1 14 bit
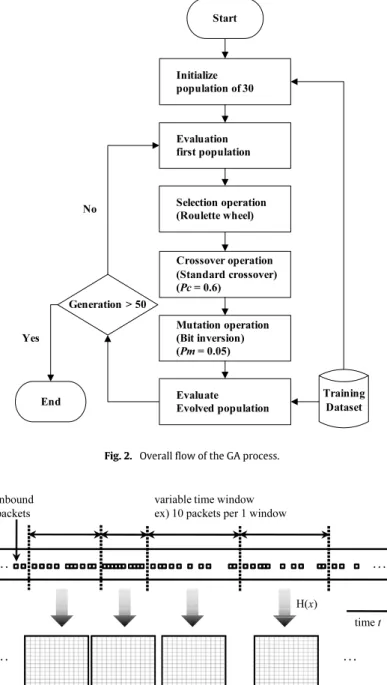
The GA is mainly composed of selection, reproduction, and evaluation operations. Repeating these main operations leads to the evolution. An overall flow of the GA is shown inFig. 2. We set the pool for initial population to 30. Fitness of a chromosome is proportional to its detection rates. The selection operation elects a new group for the next generation. In our detection model, we use a roulette wheel selection for the selection operation which is commonly used in the GA. It gives candidates a chance to be selected for the next generation’s parent according to their fitness (i.e., detection rates). The candidate of which fitness is high has a high probability of being selected.
After the selection operation, the GA processes a reproduction operation composed of crossover and mutation. In our detection model, we use one-point crossover operation and set a crossover probability
(
Pc)
for 0.6. Bit inversion is used forour mutation operation. The mutation operation helps the solution not to converge toward local optima. We set a mutation probability
(
Pm)
for 0.05. These values(
Pc,
Pm)
should also be set properly through experiential experiments. Otherwise,it may take very long time to get an optimal solution or the local optima problem may be occurring. We adopted ordinary values of probabilities for our reproduction parameters. Finally, the fitness function evaluates chromosomes with training data. The above main operations are performed repeatedly until 50 generations if it does not satisfy the threshold value of the fitness function (e.g., detection rates value).Table 2shows detailed properties of our detection parameters value. In the GA, the solutions which are detection parameters are represented in binary as strings of 0s and 1s. The string lengths of each parameter are computed by Eq.(1)according to parameter range and a degree of precision. In other words, the binary string length of parameterxjcould be determined by Eq.(1)which has a closed interval [x(jL)
,
x(U)
j ] and a degree of precision 10 d.
The length will be a smallest integer number which is greater than or equal tolj. Consequently, our chromosome has 33 bit
length of binary strings. lj
≥
log2[
(
x( U) j−
x( L) j)
10 d+
1]
.
(1)Fig. 2. Overall flow of the GA process.
Fig. 3. Constructing traffic matrices based on variable time window.
3.4. Constructing a traffic matrix
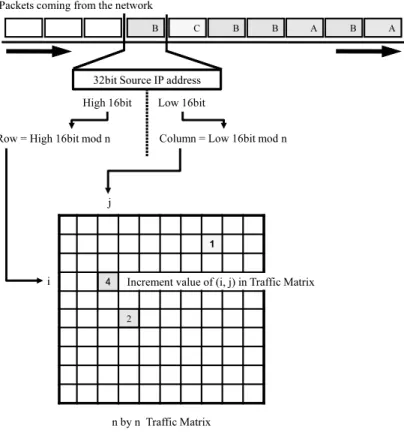
A traffic matrix is built by capturing inbound traffic stream as shown inFig. 3. The time window is a period of time to make one traffic matrix. Our previous approach [16] used a time based window size and it led to computational overheads when DDoS attacks did not occur. Thus, we replace time based window size with packets based window size in this paper. In other words, the length of each time window depends on amounts of the traffic stream. When a large volume of traffic streams comes into the victim’s network, the time window becomes short and vice versa. The time window can be a variable according to the network size/condition. All packets coming into the victim’s network during one time window are mapped into the traffic matrix by a hash function using source IP addresses of the packets. The hash function produces coordinates for incoming packets to locate them in the traffic matrix. The flow of construction of a traffic matrix is shown inFig. 4. The IPv4 address domain is too large to map all IP addresses to the traffic matrix. Since our detection model must run in a real-time environment, the traffic matrix has to have a reasonable size to construct it fast enough and to cover as many as
Fig. 4. Constructing a traffic matrix using the hash function.
incoming packets. We use a hash function to reduce the scale of the traffic matrix even though hash collision sometimes can happen. In other words, different IP addresses are located in the same coordinate since their results of the hash function are same. However, the collision problem is negligible because our model restricts the number of packets for one traffic matrix.
The IPv4 address format consists of four octets. In our previous work [16], we used a value of the first (third) octet multiplied by second (fourth) octet to calculate index
(
i,
j)
. It causes more hash collisions than using the octets directly. So, we use a revised hash function as follows:i
=
high16 bit of IP modnj
=
low16 bit of IP modn.
(2)Eq.(2)shows that the hash function divides a 32 bit source IP address into high and low 16 bit addresses; the first two octets and last two octets. Modular operation is applied to each 16 bit address to compute an index of a packet. The high 16 bit address is divided by the row size of the traffic matrix and the remainder
(
i)
is used as an index of the row. The low 16 bit address is divided by the column size of the traffic matrix and the remainder(
j)
is used as an index of the column. The value of a corresponding element on the index(
i,
j)
is increased by 1. If there is no hash collision, it will indicate thenumber of incoming packets which have the same IP address during a time window as shown inFig. 4.
3.5. Variance computation
We use a variance which indicates a dispersion of the incoming traffic. The variance of DDoS attack traffic which comes from various sources (or forges its source IP address by using random generator) is much lower than that of normal traffic since the packets which have randomly generated source IP addresses are spread out to the traffic matrix uniformly. The variance
(
V)
of a traffic matrix is given by Eq.(3).V
=
1 k n−
j=0 n−
i=0(
M(i,j)−
µ)
2,
ifM(i,j)̸=
0 where, µ
=
1 k n−
j=0 n−
i=0(
M(i,j))
2,
ifM(i,j)̸=
0 (3)M(i,j)presents an element which has
(
i,
j)
index of the traffic matrix(
M)
. Thekdenotes the number of non-zero elementsTable 3
Datasets for experiments.
Dataset IP spoofing Duration (s) The number of compromised hosts Average pps
LBL-PKT-4 [17] N/A 360 N/A 250
DARPA 2000 LLDOS 1.0 [18] 32 bit 6 Unknown 5500
Generated attack 16 bit subnet 6 220 5500 16 bit subnet 120 10 250 16 bit subnet 120 20 500 16 bit subnet 120 40 1000 16 bit subnet 120 80 2000 Table 4 Optimization results.
Dataset Matrix size The number of packets for a window
Threshold value(T) Detection rates
Detection delay (s)
DARPA 2000 LLDOS 1.0+LBL-PKT-4 86 by 86 795 173.60 1.0 0.13
Generated attack+LBL-PKT-4 285 by 285 626 27.23 1.0 0.05
4. Experiments and analysis 4.1. Experimental datasets
We used three datasets in our experiments; LBL-PKT-4 [17], DARPA 2000 LLDOS 1.0 [18], and our own generated DDoS
attacks datasets. Their properties, such as IP spoofing, duration, the number of compromised hosts, and packets per second (pps) on average, are summarized inTable 3. The LBL-PKT-4 dataset of Lawrence Berkeley Laboratory was used to represent normal traffic data. We extracted the first 6 min trace from the LBL-PKT-4 dataset for our experiments. The trace is provided with sanitized source IP addresses due to a privacy problem. It means that the IP addresses have been renumbered as a positive integer. We converted these sanitized source IP addresses to IPv4 format, since our proposed model needs IPv4 format as source IP addresses to construct a traffic matrix. The DARPA 2000 LLDOS 1.0 dataset was used as attack traffic data. The DARPA 2000 LLDOS 1.0 dataset is a DDoS attack scenario which has been carried out over multiple networks and audit sessions. These sessions consist of 5 phases. We employed only the fifth phase traffic because it contains flood attack traffics with 6 s duration among the five phases. Therefore, the rest of the phases, the first to fourth phases, were not used in our experiments.
We generated five attack datasets which contain 16 bit subnet spoofed flood attack traffics. One dataset of them, which includes attack traffic of 5500 pps, was used to compare with the DARPA 2000 LLDOS 1.0 dataset. The rest of the generated attack datasets which have 120 durations were used for validating our detection model according to average pps of attacks.
We combined the LBL-PKT-4 [17] normal dataset with the DARPA 2000 LLDOS 1.0 [18] attack dataset and each generated
attack dataset together. From the three datasets, we used six combined datasets in our experiments. 4.2. Experiments for subnet IP spoofed DDoS attack detection
We carried out experiments on the DARPA 2000 LLDOS 1.0 [18] dataset and one of generated attack datasets. Both
datasets have almost the same volume of attack traffics around 5500 pps. Durations are also the same as 6 s. The only different property is the range of IP spoofing: in the DARPA 2000 LLDOS 1.0 dataset, the entire fields of source IP addresses were generated randomly while our generated dataset contains packets with a 16 bit subnet spoofed source IP address. Most flood traffic of the DARPA 2000 LLDOS 1.0 dataset can be filtered by ingress/egress filtering techniques [20] which are widely deployed. The flood traffic of the DARPA 2000 LLDOS 1.0 dataset is ideal but not realistic. Therefore, we evaluated our detection model by comparing results of two datasets. We used GA to optimize parameters for each dataset andTable 4
shows the experimental results.
The optimized parameters may provide high detection rates and short detection delay.Fig. 5(a) and (b) show the changes of a variance on each dataset. InFig. 5(a) and (b), each point indicates the value of a variance derived from a completed traffic matrix. When attack traffic comes between 30 and 36 s, the variance becomes lower than the threshold value,Twhich means that an attack is detected. Another marked difference during the attack phase is an interval between derived variances which represents an updating speed. These experimental results show that our proposed detection model can response to DDoS attacks almost immediately with high accuracy regardless of subnet spoofing techniques.
Furthermore, we carried out several experiments by changing the volume of attack traffics and verified our detection model by using 5-fold cross validation. We used four datasets which contain both LBL-PKT-4 [17] dataset as a normal traffic and flood attack traffic of 250 pps, 500 pps, 1000 pps, and 2000 pps respectively. The LBL-PKT-4 dataset has around 250 pps volume of traffic. Hence, the first dataset consists of the same volume of normal and attack traffic. The attack traffic of the last dataset is eight times more than the normal traffic. We evaluated our proposed detection model with these four datasets
(a) DARPA 2000 LLDOS 1.0 with LBL-PKT-4. (b) 16 bit subnet spoofed attack with LBL-PKT-4.
Fig. 5. Dataset vs. Variance.
Table 5
Optimal parameter and performance for each fold on LBL-PKT-4 and attack traffic of 250 pps.
Matrix size (MS) Window size (WS) T Training detection rates Testing
Detection rates Delay (s)
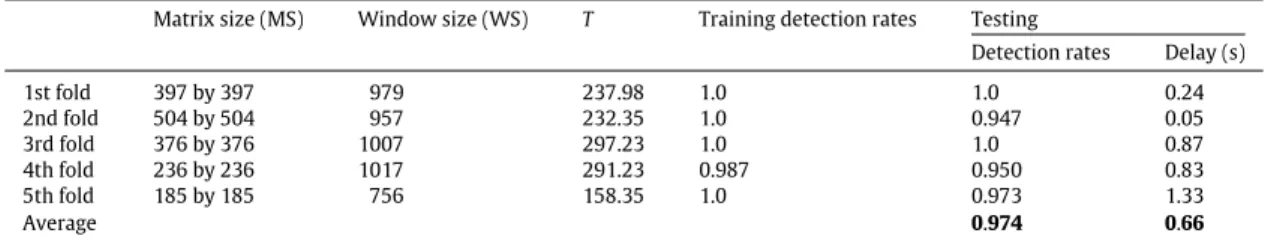
1st fold 397 by 397 979 237.98 1.0 1.0 0.24 2nd fold 504 by 504 957 232.35 1.0 0.947 0.05 3rd fold 376 by 376 1007 297.23 1.0 1.0 0.87 4th fold 236 by 236 1017 291.23 0.987 0.950 0.83 5th fold 185 by 185 756 158.35 1.0 0.973 1.33 Average 0.974 0.66
Column head description; MS (matrix size), WS (packet based window size),T(threshold value).
Table 6
Optimal parameter and performance for each fold on LBL-PKT-4 and attack traffic of 500 pps. MS WS T Training detection rates Testing
Detection rates Delay (s)
1st fold 307 by 307 817 93.85 0.093 0.964 1.40 2nd fold 331 by 331 902 174.98 1.0 1.0 0.55 3rd fold 255 by 255 751 146.98 1.0 1.0 0.85 4th fold 235 by 235 963 237 1.0 1.0 1.17 5th fold 268 by 268 1001 118.97 1.0 0.979 1.09 Average 0.989 1.01 Table 7
Optimal parameter and performance for each fold on LBL-PKT-4 and attack traffic of 1000 pps. MS WS T Training detection rates Testing
Detection rates Delay (s)
1st fold 371 by 371 688 109.60 1.0 1.0 0.52 2nd fold 455 by 455 749 165.73 1.0 0.954 0.51 3rd fold 386 by 386 1023 186.73 1.0 1.0 0.45 4th fold 215 by 215 1011 201.10 1.0 1.0 0.30 5th fold 409 by 409 716 95.48 1.0 0.983 0.46 Average 0.987 0.45
that have a different intensity of attacks. The duration of the LBL-PKT-4 normal dataset is 360 s and each generated attack dataset comes into the victim system for 120 s after 120 s, i.e. from 120 to 240 s.
We adopted 5-fold cross validation to verify our detection model. We divided each dataset into 5 folds. Firstly, the first fold for testing data was selected among the 5-folded datasets and the rest of them were used for training data. Secondly, we used the GA on the training data in order to get optimal parameters. Thirdly, the parameters were applied to the testing data and then we computed detection rates and detection delay. These processes should be carried out on the rest of the folds in the same manner. Finally, we obtained the average of detection rates and detection delay as a result of one dataset.
Tables 5–8show the optimal parameters, training results, and testing results for each dataset.
Table 9describes a summary of the results fromTables 5–8. The results show the performance of our detection model. Average detection rates of the testing fold were over 97.4% (minimum average detection rates) and average detection delay was shorter than 1.01 s (maximum average detection delay). These experimental results showed that our detection model is very accurate and does not need much time to detect DDoS attacks regardless of the volume of attack traffics. Also, all three detection parameters were well optimized by the GA as most training folds had the highest detection rates. The optimized
Table 8
Optimal parameter and performance for each fold on LBL-PKT-4 and attack traffic of 2000 pps. MS WS T Training detection rates Testing
Detection rates Delay (s)
1st fold 226 by 226 531 68.48 1.0 1.0 0.19 2nd fold 327 by 327 1017 145.48 1.0 1.0 0.35 3rd fold 497 by 497 989 183.60 1.0 1.0 0.10 4th fold 431 by 431 715 89.60 1.0 1.0 0.10 5th fold 123 by 123 852 119.10 1.0 0.973 0.46 Average 0.995 0.24 Table 9
Summary of the results fromTables 5–8.
Dataset Average detection rates Average detection delay (s) Generated attack of 250 pps+LBL-PKT-4 (250 pps) 0.974 0.66
Generated attack of 500 pps+LBL-PKT-4 (250 pps) 0.989 1.01 Generated attack of 1000 pps+LBL-PKT-4 (250 pps) 0.987 0.45 Generated attack of 2000 pps+LBL-PKT-4 (250 pps) 0.995 0.24
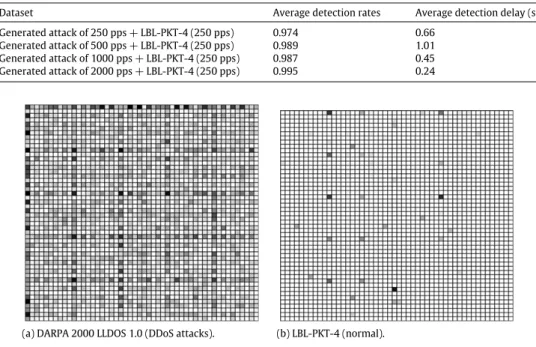
(a) DARPA 2000 LLDOS 1.0 (DDoS attacks). (b) LBL-PKT-4 (normal).
Fig. 6. Visualization results of traffic matrix.
parameters enable our detection model to run in different network environments. As the experimental results are shown in
Table 5, even a relatively low volume of attacks could be detected. Furthermore, our proposed detection model can detect a high volume of attacks faster than a low volume of attacks thanks to the variable window size.
Additionally, we visualized the traffic matrix results of DDoS attacks and normal inFig. 6.Fig. 6(a) shows the traffic matrix of DDoS attacks andFig. 6(b) describes one of the normal traffics. The value of each element of the matrix is represented as a white–gray–black level color. If the value is high the color becomes black, whereas if the value is low it becomes white. A DDoS attack traffic is evenly distributed because the source IP addresses are spoofed randomly. Thus, we can recognize that the variance of the traffic matrix is very low. On the other hand, the legitimate traffic has relatively fewer traffic sources and the intensity of traffic concentrates to a few sources even though they have a large amount of traffic. Thus, we can figure out the high variance of the traffic matrix. These visualization results may help one to distinguish between DDoS attacks and normal without expert knowledge.
5. Conclusions
In this paper, we have proposed a novel detection model to detect DDoS attacks using the dispersibility of the inbound packets’ source IP addresses. We have employed an enhanced traffic matrix based approach and optimized parameters through the Genetic Algorithm (GA). We showed that our proposed approach satisfies the major requirements of the detection approach such as low processing overheads, short detection delay, and high detection rates. Furthermore, our model can be used in a real-time network environment and it can be implemented easily. Constructing a traffic matrix requires only two fields of IP header such as arrival time of packet and source IP address. A simple reformed hash function was also adopted to locate packets to the traffic matrix and avoid hash collisions. A variable window based on the number of incoming packets makes our model effective in terms of the detection delay and reduces computational overheads comparable to our previous approach. Our detection model can also maximize the detection rates by optimizing detection parameters through GA according to corresponding network environments.
References
[1] Arbor Networks, World Wide Infrastructure Security Report 2008, 2008.
[2] C. Fung, Collaborative intrusion detection networks and insider attacks, Journal of Wireless Mobile Networks, Ubiquitous Computing, and Dependable Applications 2 (1) (2011) 63–74.
[3] C. Douligeris, A. Mitrokotsa, DDoS attacks and defense mechanisms: classification and state-of-the-art, Computer Networks 44 (5) (2004) 643–666. [4] J. Li, J. Mirkovic, M. Wang, P. Reiher, L. Zhang, SAVE: source address validity enforcement protocol, in: INFOCOM, vol. 3, 2002, pp. 1557–1566. [5] Cisco, NetRanger overview. Available from:http://www.cisco.com/univercd/cc/td/doc/product/iaabu/csids/csids1/csidsug/overview.htm. [6] Computer Incident Advisory Capability, Network intrusion detector overview. Available from:http://ciac.llnl.gov/cstc/nid/intro.html. [7] Mimestar.com, SecureNet PRO feature list. Available from:http://www.mimestar.com/products.
[8] Internet Security Systems, Intrusion detection security products. Available from: http://www.iss.net/securing_e-business/security_products/intrusion_detection/index.php. [9] NFR Security, NFR Network intrusion detection. Available from:http://www.nfr.com.
[10] The open source network intrusion detection system: snort. Available from:http://www.snort.org.
[11] M. Roesch, Snort—lightweight intrusion detection for networks, in: The 13th USENIX Conf. on System Administration, 1999, pp. 229–238. [12] M. Roesch, Snort users manual: snort release 1.8.5, 2002.http://www.snort.org/documentation.html.
[13] T. Peng, C. Leckie, R. Kotagiri, Proactively detecting DDoS attack using source IP address monitoring, in: The 3rd Int. IFIP-TC6 Networking Conf., in: Lecture Notes in Computer Science, vol. 3042, 2004, pp. 771–782.
[14] L. Feinstein, D. Schnackenberg, R. Balupari, D. Kindred, Statistical approaches to DDoS attack detection and response, in: DARPA Information Survivability Conf. and Exposition, 2003, pp. 303–314.
[15] Y. Kim, J.-Y. Jo, K. Suh, Baseline profile stability for network anomaly detection, in: The 3rd Int. Conf. on Information Technology: New Generations, 2006, pp. 720–725.
[16] T. Kim, D. Kim, S. Lee, J. Park, Detecting DDoS attacks using dispersible traffic matrix and weighted moving average, in: The 3rd Conf. on Information Security and Assurance, in: Lecture Notes in Computer Science, vol. 5567, 2009, pp. 290–300.
[17] V. Paxson, S. Floyd, Wide-area traffic: the failure of Poisson modeling, IEEE/ACM Transactions on Networking 3 (3) (1995) 226–244. The trace LBL-PKT-4 can be obtained viahttp://ita.ee.lbl.gov/traces/lbl-pkt-4.tar.Z.
[18] MIT Lincoln Lab., DARPA intrusion detection scenario specific datasets, 2002. Available from:http://www.ll.mit.edu/mission/communications/ist/ corpora/ideval/data/index.html.
[19] J. Lee, D. Kim, S. Lee, J. Park, DDoS attacks detection using GA based optimized traffic matrix, in: The 5th Int. Conf. on Innovative Mobile and Internet Services in Ubiquitous Computing, 2011, pp. 216–220.
[20] W. Lee, S.J. Stolfo, Data mining approaches for intrusion detection, in: The 7th USENIX Security Symp., 1998, pp. 79–93.
[21] W. Lee, S.J. Stolfo, K.W. Mok, A data mining framework for building intrusion detection models, in: The 1999 IEEE Symp. on Security and Privacy, 1999, 120–132.
[22] R.R. Talpade, G. Kim, S. Khurana, NOMAD: traffic-based network monitoring framework for anomaly detection, in: The 4th IEEE Symp. on Computers and Comm., 1998.
[23] B.E. Brodsky, B.S. Darkhovsky, Nonparametric Methods in Change-Point Problems, Kluwer Academic Publishers, 1993. [24] H. Wang, D. Zhang, K.G. Shin, Detecting SYN flooding attacks, in: IEEE INFOCOM, vol. 3, 2002, pp. 1530–1539.
[25] J. Mirkovic, P. Reiher, A taxonomy of DDoS attacks and DDoS defense mechanisms, ACM SIGCOMM Computer Communication Review 34 (2) (2004) 39–54.