Chapter
7
77
The Chiropractic Practitioner
Th e fi rst section of the 2014 Survey of Chiropractic Practice inquired about the responding chiropractic practitioner. Survey data were reported only from licensed doctors of chiropractic who indicated they were practicing 20 or more hours per week. Th erefore, those chiroprac-tors who received the survey and were not currently practicing chiropractic (either retired or working as researchers and/or educators) were asked to return the survey without completing it. Over ten percent (10.7%) of the surveys returned indicated that the respondent was not currently in practice. Th e next question asked practitioners to report the hours per week they spend in patient care practice. Data from those who marked 9 or fewer (3.0%) and 10-19 hours (7.1%) were not included in this report as they were considered to be in part-time practice.
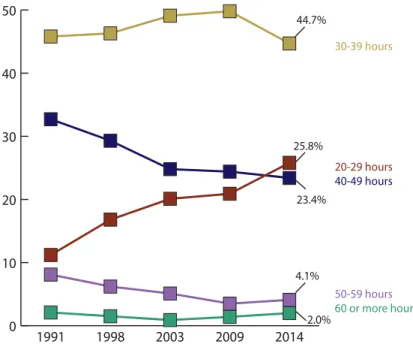
According to the results of the 2014 survey, nearly half (44.7%) of full-time chiropractors work 30-39 hours per week, while one-quarter (23.4%) work 40-49 hours per week (Figure 7.1). Th ese proportions are essentially the same as they were in 2009. Since this question was fi rst asked in 1991, the proportion working 20-29 hours per week has increased signifi cantly, from 11.2% to 25.8%. 20-29 hours 30-39 hours 40-49 hours 50-59 hours 60 or more hours 44.7% 25.8% 23.4% 4.1% 2.0% 0 10 20 30 40 50 2014 2009 2003 1998 1991
Chapter
7
Personal Demographics
In the Demographic Data section of the survey, respondents answered questions concerning personal characteristics such as gender and ethnicity.
Gender
According to the 2014 survey data, 72.9% of chiropractic practitioners are male and 27.1% are female. In comparison to the NBCE 1991 survey, the percentage of female chiropractors has essentially doubled (Figure 7.2).
0 20 40 60 80 100 2014 2009 2003 1998 1991 Female Male 86.7% 80.8% 82.0% 13.3% 19.2% 18.0%22.4% 77.6% 72.9% 27.1%
Figure 7.2 Practitioner Gender
Ethnic Origin
When inquiring into practitioner ethnicity, the 2014 survey allowed respondents to mark all categories that applied and also to write in an additional ethnic origin. Th is survey found that 89.4% of respondents chose White as a single ethnic origin. Th is continues a generally downward trend since 1991.
Multi-Ethnic, Asian, Hispanic, African American, Native American, and other ethnicities comprise the remaining 10.6% (Table 7.1).
Ethic Origin 1991 1998 2003 2009 2014
Asian/Pacifi c Islander 0.8% 1.8% 2.7% 2.6% 2.8%
Black or African American 0.5% 0.6% 0.8% 0.9% 1.2%
White 95.5% 93.5% 91.5% 84.9% 89.4%
Hispanic 1.6% 1.7% 2.2% 1.0% 2.0%
Native American 0.2% 0.8% 0.6% 0.4% 0.3%
Other 1.2% 1.6% 1.5% 1.2% 0.2%
Multi-Ethnic — — 0.7% 9.0% 4.1%
Chapter
7
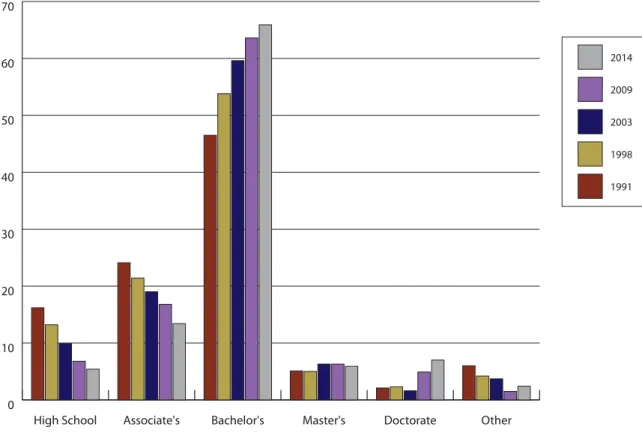
Level of Non-Chiropractic EducationTh e Demographic Data section also asked participants to indicate the highest level of non-chiropractic education they have attained. Th e level of pre-chiropractic education has steadily risen since 1991, revealed in the increased number of chiropractors with bachelor’s degrees as shown in Figure 7.3.
Ninety-fi ve (94.6%) percent of chiropractors hold a post-secondary academic degree in addition to doctor of chiropractic.
Almost two-thirds (65.9%) of chiropractic practitioners have bachelor’s degrees, 5.9% have master’s degrees, and 7.0% have doctorates in non-chiropractic fi elds. Compared to the 1991 survey data, the proportion of chiropractors with bachelor’s,
master’s, and doctoral degrees has increased.
0 10 20 30 40 50 60 70 2014 2009 2003 1998 1991 Other Doctorate Master's Bachelor's Associate's High School
Figure 7.3 Non-chiropractic Education
Post-Graduate Diplomate Status
Regarding specialty training and board certifi cation, respondents were asked to indicate if they hold post-graduate diplomate status through a specialty board, council, academy, college, or association.
Chapter
7
Of the survey respondents, 16.4% have attained diplomate status or the equivalent, 18.0% indicated that they have worked toward diplomate status, and the remaining 65.6% have no diplomate status or equivalent specialty certifi cation (Table 7.2).
Status Percentage
None / NA 65.6%
Worked toward 18.0%
Completed 16.4%
Table 7.2 Post-graduate Diplomate Status Chiropractic Colleges Represented
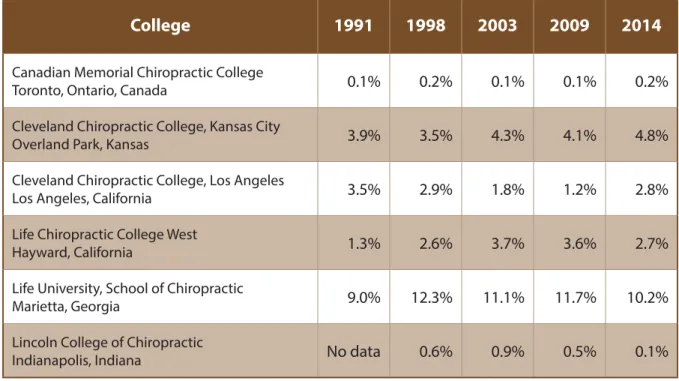
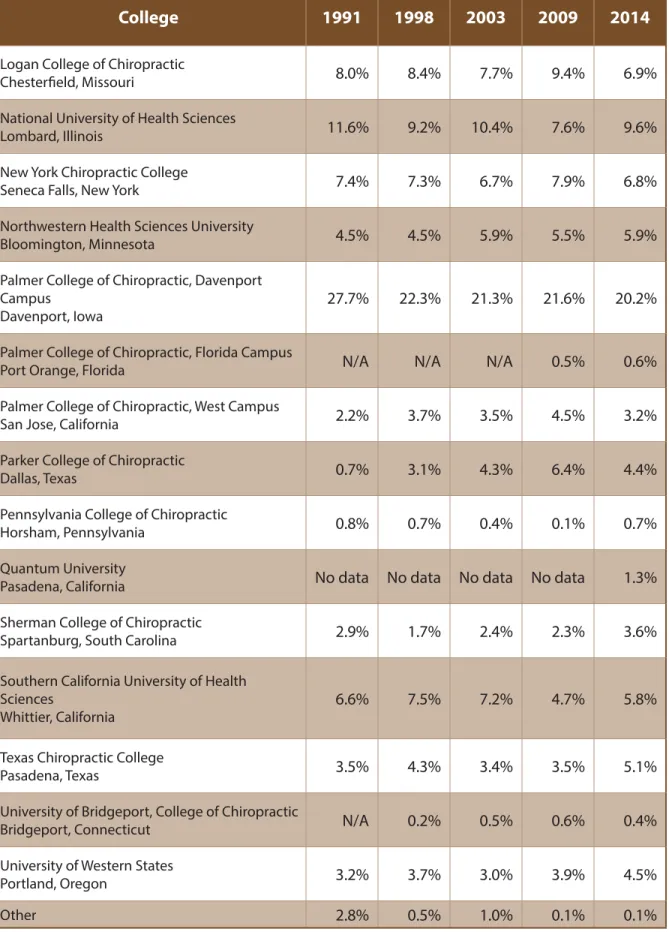
Respondents were asked to indicate the college from which they received their Doctor of Chiropractic degree. Approximately one-fourth (24.0%) of respondents received their chiro-practic degree from one of the three Palmer colleges and 12.9% received their Doctor of Chiropractic degree from one of the two Life colleges. Nine percent (9.6%) of the respondents indicated that National was the college from which they graduated. Only those institutions with at least one respondent are listed. Since 1991, new colleges have been added to this list1
(Table 7.3).
College 1991 1998 2003 2009 2014
Canadian Memorial Chiropractic College
Toronto, Ontario, Canada 0.1% 0.2% 0.1% 0.1% 0.2%
Cleveland Chiropractic College, Kansas City
Overland Park, Kansas 3.9% 3.5% 4.3% 4.1% 4.8%
Cleveland Chiropractic College, Los Angeles
Los Angeles, California 3.5% 2.9% 1.8% 1.2% 2.8%
Life Chiropractic College West
Hayward, California 1.3% 2.6% 3.7% 3.6% 2.7%
Life University, School of Chiropractic
Marietta, Georgia 9.0% 12.3% 11.1% 11.7% 10.2%
Lincoln College of Chiropractic
Indianapolis, Indiana No data 0.6% 0.9% 0.5% 0.1%
1 “No data” in place of a value for particular institutions in Table 7.3 denotes data were not obtained for that institution at the time of the survey. “N/A” denotes the program had not conferred the D.C. degree when data were obtained.
Chapter
7
College 1991 1998 2003 2009 2014
Logan College of Chiropractic
Chesterfi eld, Missouri 8.0% 8.4% 7.7% 9.4% 6.9%
National University of Health Sciences
Lombard, Illinois 11.6% 9.2% 10.4% 7.6% 9.6%
New York Chiropractic College
Seneca Falls, New York 7.4% 7.3% 6.7% 7.9% 6.8%
Northwestern Health Sciences University
Bloomington, Minnesota 4.5% 4.5% 5.9% 5.5% 5.9%
Palmer College of Chiropractic, Davenport Campus
Davenport, Iowa 27.7% 22.3% 21.3% 21.6% 20.2%
Palmer College of Chiropractic, Florida Campus
Port Orange, Florida N/A N/A N/A 0.5% 0.6%
Palmer College of Chiropractic, West Campus
San Jose, California 2.2% 3.7% 3.5% 4.5% 3.2%
Parker College of Chiropractic
Dallas, Texas 0.7% 3.1% 4.3% 6.4% 4.4%
Pennsylvania College of Chiropractic
Horsham, Pennsylvania 0.8% 0.7% 0.4% 0.1% 0.7%
Quantum University
Pasadena, California No data No data No data No data 1.3%
Sherman College of Chiropractic
Spartanburg, South Carolina 2.9% 1.7% 2.4% 2.3% 3.6%
Southern California University of Health Sciences
Whittier, California 6.6% 7.5% 7.2% 4.7% 5.8%
Texas Chiropractic College
Pasadena, Texas 3.5% 4.3% 3.4% 3.5% 5.1%
University of Bridgeport, College of Chiropractic
Bridgeport, Connecticut N/A 0.2% 0.5% 0.6% 0.4%
University of Western States
Portland, Oregon 3.2% 3.7% 3.0% 3.9% 4.5%
Other 2.8% 0.5% 1.0% 0.1% 0.1%
Chapter
7
The Chiropractic Work Environment
Th e Work Environment section of the 2014 survey investigated several current areas regard-ing the nature of chiropractic practice. Th is section inquired about hospital staff privileges and treatment of military personnel, community size of the practice location, number of patients seen weekly, and the use of radiography.
Hospital and Military Practice
A small portion (3.6%) of practicing chiropractors reported that they hold staff privileges at a hospital. Th is group had been growing steadily since 1991 – with 4.9% in 1991, 5.2% in 1998, 6.0% in 2003, and 6.9% in 2009 – but the percent was lower in the 2014 survey.
Another small percent (6.7%) is currently employed under contract to provide chiropractic care to active or retired military personnel. Th is group has grown by 50% since the question was fi rst asked in 2009.
Practice Location by Community Size and Use of Radiography
Th irty-four percent (34.1%) of chiropractors reported that their offi ce is located in a city, 31.0% practice in a suburb, and 19.1% practice in a small town.
Only 14.6% of respondents described their practice location as a rural small town or a rural area.
About fi ft y percent (50.1%) of chiropractic practitioners take radiographs in their offi ces; almost one third of these (14.1%) use digital imaging equipment.
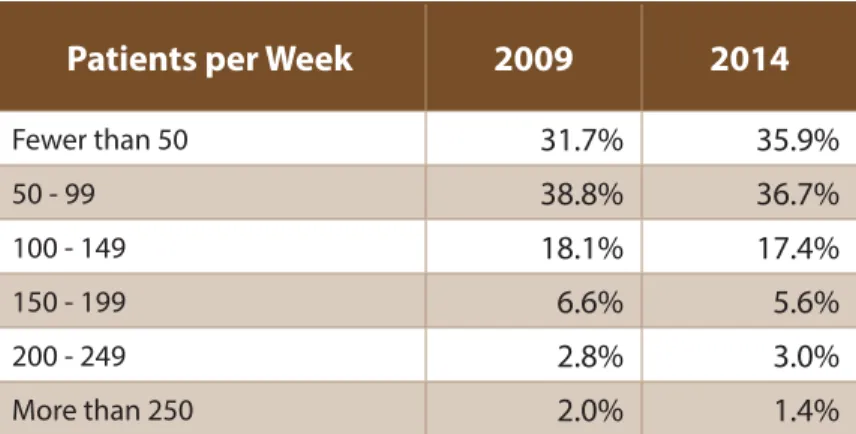
Patient Workload, Gender, and Ages
A large majority (72.6%) of chiropractors report that they treat up to 99 individual patients in a week: 36.7% treat 50 to 99 patients, and 35.9% treat fewer than 50 patients. A smaller proportion (27.4%) see 100 or more individual patients weekly: 17.4% treat 100 to 149 patients, and 10.0% reported that they personally see more than 150 individual patients in a week (Table 7.4).
Patients per Week 2009 2014
Fewer than 50 31.7% 35.9% 50 - 99 38.8% 36.7% 100 - 149 18.1% 17.4% 150 - 199 6.6% 5.6% 200 - 249 2.8% 3.0% More than 250 2.0% 1.4%
Chapter
7
Responding chiropractors estimated that females account for 59.0% of their patients.Th is distribution has been essentially unchanged since the 1991 NBCE Survey of Chiropractic Practice.
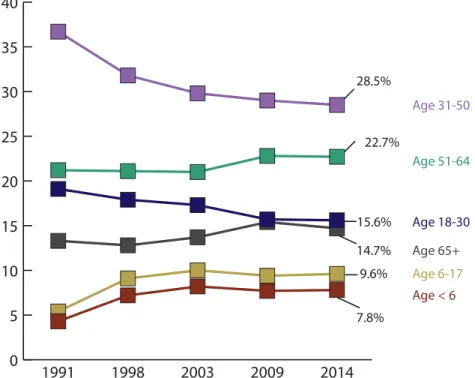
Data from the current survey indicate that the percentage of patients under 18 years of age has increased since the 1991 survey but is about the same as in 1998, 2003, and 2009 (9.7% in 1991, 16.3% in 1998, 18.2% in 2003, 17.1% in 2009, and 17.4% in 2014). Th e current survey, like the 1998, 2003, and 2009 surveys, asked respon-dents to diff erentiate between the percentage of youngsters in their practice who were 5 years of age and under (7.8%) and those who were between 6 and 17 years old (9.6%).
Th e rank order of patient age categories has remained about the same over the past 23 years. Th e highest percentage of patients is still in the 31-50-year range (28.5%), followed by 51-64-year-olds (22.7%). Th e last three age categories have alternated in highest frequency (Figure 7.4).
Age < 6 Age 6-17 Age 18-30 Age 31-50 28.5% 22.7% 15.6% 14.7% 7.8% 0 5 10 15 20 25 30 35 40 2014 2009 2003 1998 1991 9.6% Age 51-64 Age 65+
Chapter
7
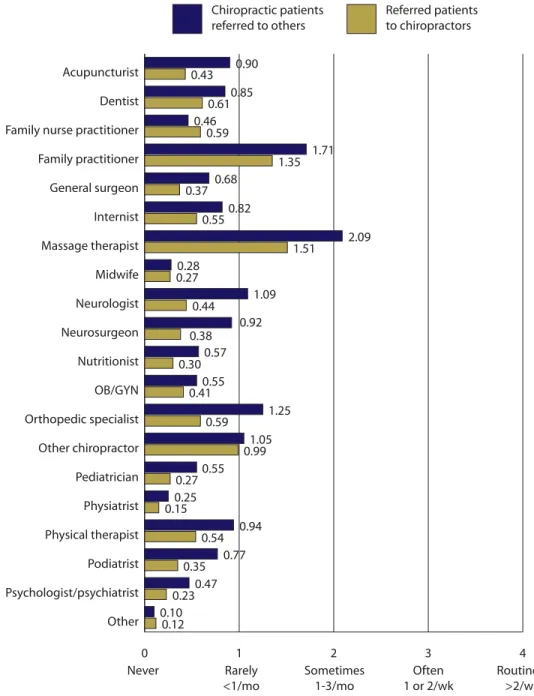
Interprofessional Referrals
Th e 2009 survey asked participants to specify the frequency with which they received patient referrals from other health professionals and/or made patient referrals to other health professionals in the past year. Questions regarding interprofessional referrals were not included in the 2014 survey. Since nearly all respondents (99.3%) indicated they had made referrals to other health professionals and 98.3% reported receiving referrals of patients from other health professionals in 2009, those important data are re-reported here (Figure 7.5).
0 1 2 3 4 Referred patients to chiropractors Chiropractic patients referred to others Other Psychologist/psychiatrist Podiatrist Physical therapist Physiatrist Pediatrician Other chiropractor Orthopedic specialist OB/GYN Nutritionist Neurosurgeon Neurologist Midwife Massage therapist Internist General surgeon Family practitioner Family nurse practitioner Dentist Acupuncturist
Never Rarely Sometimes Often Routinely
<1/mo 1-3/mo 1 or 2/wk >2/wk 0.90 0.43 0.85 0.61 0.46 1.71 0.82 2.09 1.51 0.28 1.09 0.44 0.92 0.38 0.57 0.30 0.55 1.25 0.59 1.05 0.99 0.55 0.27 0.25 0.15 0.94 0.54 0.77 0.35 0.47 0.23 0.12 0.10 0.41 0.27 0.55 0.68 0.37 1.35 0.59
Chapter
7
Experience and Orientation
Th e 2014 survey addressed length of time in practice, components of chiropractic practice, and practice setting and work role.
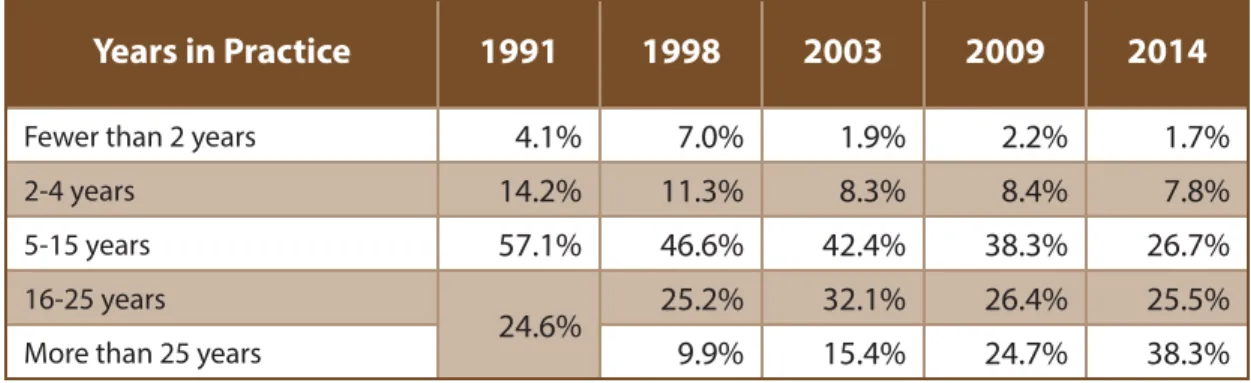
Years in Practice
Th e trend over the past 18 years has continued, with the portion of practitioners in practice more than 25 years increasing to 38.3% in 2014. As in 2009, a small portion of respondents have been in practice fewer than fi ve years (10.6% in 2009 and 9.5% in 2014), and more than half have practiced for more than 15 years* (51.1% in 2009 and 63.8% in 2014) (Table 7.5).
Years in Practice 1991 1998 2003 2009 2014
Fewer than 2 years 4.1% 7.0% 1.9% 2.2% 1.7%
2-4 years 14.2% 11.3% 8.3% 8.4% 7.8%
5-15 years 57.1% 46.6% 42.4% 38.3% 26.7%
16-25 years
24.6% 25.2% 32.1% 26.4% 25.5%
More than 25 years 9.9% 15.4% 24.7% 38.3% Table 7.5 Years in Practice
* Th ese fi ndings are discussed further in Chapter 6.
Components of Chiropractic Practice
Th e 2014 NBCE survey also addressed the time committed to various functions associated with a chiropractic offi ce. Time spent in direct patient care and education, documentation of care, and business management including marketing were rated in 2009 and 2014.
According to respondents, a typical chiropractor now spends a quarter (26.3%) of occupa-tional time documenting the care provided; this category has increased substantially since the question was asked in 1998 (13.8%) and 2003 (13.2%). Chiropractors now spend 56.4% of their practice time performing direct patient care and education and 16.8% with business manage-ment and marketing duties.
Chapter
7
2014 2009 56.4% Documentation Direct Care 57.4% Business Management 16.8% 17.4% 26.3% 25.2%Figure 7.6 Components of Chiropractic Practice
Practice Setting and Work Role
According to the results of the 2014 survey, 90.8% of the respondents work in a chiropractic offi ce, while 7.8% work in an integrated health care facility (Table 7.6).
Setting Percentage
Chiropractic offi ce 90.8%
Integrated health care facility 7.8%
Spinal surgical center 0.1%
Community health center 0.1%
Other 1.2%
Chapter
7
Nearly three-fourths (74.7%) reported they are sole proprietors, while 13.5% reported being an associate or employee. Eight percent (8.3%) reported that they are in a business partnership (Table 7.7). Role Percentage Sole proprietor 74.7% Partner 8.3% Associate/Employee 13.5% Other 3.4%
Table 7.7 Role in Practice Setting
Survey Concerning Chiropractic Assistants
Th e 2009 survey included several questions regarding the duties and certifi cation or licens-ing of chiropractic assistants. Th ese questions were not asked in the 2014 survey; therefore, the 2009 unweighted data are reported here.
By responding to one or more of the questions in this section, the majority (55.4%) of chiro-practic practitioners indicated that they currently employ one or more chirochiro-practic assistants to perform direct patient contact duties in their offi ces. Th is fi nding is consistent with the previ-ous NBCE surveys, which contained a more limited question regarding the use of chiropractic assistants. When asked about their practice work environment, 41.1% of the respondents to the NBCE survey in 1998 and 41.5% in 2003 reported that they were delegating the application of adjunctive therapies to a chiropractic assistant.
Interestingly, while 44.1% of the respondents reported that their state requires some form of certifi cation or licensure for non-chiropractors to perform patient contact duties in a chiro-practic offi ce, respondents also reported that certifi ed or licensed chiropractic assistants are employed full-time in only 28.8% of their offi ces. Th is apparent disparity may be explained as follows: It is possible that many respondents who live in states requiring certifi cation or licen-sure of chiropractic assistants do not employ these professionals to perform patient contact duties. One-quarter (25.5%) of chiropractors employ one or more licensed or certifi ed massage therapists.
Chapter
7
Practitioners who employ chiropractic assistants reported that they most commonly apply ice packs, electrical stimulation, hot packs, and ultrasound therapy to patients; they also frequently obtain patients’ vital signs (Table 7.8).
Duty Percent who
Perform
Apply ice packs/cryotherapy 71.5%
Apply electrical stimulation/therapy 64.9%
Apply hot packs/moist heat 56.2%
Apply ultrasound therapy 50.8%
Obtain vital signs 45.2%
Perform massage treatments 37.6%
Teach and/or supervise exercises 36.8%
Apply mechanically assisted traction/decompression 35.5%
Take x-rays 22.8%
Apply vibratory therapy 20.0%
Perform postural assessments 18.8%
Apply cold laser treatment 16.3%
Apply infrared, heat lamp, or heating pad 13.8%
Perform urine dipstick analysis 10.6%
Perform orthopedic/neurological examinations 10.4%
Perform thermography/EMG scans 10.0%
Apply direct current or iontophoresis 8.6%
Apply diathermy (shortwave or microwave) 8.4%
Apply whirlpool or hydrotherapy 6.4%
Apply paraffi n baths 5.3%
Draw blood for testing 2.7%