TESIS DOCTORAL
En convenio espec´ıfico de cotutela: 23–32. 7 – 088 2015
UNIVERSIDAD CARLOS III DE MADRID
Programa de Doctorado en Ciencia y Tecnolog´ıa Inform´atica
UNIVERSIDAD DEL CAUCA
Programa de Doctorado en Ingenier´ıa Telem´atica
Framework for Data Quality in Knowledge
Discovery Tasks
AUTOR
David Camilo Corrales Mu˜noz DIRECTOR
Dr. Agapito Ledezma Espino CO-DIRECTOR Dr. Juan Carlos Corrales
TESIS DOCTORAL
FRAMEWORK FOR DATA QUALITY IN KNOWLEDGE DISCOVERY TASKS
Autor: David Camilo Corrales Mu˜noz
Director: Dr. D. Agapito Ledezma Co-director: Dr. D. Juan Carlos Corrales
Tribunal Calificador Firma
Presidente: Araceli Sanchis de Miguel ...
Vocal: Juan Pedro Valente ...
Secretario: Gustavo Adolfo Ram´ırez ...
Calificaci´on: ...
Agradecimientos
Cuando te sientas a escribir estas palabras y te colocas a pensar en cada una de las personas que te apoyaron a lo largo de tu doctorado, te das cuenta que estas l´ıneas no son suficientes para agradecerles toda la contribuci´on que de alguna u otra forma han realizado. Sin embargo, no est´a dem´as decirles, infinitas gracias.
En especial a mis padres Fredy y Stella, por sus sabios consejos, por in-fundirme desde muy peque˜no el significado de la responsabilidad, forjar mi car´acter y ense˜narme a levantar, con m´as fuerza y m´as ganas cuando las cosas no salen bien.
A mi hermano Juan Carlos, que ha sido siempre mi modelo a seguir. La persona que m´as admiro y la que me ha regalado infinidad de consejos como director de tesis y como hermano.
A Mariale, por ser mi inspiraci´on, por contagiarme de su optimismo, por apo-yar mis decisiones, por corregirme cuando estoy equivocado y por soportarme en momentos dif´ıciles.
A mis directores, el Profe Agapito y Juan Carlos, por guiarme a lo largo de este camino, por brindarme sus sabios consejos, y por la formaci´on adquirida como in-vestigador.
A los chicos de Grupo CAOS, en especial a Mari Paz, Jose Antonio, ´Oscar, Germ´an y la Profe Araceli que me hicieron sentir en casa durante mi estad´ıa en Espa˜na, por todos los caf´es y comidas que compartimos juntos, por abrirme las puertas de sus casas.
A los chicos del Grupo GIT, especialmente a los Ingenieros ´Alvaro y Gustavo por el apoyo en la formaci´on como Doctor en Ingenier´ıa Telem´atica.
Resumen
Actualmente la explosi´on de datos es tendencia en el universo digital debido a los avances en las tecnolog´ıas de la informaci´on. En este sentido, el descubrimiento de conocimiento y la miner´ıa de datos han ganado mayor importancia debido a la gran cantidad de datos disponibles. Para un exitoso proceso de descubrimiento de conocimiento, es necesario preparar los datos. Expertos afirman que la fase de preprocesamiento de datos toma entre un 50% a 70% del tiempo de un proceso de descubrimiento de conocimiento.
Herramientas software basadas en populares metodolog´ıas para el descubri-miento de conocidescubri-miento ofrecen algoritmos para el preprocesadescubri-miento de los datos. Seg´un el cuadrante m´agico de Gartner de 2018 para ciencia de datos y plataformas de aprendizaje autom´atico, KNIME, RapidMiner, SAS, Alteryx, y H20.ai son las mejores herramientas para el desucrimiento del conocimiento. Estas herramientas proporcionan diversas t´ecnicas que facilitan la evaluaci´on del conjunto de datos, sin embargo carecen de un proceso orientado al usuario que permita abordar los problemas en la calidad de datos. Adem´as, la selecci´on de las t´ecnicas adecuadas para la limpieza de datos es un problema para usuarios inexpertos, ya que estos no tienen claro cuales son los m´etodos m´as confiables.
De esta forma, la presente tesis doctoral se enfoca en abordar los proble-mas antes mencionados mediante: (i) Un marco conceptual que ofrezca un pro-ceso guiado para abordar los problemas de calidad en los datos en tareas de des-cubrimiento de conocimiento, (ii) un sistema de razonamiento basado en casos que recomiende los algoritmos adecuados para la limpieza de datos y (iii) una on-tolog´ıa que representa el conocimiento de los problemas de calidad en los datos y los algoritmos de limpieza de datos. Adicionalmente, esta ontolog´ıa contribuye en la representacion formal de los casos y en la fase de adaptaci´on, del sistema de razonamiento basado en casos.
Abstract
The creation and consumption of data continue to grow by leaps and bounds. Due to advances in Information and Communication Technologies (ICT), today the data explosion in the digital universe is a new trend. The Knowledge Discovery in Databases (KDD) gain importance due the abundance of data. For a success-ful process of knowledge discovery is necessary to make a data treatment. The experts affirm that preprocessing phase take the 50% to 70% of the total time of knowledge discovery process.
Software tools based on Knowledge Discovery Methodologies offers algo-rithms for data preprocessing. According to Gartner 2018 Magic Quadrant for Data Science and Machine Learning Platforms, KNIME, RapidMiner, SAS, Al-teryx and H20.ai are the leader tools for knowledge discovery. These software tools provide different techniques and they facilitate the evaluation of data analy-sis, however, these software tools lack any kind of guidance as to which techniques can or should be used in which contexts. Consequently, the use of suitable data cleaning techniques is a headache for inexpert users. They have no idea which methods can be confidently used and often resort to trial and error.
This thesis presents three contributions to address the mentioned problems: (i) A conceptual framework to provide the user a guidance to address data qual-ity issues in knowledge discovery tasks, (ii) a Case-based reasoning system to recommend the suitable algorithms for data cleaning, and (iii) an Ontology that represent the knowledge in data quality issues and data cleaning methods. Also, this ontology supports the case-based reasoning system for case representation and reuse phase.
Contents
1 Introduction 1 1.1 Context . . . 1 1.2 Motivation . . . 2 1.3 Problem statement . . . 3 1.4 Research Questions . . . 31.5 Research Purpose and Objectives . . . 3
1.6 Contributions . . . 4
1.7 Outline . . . 5
1.8 Publications . . . 5
1.8.1 Accepted papers . . . 6
1.8.2 Other published papers . . . 6
2 State of Art 8 2.1 Background . . . 8
2.1.1 Methodologies for Knowledge Discovery . . . 8
2.1.1.1 Knowledge Discovery in Databases (KDD) . . . 8
2.1.1.2 Cross Industry Standard Process for Data Min-ing (CRISP-DM) . . . 9
2.1.1.3 Sample, Explore, Modify, Model and Assess (SEMMA) . . . 10
2.1.1.4 Data Science . . . 11
2.1.2 Data Quality Framework . . . 12
2.1.3 Ontology . . . 14
2.1.4 Case-based reasoning systems . . . 15
2.2 Related works . . . 17
2.2.1 Data Quality Frameworks . . . 18
2.2.1.1 Shortcomings . . . 21
2.2.2 Data Quality Ontologies . . . 21
2.2.2.1 Shortcomings . . . 24
2.2.3 Case-based reasoning systems . . . 24
CONTENTS
2.3 Summary . . . 28
3 Conceptual Data Quality Framework 29 3.1 Mapping the selected data sources . . . 29
3.2 Understanding the selected data . . . 31
3.3 Identifying and categorizing components . . . 36
3.4 Integrating components . . . 37
3.5 Validating the conceptual framework . . . 40
3.5.1 Classification tasks . . . 40
3.5.1.1 Test of conceptual framework: physical activity monitoring . . . 40
3.5.1.2 Comparative study . . . 45
3.5.1.3 Classification mini-challenges . . . 49
3.5.2 Regression tasks . . . 67
3.5.2.1 Test of conceptual framework: comments pre-diction in Facebook . . . 67
3.5.2.2 Comparative study . . . 76
3.5.2.3 Regression mini-challenges . . . 80
3.6 Summary . . . 90
4 Data Cleaning Ontology 92 4.1 Build glossary of terms . . . 93
4.2 Build concept taxonomies . . . 95
4.3 Build ad hoc binary relation diagrams . . . 98
4.4 Build concept dictionary . . . 100
4.4.1 Dataset and Data Quality Issue . . . 100
4.4.2 Data cleaning task . . . 101
4.4.3 Model and Performance . . . 105
4.5 Describe rules . . . 105
4.5.1 Data quality issues . . . 106
4.5.2 Data cleaning tasks . . . 106
4.5.2.1 Imputation . . . 107
4.5.2.2 Outliers detection . . . 107
4.5.2.3 Classes balancing . . . 107
4.5.2.4 Dimensionality reduction . . . 108
4.5.2.5 Label correction . . . 108
4.5.2.6 Remove duplicate instances . . . 108
4.6 Ontology Editor . . . 109
CONTENTS
5 Case-based reasoning for data cleaning 112
5.1 Case-base construction . . . 113 5.1.1 Problem space . . . 114 5.1.2 Solution space . . . 119 5.2 Case retrieval . . . 119 5.2.1 Filter phase . . . 120 5.2.1.1 Case clustering . . . 120 5.2.1.2 Case quartile . . . 123 5.2.2 Similarity mechanisms . . . 124
5.2.2.1 Similarity based on dataset meta-features - Sim(ds)125 5.2.2.2 Similarity based on meta-features of dataset at-tributes - Sim(att) . . . 126 5.3 Case reuse . . . 129 5.4 Case retain . . . 130 5.5 Results . . . 131 5.5.1 Classification . . . 133 5.5.2 Regression . . . 136 5.6 Summary . . . 139
6 Conclusions and future works 140 6.1 Conclusions . . . 140
6.2 Future works . . . 142
Appendices 169 A Conceptual framework 170 A.1 Case study: office occupancy . . . 170
A.1.0.1 Outliers detection . . . 170
A.1.0.2 Label correction . . . 170
A.1.0.3 Classes balancing . . . 170
A.1.0.4 Remove duplicate instances . . . 171
A.1.0.5 Results . . . 171
A.2 Description of the dataset comments prediction in Facebook . . . 172
A.3 Results . . . 174
A.3.1 Classification . . . 176
A.3.2 Regression . . . 182
A.4 Datasets similarity . . . 184
A.4.1 Classification . . . 184
CONTENTS B Retrieval mechanism 213 B.1 Panel of Judges . . . 213 B.1.1 Evaluations of Judge 1 . . . 213 B.1.1.1 Classification . . . 213 B.1.1.2 Regression . . . 217 B.1.2 Evaluations of Judge 2 . . . 220 B.1.2.1 Classification . . . 220 B.1.2.2 Regression . . . 224 B.1.3 Evaluations of Judge 3 . . . 226 B.1.3.1 Classification . . . 226 B.1.3.2 Regression . . . 230 B.1.4 Evaluations of Judge 4 . . . 233 B.1.4.1 Classification . . . 233 B.1.4.2 Regression . . . 237 B.1.5 Evaluations of Judge 5 . . . 239 B.1.5.1 Classification . . . 239 B.1.5.2 Regression . . . 243 B.1.6 Evaluations of Judge 6 . . . 246 B.1.6.1 Classification . . . 246 B.1.6.2 Regression . . . 250 B.2 Results: Classification . . . 252 B.3 Results: Regression . . . 259
C Prototype: Hygeia data 263 C.1 System Functionalities . . . 263 C.2 System Architecture . . . 264 C.2.1 Application layer . . . 264 C.2.2 Mediation layer . . . 265 C.2.3 Foundation layer . . . 265 C.3 User Interfaces . . . 266
List of Figures
1.1 Contributions of PhD thesis . . . 5
2.1 Phases of KDD process. . . 9
2.2 Phases and generic tasks of CRISP-DM. . . 10
2.3 Stages of SEMMA process. . . 11
2.4 Data science process. Source: [24] . . . 12
2.5 Conceptual Data Quality Framework developed by Deloitte Bel-gium. Source: [33] . . . 13
2.6 Example of Ontology for classification and clustering models. The blue circle represents the class individuals while the gray square depicts the classes. The dotted line represents a relation between two classes and the solid line means a hierarchical relation. 15 2.7 The general architecture of case-based reasoning systems. . . 16
3.1 Example of missing values generated by weather stations for Tem-perature, Humidity and Rainfall. The columns represent the dataset attributes. The rows represent the dataset instances with sampling frequency of 30 minutes. The symbol ? in red color represents the missing values in the dataset. . . 32
3.2 Outliers in house cost prediction. The dots in red color represent the outliers respect to remaining of data represented by blue dots. . 32
3.3 Imbalanced class in a dataset for loan approval. Red stars repre-sent the instances with the positive decision of loan. Gray circles represent the instances with the negative decision of loan. . . 33
3.4 Inconsistency of a dataset for loan approval. The columns rep-resent the dataset attributes. The rows reprep-resent the dataset in-stances. The inconsistency is presented in the instances 1 and 2 due to attributes have the same values but the values of the class are different. . . 34
LIST OF FIGURES
3.5 Redundancy of a dataset for house cost prediction. The columns represent the dataset attributes. The rows represent the dataset instances. The redundancy is presented in the attributes Area and Built-up terrain. The duplicate records are depicted in instances 1 and 2. . . 34 3.6 Data recollection of temperature by two WS. The WS “A”
mea-sures the temperature in different format/scale than WS “B”. . . . 35 3.7 Categories of the data quality issues for classification and
regres-sion task . . . 36 3.8 Conceptual framework . . . 38 3.9 Frequencies of missing data patterns. Magenta color shows the
missing values and blue color non-missing data . . . 42 3.10 Box plot of Local Outliers Factors. Each box plot corresponds to
dataset of physical activity monitoring . . . 43 3.11 Instance distribution per class: balanced vs imbalanced . . . 44 3.12 Top-15 of attributes with highest correlation forPearsonmethod. . 44 3.13 Comparison of the precision of classifiers generated from datasets
created by the Conceptual Framework (CF) and the classifiers generated from the original datasets proposed by the authors and published in the UCI repository. . . 48 3.14 Comparison of the AUC of classifiers generated from datasets
cre-ated by the Conceptual Framework (CF) and the classifiers gener-ated from the original datasets proposed by the authors and pub-lished in the UCI repository. . . 49 3.15 Similarity between dataset authors and dataset cleaned by CF
-Classification tasks . . . 51 3.16 Data training - Variant 1: imputed values for Attribute 6 . . . 70 3.17 Data training - Variant 2: imputed values for Attribute 31 . . . 70 3.18 Outliers detected by LOF for training set - Variant 5. The outliers
are represented by symbol + in red color. The black dots represent the instances. . . 71 3.19 Absolute correlation obtained by Chi-squared and Information gain
for Variant 1 . . . 73 3.20 Absolute correlation obtained by Chi-squared and Information gain
for Variant 2 . . . 73 3.21 Absolute correlation obtained by Chi-squared and Information gain
for Variant 3 . . . 74 3.22 Absolute correlation obtained by Chi-squared and Information gain
for Variant 4 . . . 74 3.23 Absolute correlation obtained by Chi-squared and Information gain
LIST OF FIGURES
3.24 Mean absolute errors of the models processed by conceptual frame-work (CF) and datasets of authors of UCI repository . . . 79 3.25 Similarity between dataset of authors and dataset cleaned by CF
-Regression tasks . . . 80 4.1 Taxonomy of the Concept: Attribute. The white square depicts
the classes. The solid line represents a hierarchical relation. . . 96 4.2 Taxonomy of the Concept: Data cleaning task. The white square
depicts the classes. The solid line represents a hierarchical relation. 96 4.3 Taxonomy of the Concept: Imputation. The white square depicts
the classes. The solid line represents a hierarchical relation. . . 96 4.4 Taxonomy of the Concept: Outlier Detection. The white square
depicts the classes. The solid line represents a hierarchical relation. 97 4.5 Taxonomy of the Concept: Classes balancing. The white square
depicts the classes. The solid line represents a hierarchical relation. 97 4.6 Taxonomy of the Concept: Label correction. The white square
depicts the classes. The solid line represents a hierarchical relation. 97 4.7 Taxonomy of the Concept: Dimensionality Reduction. The white
square depicts the classes. The solid line represents a hierarchical relation. . . 98 4.8 Binary relations of Data cleaning ontology. The white square
de-picts the classes. The dotted line represents a relation between two classes. . . 99 4.9 Screenshot of DCO in ontology editor: Prot´eg´e . . . 109 5.1 CBR for data cleaning in knowledge discovery tasks. The CBR
is composed by case-base, and three phases: case retrieval, case reuse and case retain. . . 113 5.2 Example of case representation through Data cleaning ontology
for the dataset of Polish companies bankruptcy. The gray square represents the class individuals while the white square depicts the classes. The solid line means a hierarchical relation and the dotted line indicates the data cleaning algorithms used in the dataset and attributes. . . 114 5.3 Case retrieval mechanism. In the first phase, a filter approach is
applied. The second phase computes a ranking of recovered cases by filter approaches based on similarity measures. . . 120
LIST OF FIGURES
5.4 Example of K-means. The circles represent the centroids and the squares depict the cases. a) The initial centroids are assigned. b) The cases are assigned to the closet cluster centroids. c) The cluster centroids are recalculated. d) The cases are assigned to new centroids. . . 121 5.5 Case distribution in the clusters for case-base of classification.
The x-axis corresponds to the number of clusters and y-axis num-ber represents cases assigned to each cluster . . . 121 5.6 Case distribution in the clusters for case-base of regression. The
x-axis corresponds to the number of clusters and y-axis number represents cases assigned to each cluster. . . 122 5.7 True Positive Rate of C4.5, MLP and SVM (2, 3, 4, 5, 6 and 7
clusters) for case-base of classification. . . 123 5.8 True Positive Rate of C4.5, MLP and SVM (2, 3, 4, 5, 6 and 7
clusters) for case-base of regression. . . 123 5.9 Example of quartile analysis for missing values ratio, mean
ab-solute kurtosis and mean attribute entropy. The gray cells corre-spond to quartiles where the new caseCqis classified. . . 124
5.10 Attribute matching for Exact and Plugin categories. The first matrix shows the Exact attribute matching. The second column presents the Pluging matching. The rows represent the dataset at-tributes of Cq, while the columns depict the dataset attributes of
Ct. The gray cells represent the highest similarity for each
at-tribute ofCq respect toCtattributes . . . 127
5.11 Subsume match of dataset attributes. The rows of the first matrix represent the dataset attributes of Cq, while the columns of the
first matrix depict the dataset attributes ofCt. The second matrix
is the transpose of similarity matrix. The gray cells represent the highest similarity for each attribute ofCqrespect toCtattributes . 128
5.12 Representation of dimensionality reduction algorithms in data clean-ing ontology. The blue circle represents the class individuals while the gray square depicts the classes. The solid line means a hierar-chical relation. . . 130 5.13 Retrieved cases by filter approach for classification tasks . . . 134 5.14 PrecisionP@3, P@7, and P@10for filter approaches in
classifi-cation tasks . . . 134 5.15 Top5 – P–Precision@K for filter approaches and similarity
mech-anisms in classification tasks . . . 135 5.16 Retrieved cases by filter approach for regression tasks . . . 136 5.17 Precision P@3, P@7, and P@10for filter approaches in
LIST OF FIGURES
5.18 Top5 – P–Precision@K for filter approaches and similarity
mech-anisms in regression tasks . . . 138
A.1 Instance distribution per class: balanced vs imbalanced . . . 171
C.1 Hygeia data tool . . . 263
C.2 Logical view of Hygeia data tool . . . 265
C.3 Form of the statistical information of a dataset. . . 267
C.4 Charts for attributes: Histogram, Box plot, Bars . . . 267
C.5 Conceptual framework form . . . 268
C.6 Forms of recommendation of data cleaning method and results of chi–squared. . . 269
List of Tables
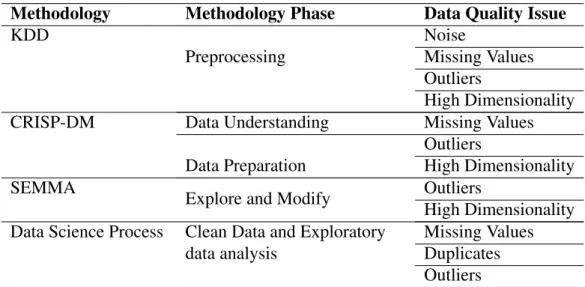
2.1 Related works: Data Quality Frameworks . . . 18 2.2 Related works: Data cleaning ontologies . . . 22 2.3 Shortcomings of the related works: data cleaning ontologies . . . 24 2.4 Related works: case-based reasoning systems . . . 25 2.5 Shortcomings of the related CBR works . . . 27 3.1 Data quality issues considered in data mining and machine
learn-ing methodologies . . . 30 3.2 Number of papers found to address data quality issues [118]. . . . 31 3.3 Data cleaning tasks . . . 37 3.4 Number of instances of activity monitoring dataset. Each dataset
is represented by a subject (Subject 101, ... , Subject 109) . . . . 41 3.5 Potential outliers. The lower and upper limits are calculated by
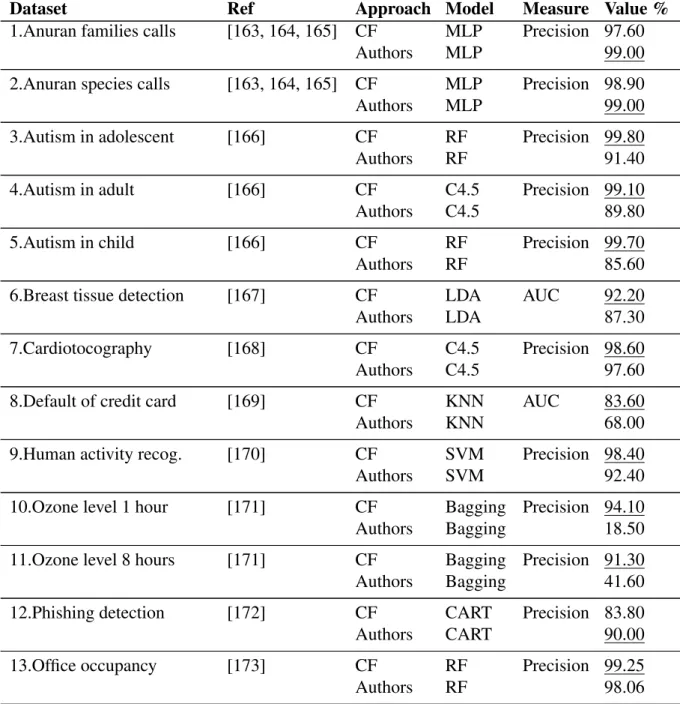
Tukey Fences. Each dataset is represented by a subject (Subject 101, ... , Subject 109) . . . 43 3.6 Standard 9-fold cross-validation - Accuracy . . . 45 3.7 Precision and AUC of the classifiers processed by conceptual
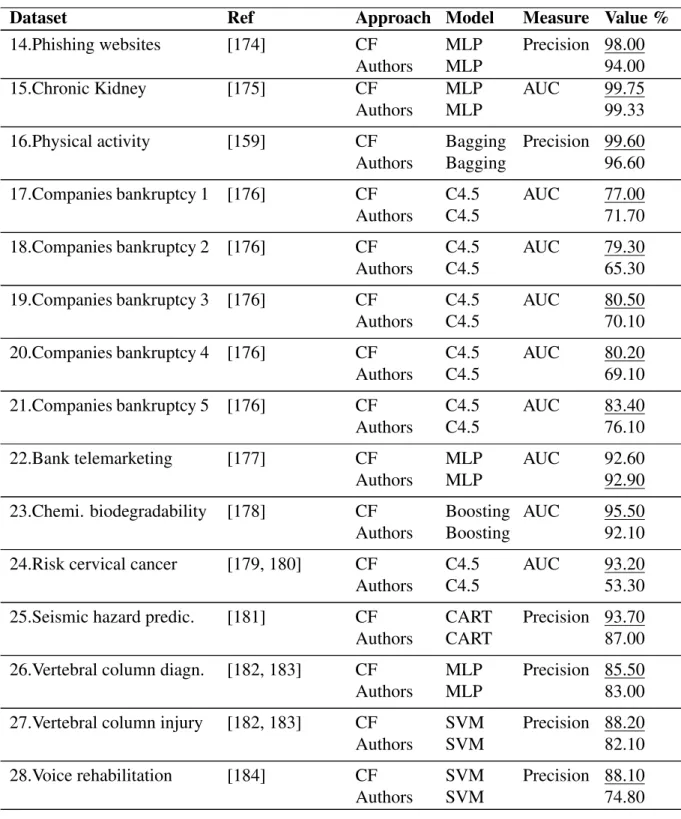
frame-work (CF) and datasets authors of UCI repository. The underlined values represent the highest Precision and AUC (between the clas-sifiers processed by CF and datasets authors). . . 46 3.7 Precision and AUC of the classifiers processed by conceptual
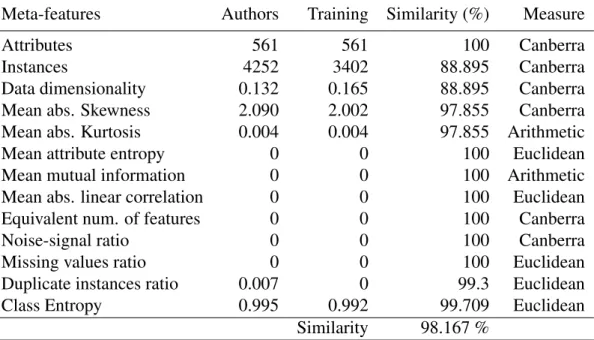
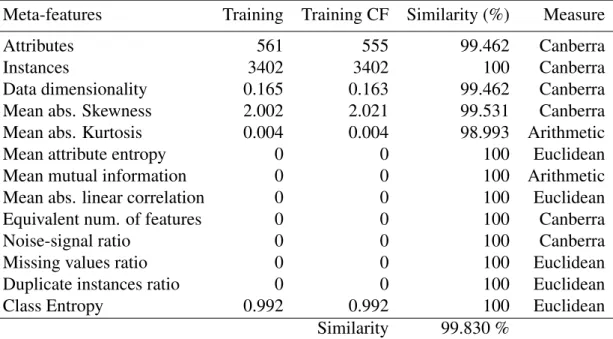
frame-work (CF) and datasets authors of UCI repository. The underlined values represent the highest Precision and AUC (between the clas-sifiers processed by CF and datasets authors). . . 47 3.8 Dataset 9: Human activity recognition. Similarity between dataset
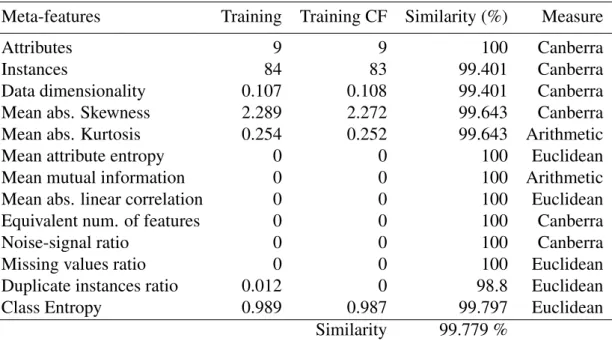
of authors and training set . . . 52 3.9 Dataset 9: Human activity recognition. Similarity between
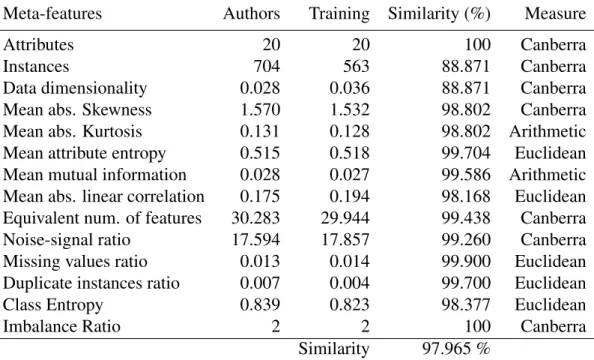
origi-nal training set and the training set cleaned by the CF . . . 53 3.10 Dataset 28: Voice rehabilitation. Similarity between dataset of
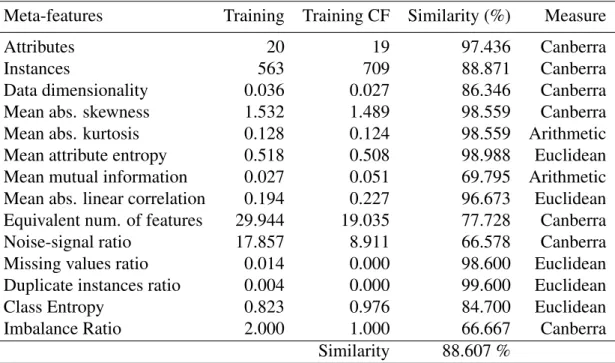
LIST OF TABLES
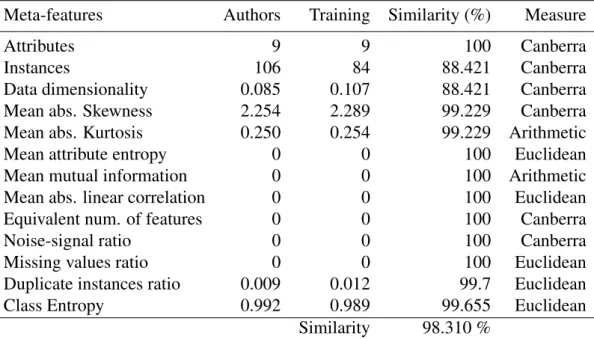
3.11 Dataset 28: Voice rehabilitation. Similarity between original train-ing set and the traintrain-ing set cleaned by the CF . . . 55 3.12 Dataset 4: Autism in adult. Similarity between dataset of authors
and training set . . . 56 3.13 Dataset 4: Autism in adult. Similarity between original training
set and the training set cleaned by the CF . . . 57 3.14 Dataset 4: Autism in adult (Training set). Accuracy for C4.5,
REP Tree and RF. The signals below the diagonal represent the results to apply the t-test. The symbol (+)/(-) indicates that the classifier of the rowiis significantly better/worst than classifier of the columnj. The symbol (.) means that the classifiers compared do not contain statistically significant differences. . . 57 3.15 Dataset 4: Autism in adult (Training set cleaned by CF). Accuracy
for C4.5, REP Tree and RF. The signals below the diagonal rep-resent the results to apply the t-test. The symbol (+)/(-) indicates that the classifier of the row i is significantly better/worst than classifier of the column j. The symbol (.) means that the classi-fiers compared do not contain statistically significant differences.
. . . 58 3.16 Dataset 6: Breast tissue detection. Similarity between dataset of
authors and training set . . . 59 3.17 Dataset 6: Breast tissue detection. Similarity between original
training set and the training set cleaned by the CF . . . 60 3.18 Dataset 6: Breast tissue detection (Training set). AUC measure
for SVM and LDA. The signals below the diagonal represent the results to apply the t-test. The symbol (+)/(-) indicates that the classifier of the rowiis significantly better/worst than classifier of the columnj. The symbol (.) means that the classifiers compared do not contain statistically significant differences. . . 60 3.19 Dataset 6: Breast tissue detection (Training set cleaned by CF).
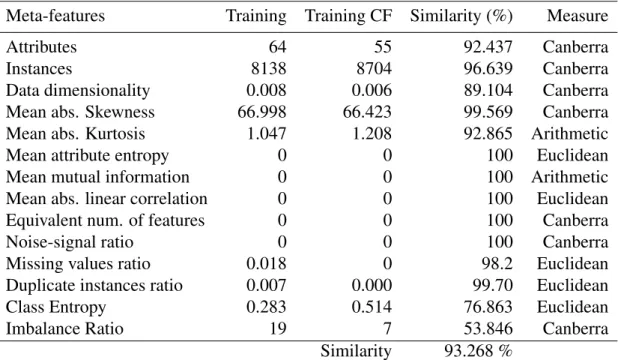
AUC measure for SVM and LDA. The signals below the diagonal represent the results to apply the t-test. The symbol (+)/(-) indi-cates that the classifier of the row i is significantly better/worst than classifier of the column j. The symbol (.) means that the classifiers compared do not contain statistically significant differ-ences. . . 61 3.20 Dataset 18: Companies bankruptcy 2. Similarity between dataset
of authors and training set . . . 62 3.21 Dataset 18: Companies bankruptcy 2. Similarity between original
LIST OF TABLES
3.22 Dataset 18: Companies bankruptcy 2 (Training set). AUC mea-sure for C4.5, MLP and SVM. The signals below the diagonal represent the results to apply the t-test. The symbol (+)/(-) indi-cates that the classifier of the row i is significantly better/worst than classifier of the column j. The symbol (.) means that the classifiers compared do not contain statistically significant differ-ences. . . 63 3.23 Dataset 18: Companies bankruptcy 2 (Training set cleaned by
CF). AUC measure for C4.5, MLP and SVM. The signals below the diagonal represent the results to apply the t-test. The symbol (+)/(-) indicates that the classifier of the rowiis significantly bet-ter/worst than classifier of the column j. The symbol (.) means that the classifiers compared do not contain statistically significant differences. . . 64 3.24 Dataset 22: Bank telemarketing. Similarity between dataset of
authors and training set . . . 65 3.25 Dataset 22: Bank telemarketing. Similarity between original
train-ing set and the traintrain-ing set cleaned by the CF . . . 66 3.26 Dataset 22: Bank telemarketing (Training set). AUC measure for
C4.5, SVM and MLP. The signals below the diagonal represent the results to apply the t-test. The symbol (+)/(-) indicates that the classifier of the rowiis significantly better/worst than classifier of the columnj. The symbol (.) means that the classifiers compared do not contain statistically significant differences. . . 66 3.27 Dataset 22: Bank telemarketing (Training set cleaned by CF).
AUC measure for C4.5, SVM and MLP. The signals below the di-agonal represent the results to apply the t-test. The symbol (+)/(-) indicates that the classifier of the rowiis significantly better/worst than classifier of the columnj. The symbol (.) means that the clas-sifiers compared do not contain statistically significant differences. 67 3.28 Number of instances of dataset for prediction of comments in
Facebook posts . . . 68 3.29 Mean absolute error for imputation methods: Random forest and
mean imputation. Training sets: Variant 1- 5 . . . 69 3.30 Outliers detected by LOF and DBSCAN . . . 71 3.31 Duplicate instances for each training set . . . 72 3.32 MAE obtained by: Conceptual framework (CF) and [160]. The
underlined values represent the lowest MAE overall achieved by the models. . . 76 3.33 Mean absolute errors of the models processed by conceptual
LIST OF TABLES
3.33 Mean absolute errors of the models processed by conceptual frame-work (CF) and datasets authors of UCI repository . . . 78 3.34 Dataset 10: Rental Bikes Hourly. Similarity between dataset of
authors and training set . . . 81 3.35 Dataset 10: Rental Bikes Hourly. Similarity between original
training set and the training set cleaned by the CF . . . 82 3.36 Dataset 10: Rental Bikes Hourly (Training set). MAE measure
for LR and REP Tree. The signals below the diagonal represent the results to apply the t-test. The symbol (+)/(-) indicates that the classifier of the rowiis significantly better/worst than classifier of the columnj. The symbol (.) means that the classifiers compared do not contain statistically significant differences. . . 82 3.37 Dataset 10: Rental Bikes Hourly (Training set cleaned by CF).
AUC measure for LR and REP Tree. The signals below the diag-onal represent the results to apply the t-test. The symbol (+)/(-) indicates that the classifier of the rowiis significantly better/worst than classifier of the column j. The symbol (.) means that the classifiers compared do not contain statistically significant differ-ences. . . 83 3.38 Dataset 5: Comments prediction in FB - 3. Similarity between
dataset of authors and training set . . . 84 3.39 Dataset 5: Comments prediction in FB - 3. Similarity between
original training set and the training set cleaned by the CF . . . . 85 3.40 Dataset 5: Comments prediction in FB - 3 (Training set). Mean
Absolute Error for MLP, RBF, REP Tree and M5. The signals below the diagonal represent the results to apply the t-test. The symbol (+)/(-) indicates that the classifier of the row i is signifi-cantly better/worst than classifier of the columnj. The symbol (.) means that the regression models compared do not contain statis-tically significant differences. . . 86 3.41 Dataset 5: Comments prediction in FB - 3 (Training set cleaned
by CF). Mean Absolute Error for MLP, RBF, REP Tree and M5. The signals below the diagonal represent the results to apply the t-test. The symbol (+)/(-) indicates that the classifier of the row iis significantly better/worst than classifier of the columnj. The symbol (.) means that the regression models compared do not contain statistically significant differences. . . 86 3.42 Dataset 15: Feedback Blogs Prediction. Similarity between dataset
of authors and training set . . . 87 3.43 Dataset 15: Feedback Blogs Prediction. Similarity between
LIST OF TABLES
3.44 Dataset 15: Feedback Blogs Prediction (Training set). Mean Ab-solute Error for M5, REP Tree, LR and MLP. The signals below the diagonal represent the results to apply the t-test. The symbol (+)/(-) indicates that the classifier of the rowiis significantly bet-ter/worst than classifier of the column j. The symbol (.) means that the regression models compared do not contain statistically significant differences. . . 89 3.45 Dataset 15: Feedback Blogs Prediction (Training set cleaned by
CF). MAE for M5, REP Tree, LR and MLP. The signals below the diagonal represent the results to apply the t-test. The symbol (+)/(-) indicates that the classifier of the rowiis significantly bet-ter/worst than classifier of the column j. The symbol (.) means that the regression models compared do not contain statistically significant differences. . . 89 4.1 Comparison of methodologies to build ontologies. Source: [211] . 93 4.2 Description and type (Class, Instance, Attribute) of the terms of
Data cleaning ontology . . . 94 4.3 Synonyms and acronyms of the terms ofData cleaning ontology . 95 4.4 Inverse relations of ad hoc binary relations of the Data cleaning
ontology . . . 99 4.5 Concept dictionary of: Dataset,Attribute,Nominal,Numericand
Data Quality Issue . . . 101 4.6 Concept dictionary of: Imputation,Deletion,HotDeckImputation,
ImputationBasedOnMissingAttributesand ImputationBasedOnNon-MissingAttributes . . . 101 4.7 Attributes of the Classes: ImputationBasedOnMissingAttributes
and HotDeckImputation . . . 102 4.8 Concept dictionary of: Outliers Detection,Density,High
Dimen-sionalandRemoving of duplicate instances . . . 102 4.9 Attributes of the Classes: Clustering and High dimensional . . . . 103 4.10 Concept dictionary of: ClassesBalancing,OverSampling,
Under-Sampling,LabelCorrection,ClassificationandThreshold . . . 103 4.11 Attributes of the Classes: OverSampling, UnderSampling and
Thresh-old . . . 104 4.12 Concept dictionary of:Dimensionality Reduction,Embedded,
Fil-ter,ProjectionandWrapper . . . 104 4.13 Class attributes of theData cleaning ontology . . . 105 4.14 Concept dictionary of:ModelandPerformance . . . 105
LIST OF TABLES
5.1 Related works of dataset meta-features. The first column presents the research works, follow by the application area and the meta-features. . . 115 5.2 Similarity functions used in features of attributes and target
vari-able . . . 129 5.3 Experience in data mining projects of the judges . . . 132 A.1 Results of dataset occupancy detection of an office room . . . 172 A.2 Attributes description of the dataset comments prediction in
Face-book. Attribute Index corresponds to number of the attribute, the Attribute Type is the category defined by the dataset authors [160], and the description represents the attribute definition. . . 173 A.3 Results of the classifiers processed by conceptual framework (CF) 176 A.4 Results of the classifiers processed by conceptual framework (CF) 177 A.5 Results of the classifiers processed by conceptual framework (CF) 178 A.6 Results of the classifiers processed by conceptual framework (CF) 179 A.7 Results of the classifiers processed by conceptual framework (CF) 180 A.8 Results of the regression models processed by conceptual
frame-work (CF) . . . 182 A.9 Results of the regression models processed by conceptual
frame-work (CF) . . . 183 A.10 Dataset 1: Anuran families calls . . . 184 A.11 Dataset 2: Anuran species calls . . . 184 A.11 Dataset 2: Anuran species calls . . . 185 A.12 Dataset 3: Autism in adolescent . . . 185 A.13 Dataset 4: Autism in adult . . . 185 A.13 Dataset 4: Autism in adult . . . 186 A.14 Dataset 5: Autism in child . . . 186 A.15 Dataset 6: Breast tissue detection . . . 186 A.15 Dataset 6: Breast tissue detection . . . 187 A.16 Dataset 7: Cardiotocography . . . 187 A.17 Dataset 8: Default of credit card . . . 188 A.18 Dataset 9: Human activity recog. . . 188 A.19 Dataset 10: Ozone level 1 hour . . . 189 A.20 Dataset 11: Ozone level 8 hours . . . 189 A.21 Dataset 12: Phishing detection . . . 190 A.22 Dataset 13: Office occupancy . . . 190 A.23 Dataset 14: Phishing websites . . . 191 A.24 Dataset 15: Chronic Kidney . . . 191 A.25 Dataset 16.1: Physical activity - subject 1 . . . 192 A.26 Dataset 16.2: Physical activity - subject 2 . . . 192
LIST OF TABLES
A.27 Dataset 16.3: Physical activity - subject 3 . . . 193 A.28 Dataset 16.4: Physical activity - subject 4 . . . 193 A.29 Dataset 16.5: Physical activity - subject 5 . . . 194 A.30 Dataset 16.6: Physical activity - subject 6 . . . 194 A.31 Dataset 16.7: Physical activity - subject 7 . . . 195 A.32 Dataset 16.8: Physical activity - subject 8 . . . 195 A.33 Dataset 16.9: Physical activity - subject 9 . . . 196 A.34 Dataset 17: Companies bankruptcy 1 . . . 196 A.35 Dataset 18: Companies bankruptcy 2 . . . 197 A.36 Dataset 19: Companies bankruptcy 3 . . . 197 A.37 Dataset 20: Companies bankruptcy 4 . . . 198 A.38 Dataset 21: Companies bankruptcy 5 . . . 198 A.39 Dataset 22: Bank telemarketing . . . 199 A.40 Dataset 23: Chemi. biodegradability . . . 199 A.41 Dataset 24: Risk cervical cancer . . . 200 A.42 Dataset 25: Seismic hazard predic. . . 200 A.43 Dataset 26: Vertebral column diagn. . . 201 A.44 Dataset 27: Vertebral column injury . . . 201 A.45 Dataset 28: Voice rehabilitation . . . 202 A.46 Dataset 1: Airfoil Self Noise . . . 202 A.47 Dataset 2: Beijing PM 2.5 pollution . . . 203 A.48 Dataset 3: Comments prediction in FB – 1 . . . 203 A.49 Dataset 4: Comments prediction in FB – 2 . . . 204 A.50 Dataset 5: Comments prediction in FB – 3 . . . 204 A.51 Dataset 6: Comments prediction in FB – 4 . . . 205 A.52 Dataset 7: Comments prediction in FB – 5 . . . 205 A.53 Dataset 8: Compressor decay . . . 206 A.54 Dataset 9: Turbine decay . . . 206 A.55 Dataset 10: Rental Bikes Hourly . . . 207 A.56 Dataset 11: Air Pollution Benzene . . . 207 A.57 Dataset 12: Rental Bikes Daily . . . 208 A.58 Dataset 13: Energy use of appliances . . . 208 A.59 Dataset 14: Posts in Facebook pages . . . 209 A.60 Dataset 15: Feedback Blogs Prediction . . . 209 A.61 Dataset 16: Forest Fires . . . 210 A.62 Dataset 17: I-Room temperature . . . 210 A.63 Dataset 18: II-Room temperature . . . 211 A.64 Dataset 19: I-Dinning room temperature . . . 211 A.65 Dataset 20: II-Dinning room temperature . . . 212 B.1 Query 1: Autism spectrum disorder in children . . . 214
LIST OF TABLES
B.1 Query 1: Autism spectrum disorder in children . . . 215 B.2 Query 2: Portuguese bank telemarketing . . . 215 B.2 Query 2: Portuguese bank telemarketing . . . 216 B.3 Query 3: Income prediction . . . 216 B.3 Query 3: Income prediction . . . 217 B.4 Query 1: Air pollution benzene estimation . . . 217 B.4 Query 1: Air pollution benzene estimation . . . 218 B.5 Query 2: Rental bikes hourly . . . 218 B.6 Query 3: Coffee rust . . . 219 B.7 Query 1: Autism spectrum disorder in children . . . 220 B.7 Query 1: Autism spectrum disorder in children . . . 221 B.8 Query 2: Portuguese bank telemarketing . . . 221 B.8 Query 2: Portuguese bank telemarketing . . . 222 B.9 Query 3: Income prediction . . . 222 B.9 Query 3: Income prediction . . . 223 B.10 Query 1: Air pollution benzene estimation . . . 224 B.11 Query 2: Rental bikes hourly . . . 225 B.12 Query 3: Coffee rust . . . 225 B.12 Query 3: Coffee rust . . . 226 B.13 Query 1: Autism spectrum disorder in children . . . 227 B.13 Query 1: Autism spectrum disorder in children . . . 228 B.14 Query 2: Portuguese bank telemarketing . . . 228 B.14 Query 2: Portuguese bank telemarketing . . . 229 B.15 Query 3: Income prediction . . . 229 B.15 Query 3: Income prediction . . . 230 B.16 Query 1: Air pollution benzene estimation . . . 230 B.16 Query 1: Air pollution benzene estimation . . . 231 B.17 Query 2: Rental bikes hourly . . . 231 B.17 Query 2: Rental bikes hourly . . . 232 B.18 Query 3: Coffee rust . . . 232 B.19 Query 1: Autism spectrum disorder in children . . . 233 B.19 Query 1: Autism spectrum disorder in children . . . 234 B.20 Query 2: Portuguese bank telemarketing . . . 235 B.21 Query 3: Income prediction . . . 236 B.22 Query 1: Air pollution benzene estimation . . . 237 B.23 Query 2: Rental bikes hourly . . . 238 B.24 Query 3: Coffee rust . . . 238 B.24 Query 3: Coffee rust . . . 239 B.25 Query 1: Autism spectrum disorder in children . . . 240 B.25 Query 1: Autism spectrum disorder in children . . . 241 B.26 Query 2: Portuguese bank telemarketing . . . 241
LIST OF TABLES
B.26 Query 2: Portuguese bank telemarketing . . . 242 B.27 Query 3: Income prediction . . . 242 B.27 Query 3: Income prediction . . . 243 B.28 Query 1: Air pollution benzene estimation . . . 243 B.28 Query 1: Air pollution benzene estimation . . . 244 B.29 Query 2: Rental bikes hourly . . . 244 B.30 Query 3: Coffee rust . . . 245 B.31 Query 1: Autism spectrum disorder in children . . . 246 B.31 Query 1: Autism spectrum disorder in children . . . 247 B.32 Query 2: Portuguese bank telemarketing . . . 247 B.32 Query 2: Portuguese bank telemarketing . . . 248 B.33 Query 3: Income prediction . . . 248 B.33 Query 3: Income prediction . . . 249 B.34 Query 1: Air pollution benzene estimation . . . 250 B.35 Query 2: Rental bikes hourly . . . 251 B.35 Query 2: Rental bikes hourly . . . 251 B.36 Query 3: Coffee rust . . . 251 B.36 Query 3: Coffee rust . . . 252 B.37 Classification: Query 1 - Attribute-Value (Attribute). . . 252 B.37 Classification: Query 1 - Attribute-Value (Attribute). . . 253 B.38 Classification: Query 1 - Attribute-Value (Dataset) . . . 253 B.38 Classification: Query 1 - Attribute-Value (Dataset) . . . 254 B.39 Classification: Query 2 - Attribute-Value (Attribute) . . . 255 B.40 Classification: Query 2 - Attribute-Value (Dataset) . . . 256 B.41 Classification: Query 3 - Attribute-Value (Attribute) . . . 257 B.42 Classification: Query 3 - Attribute-Value (Dataset) . . . 258 B.43 Regression: Query 1 - Attribute-Value (Attribute) . . . 259 B.44 Regression: Query 1 - Attribute-Value (Dataset) . . . 259 B.44 Regression: Query 1 - Attribute-Value (Dataset) . . . 260 B.45 Regression: Query 2 - Attribute-Value (Attribute) . . . 260 B.46 Regression: Query 2 - Attribute-Value (Dataset) . . . 261 B.47 Regression: Query 3 - Attribute-Value (Attribute) . . . 261 B.47 Regression: Query 3 - Attribute-Value (Attribute) . . . 262 B.48 Regression: Query 3 - Attribute-Value (Dataset) . . . 262
1. Introduction
1.1
Context
Due to advances in Information and Communication Technologies (ICT), today the data explosion in the digital universe is a new trend [1, 2, 3]. The vast amount of data coming from different sources such as social networks, messenger appli-cations for smart-phones, IoT, etc. The Forbes magazine reports an increase of data every second for every person in the world of 1.7 Megabytes from 2020 [4].
To maintain a competitive edge, organizations need to take advantage of the large amount of data to extract useful knowledge for making feasible decisions [5, 6]. These benefits facilitate the growth of organizational locations, strategies and customers. Decision makers can utilize the more readily available data to maximize customer satisfaction and profits, and predict potential opportunities and risks. To achieve it, the data quality must be guaranteed. Data quality is di-rectly related to the perceived or established purposes of the data. High-quality data meets expectations to a greater extent than low-quality data [7].
Nevertheless, the majority of organizations are pervaded with poor quality data [8, 9]. The appearance of such poor quality data and the presence of various errors significantly reduce the usability and creditability of the information systems and can have a moral and financial impact on the members of the organization and its associated stakeholders. A survey conducted in [10] revealed that data quality problems cost US businesses 611 billion dollar a year.
This thesis address the data quality issues in knowledge discovery (KD) tasks (classification and regression) through a conceptual framework to provide the user a guidance to address data problems, case-based reasoning system to recommend the suitable algorithms for data cleaning and an ontology that represent the knowl-edge in data cleaning.
1.2. MOTIVATION
1.2
Motivation
For a successful process of knowledge discovery (KD), there are methodologies such as the Cross Industry Standard Process for Data Mining (CRISP-DM) and Sample, Explore, Modify, Model and Assess (SEMMA). CRISP-DM contains two steps for data treatment: Verify Data Quality and Clean Data, while SEMMA the Mo-dify phase. Although the knowledge discovery methodologies define steps for data treatment, these not tackle the issues in data quality clearly, leaving out relevant activities [6, 11].
In this sense, a poor data preprocessing phase can potentially impact on the remainder of the phases in the knowledge discovery process. Data preprocessing is an essential step in knowledge discovery projects [12, 13]. It deals with prepar-ing data to be stored, processed or analyzed and with cleanprepar-ing it from unnecessary and problematic artifacts. It has been stated that preprocessing takes 50% to 70% of the total time of knowledge discovery projects [12, 13]. Data cleaning tasks are at once the most tedious and the most critical task. Failure to provide high data quality in the preprocessing stage will significantly reduce the performance of any data mining project. Hence, the phrase “garbage in garbage out” becomes true in the case of a data mining project [8]. In the following, we highlight the most relevant preprocessing challenges (data quality issues):
• Missing values: refers to when one variable or attribute does not contain any value.
• Outliers: these are observations which deviate much from other observa-tions and are suspicions that it was generated by a different mechanism. • High dimensionality: is referred as when dataset contains a large number
of features.
• Imbalanced class: is considered when a dataset exhibits an unequal distri-bution between its classes.
• Mislabelled classes: instances that are contradictory (duplicate samples have different class labels).
• Duplicate instances: represent instances with same values. In this thesis we address the data quality problems mentioned above.
1.3. PROBLEM STATEMENT
1.3
Problem statement
The methodologies of knowledge discovery mentioned above define a data pro-cessing phase. In CRISP-DM it is called Data Preparation phase, while in SEMMA is named Modify stage. Nevertheless, these methodologies do not explain how to find and what to do when data quality issues are present in data processing phase. Several knowledge discovery tools simplify the analysis and management of data. According to Gartner 2018 Magic Quadrant for Data Science and Machine Learning Platforms [14], KNIME [15], RapidMiner [16], SAS [17], Alteryx [18] and H20.ai [19] are the leader tools for knowledge discovery. These KD tools pro-vide different techniques and they facilitate the gathering, application, inspection, and evaluation of data analysis and their results, however, these KD tools lack any kind of guidance as to which techniques can or should be used in which contexts [20]. Consequently, the use of suitable data analysis technique is a headache for inexpert users. They have no idea which methods can be confidently used and often resort to trial and error [20].
Thus, in this thesis were addressed the problems identified above.
1.4
Research Questions
Based on the considerations previously described, this doctoral thesis rises the research questions:
1. How to assess the data quality in knowledge discovery tasks?
2. How to select the right data cleaning algorithm for solving a data quality issue?
1.5
Research Purpose and Objectives
The purpose of this research is to develop a framework for analysis of data qual-ity issues in knowledge discovery tasks through artificial intelligence based tech-niques. The research purpose was achieved through:
1. Define a conceptual framework to guide to user in data quality issues in knowledge discovery tasks (classification and regression).
2. Establish strategies that advise the suitable data cleaning algorithm to user for solving the data quality issue.
1.6. CONTRIBUTIONS
3. Build a mechanism that gathers data cleaning algorithms to solve the data quality issues identified by the framework.
4. Develop and evaluate experimentally a prototype that tests the mechanisms and strategies of the framework for data quality in knowledge discovery tasks.
1.6
Contributions
This section lists the main contributions of the PhD thesis. Each contribution is aligned with the objectives 1, 2 and 3 mentioned above. The objective 4 gathers the results of the first three objectives.
• A conceptual framework to provide the user a guidance to address data qual-ity issues in knowledge discovery tasks. To construct the conceptual frame-work we adapted the metodology “Building a Conceptual Frameframe-work: Phi-losophy, Definitions, and Procedure” [21].
• An ontology that gathers the data cleaning algorithms to solve the data qual-ity issues. This ontology allow to know the suitable data cleaning approach with respect to data quality problem.
• A Case-base reasoning to advise the suitable algorithm for data cleaning in classification and regression tasks.
Figure 1.1 shows the relations among contributions explained above. The conceptual framework guides the process to address data quality issues. The case-based reasoning system supports to the conceptual framework in each component, recommending the suitable data cleaning algorithm based on past experiences. Data cleaning ontology represent the knowledge of data quality issues and data cleaning algorithms for classification and regression tasks. This ontology lists methods of a data cleaning approach. Besides, this supports the CBR system in the case representation and reuse phase.
1.7. OUTLINE
Figure 1.1: Contributions of PhD thesis
1.7
Outline
To ensure a comprehensive coverage of the research problems, existing methods and the proposed goals, this thesis is organized as follows:
• Chapter 2 provides a comprehensive coverage of related works of data quality frameworks, data cleaning ontologies and case-based reasoning for data cleaning.
• Chapter 3details the conceptual framework to guide to user in the analysis of data quality issues.
• Chapter 4presents the case–based reasoning system to advise the suitable algorithm for data cleaning.
• Chapter 5 describes the ontology for data cleaning in classification and regression tasks.
• Chapter 6shows the conclusions and future works.
1.8
Publications
1.8. PUBLICATIONS
1.8.1
Accepted papers
• Corrales, D. C., Ledezma, A., & Corrales, J. C. (2018) “From theory to practice: a data quality framework for classification tasks”, Symmetry, 10(7), (JCR:Q2). Parts of this work have been incorporated in this thesis,
in Chapters 3 and 4.
• Corrales, D. C., Ledezma, A., & Corrales, J. C. (2018). “How to Address the Data Quality Issues in Regression Models: A Guided Process for Data Cleaning”,Symmetry, 10(4), (JCR:Q2). Parts of this work have been
incor-porated in this thesis, in Chapter 3.
• Corrales, D. C., Lasso, E., Ledezma, A., & Corrales, J. C. (2018). “Fea-ture selection for classification tasks: Expert knowledge or traditional meth-ods?”. Journal of Intelligent & Fuzzy Systems. In Press (JCR:Q3). Parts of
this work have been incorporated in this thesis, in Chapter 3.
• Corrales, D. C., Ledezma, A., & Corrales, J. C. (2016) .“A systematic review of data quality issues in knowledge discovery tasks”. Revista Inge-nier´ıas Universidad de Medell´ın, 15(28), 125-150.
• Corrales, D. C., Ledezma, A., & Corrales, J. C. (2015). “A conceptual framework for data quality in knowledge discovery tasks (FDQ-KDT): A Proposal”. Journal of Computers, 10(6), 396-405 (SJR:Q3).
1.8.2
Other published papers
• Corrales, D. C., Lasso, E., Figueroa, A., Ledezma, A., & Corrales, J. C. (2018). “Estimation of coffee rust infection and growth through two-level classifier ensembles based on expert knowledge”. International Journal of Business Intelligence and Data Mining (IJBIDM), 13(4), 369-387.
• Castillo, E., Corrales, D. C., Lasso, E., Ledezma, A., & Corrales, J. C. (2017). “Water quality detection based on a data mining process on the Cal-ifornia estuary”. International Journal of Business Intelligence and Data Mining, 12(4), 406-424. Parts of this work have been incorporated in this thesis, in Chapter 3.
• Corrales, D. C., Gutierrez, G., Rodriguez, J. P., Ledezma, A., & Corrales, J. C. (2017). “Lack of Data: Is It Enough Estimating the Coffee Rust with Meteorological Time Series?”. In International Conference on Computa-tional Science and Its Applications(pp. 3-16). Springer, Cham.
1.8. PUBLICATIONS
• Corrales, D. C., Corrales, J. C., Sanchis, A., & Ledezma, A. (2016). “Se-quential classifiers for network intrusion detection based on data selection process”. In Systems, Man, and Cybernetics (SMC) IEEE International Conference (pp. 001827-001832). IEEE Xplore.
• Castillo, E., Corrales, D. C., Lasso, E., Ledezma, A., & Corrales, J. C. (2016). “Data Processing for a Water Quality Detection System on Colom-bian Rio Piedras Basin”. In International Conference on Computational Science and Its Applications (pp. 665-683). Springer, Cham. Parts of this work have been incorporated in this thesis, in Chapter 3.
• Corrales, D. C., Figueroa, A., Ledezma, A., & Corrales, J. C. (2015). “An empirical multi-classifier for coffee rust detection in colombian crops”. In International Conference on Computational Science and Its Applications (pp. 60-74). Springer, Cham.
2. State of Art
This chapter presents the background related to the main topics addressed in this doctoral thesis. First, we explain the definitions: Data Quality Framework, Ontology and Case-Based Reasoning. Subsequently, we present the current lit-erature that discusses Data Quality Frameworks, Data cleaning Ontologies and Case-Based Reasoning Systems, particularly that which focuses on knowledge discovery tasks. For each topic of the literature review (Data Quality Frame-works, Data cleaning ontologies and Case-Based Reasoning Systems), we show the shortco mings of the related works, and we mention our contributions.
2.1
Background
In this section, we presented four definitions, the first, methodologies for knowl-edge discovery and the remain definitions are related to the main contributions: data quality framework, ontology, and case-based reasoning.
2.1.1
Methodologies for Knowledge Discovery
In this subsection, we describe the methodologies for knowledge discovery (KD) from data, which are the most frequently used in machine learning and data min-ing projects. Considermin-ing that data quality is the core of the PhD thesis, we high-light the phases of KD methodologies that involve an analysis of data quality. 2.1.1.1 Knowledge Discovery in Databases (KDD)
The authors in [22] defined the Knowledge Discovery in Databases (KDD) as “the process to find valid, novel, useful and understandable patterns in data, to describe/predict the future behavior of some event”. Thus, the KDD process con-siders five phases (Figure 2.1):
• Selection: this stage refers to selection and creation a data set on which discovery will be performed.
2.1. BACKGROUND
• Preprocessing: in this stage, data are cleaned. It includes handling missing values, removal of noise and outliers detection.
• Transformation: this stage finds useful features to represent the dataset fo-cused in the knowledge discovery task. The aim of this stage is to reduce the high dimensionality.
• Data Mining: in this stage, knowledge discovery tasks (classification, re-gression and clustering) are applied for pattern extraction.
• Interpretation/Evaluation: this stage involves the analysis of the extracted patterns and generated models from knowledge discovery tasks. In addition, the models are evaluated.
Figure 2.1: Phases of KDD process.
2.1.1.2 Cross Industry Standard Process for Data Mining (CRISP-DM) CRISP-DM is a methodology for data mining projects [13]. The life cycle of CRISP-DM consists of six phases (Figure 2.2):
• Business understanding: this phase focuses on understanding of the domain from data mining problem perspective.
• Data understanding: in this phase the data are collected and analyzed (iden-tification of data quality issues).
• Data preparation: this phase covers the activities related to construct the final dataset for the application of a knowledge discovery task.
2.1. BACKGROUND
• Modeling: depending of the knowledge discovery task selected, modeling techniques are used.
• Evaluation: in this phase, the models built in the Modeling phase are evalu-ated through performance measures.
• Deployment: this phase involves the deployment of the models in the real world.
Figure 2.2: Phases and generic tasks of CRISP-DM.
Each phase contains a set of tasks as show Figure 2.2. The generic tasks highlighted in red color, involve activities of data quality. For example, the tasks of “Data Understanding” phase, examine and visualize the data quality. In case of “Data Preparation” tasks, correspond to data preprocessing.
2.1.1.3 Sample, Explore, Modify, Model and Assess (SEMMA)
In addition to the CRISP-DM, the SAS Institute developed a methodology called SEMMA [23]. The acronym SEMMA stands for Sample, Explore, Modify, Model, Assess (Figure 2.3):
• This methodology begins with a statistically representative sample of the dataset (Sample).
• Subsequently, SEMMA applies exploratory statistical and visualization tech-niques (Explore).
2.1. BACKGROUND
• After, the methodology suggests the selection and transformation of the most significant predictive variables (Modify).
• Next, the model is built based on variables to predict outcomes (Model). • Finally, the model accuracy is evaluated (Assess).
Figure 2.3: Stages of SEMMA process.
The stages highlighted in red color in Figure 2.3, correspond to activities re-lated with data quality. Thus, the “Explore” stage, consists on the exploration of the dataset properties, and “Modify” stage is referred to modification of the data to focus the model selection process [23].
2.1.1.4 Data Science
Data Science refers to generalizable extraction of knowledge from data [24]. This process is focused in the representation, analysis of data, and relations among variables [25]. The data science process is composed with the next steps (Figure 2.4):
• The first stage involves the recollection of raw data (In Figure 2.4 Raw data is collected).
• Subsequently, the data scientist transforms the raw data into a format read-able for a data analysis tool (In Figure 2.4 Data is processed).
2.1. BACKGROUND
• The “clean data” phase comprises the detection and cleansing of data quality issues as outliers and missing values
• The “exploratory data analysis” phase refers to analyzing the dataset through statistical and visual methods to summarize the main dataset characteristics. • Machine Learning Algorithms and Statistical Models are selected for a
spe-cific knowledge discovery task in “Models and algorithms” phase
• In “Construction of reports” phase, the data scientist build reports of the raw and cleaning data, also of the algorithms and models used in previous phases.
• The last phase consist in build data product. This phase involves the deploy-ment in the real world (In Figure 2.4 Build data product).
Figure 2.4: Data science process. Source: [24]
The analysis of data quality is made in the phases: “Data processing”, “Clean data”, and “Exploratory data analysis” (in Figure 2.4 the steps highlighted in red color).
2.1.2
Data Quality Framework
Data are representations of the perception of the real world. They can be consid-ered the basis of information and digital knowledge [26]. Data quality is a critical factor to maintain consumers’ needs. The quality of data is defined by two related factors: how well it meets the expectations of data consumers [27] and how well it represents the objects, events, and concepts it is created to represent. In order to measure whether data meets expectations or is “fit for use” expectations and uses
2.1. BACKGROUND
need to be defined [7].
For ensuring data quality in data management systems, we need to consider two relative aspects in evaluating the quality of data: the actual quality that can be evaluated at the data source and the expected quality that is required by the users at the users’ views [28]. Authors in [29] affirm that the cost of poorly structured data produced in large amounts is solved by frameworks for the assessment of the data quality.
The Data Quality Frameworks seek to assess areas where poor quality pro-cesses or inefficiencies may reduce the profitability of an organization [30]. At its most basic, a data quality framework is a tool for the assessment of data quality within an organization [31]. The framework can go beyond the individual ele-ments of data quality assessment, becoming integrated within the processes of the organization. Eppler and Wittig [32] add that a framework should not only eval-uate, but also provide a scheme to analyze and solve data quality problems by proactive management.
A real case is presented by Deloitte Belgium [33]. This enterprise developed a Data Quality Framework to assess the data risks and data health. The framework analysis and provides insights into the root causes of poor data quality. Figure 2.5 presents the Data Quality Framework developed by Deloitte Belgium.
Figure 2.5: Conceptual Data Quality Framework developed by Deloitte Belgium. Source: [33]
This Framework is composed by four steps:
2.1. BACKGROUND
• Cleaning strategy: refers to planning to solve the data quality issues. • Cleaning enrichment: in this step, the methods and techniques for data
cleaning are applied.
• Monitoring: the aim of this step is to verify if the cleaned data to meet the expectations of data consumers.
Thus, in general terms, the view of data quality framework is more conceptual and it is used as a helpful map to provide solutions to data with poor quality in knowledge discovery tasks [34, 11]. The purpose of the framework presented in this doctoral thesis is connect more closely with the data analyst and potentially give them suggestions as to which data cleaning algorithms are the most suitable for data quality issues presented in different knowledge discovery tasks.
2.1.3
Ontology
The ontology term provenances from philosophy, where it is concerned with the nature of being and existence [35]. In artificial intelligence (AI) communities of ontologies are widely used and have many definitions; Gruber [36] provided a popular one: an ontology is an “explicit specification of a conceptualization”. The conceptualization represents a specific world view on the domain of interest [37] and it is composed of concepts, attributes, instances and relations between concepts:
• Concept, also called Class, it is a general representation of a group of Indi-viduals that share common features [38].
• Attribute is a feature of a concept [39].
• Instance, also named Individual, it is a specification of a concept [39]. • Relation describes the way in which individuals or concepts relate to each
other [38].
Figure 2.6 presents an Ontology example for classification and clustering mod-els. Thus, Classificationand Clusteringare subclasses of Model. Decision tree, Neural Network, Support Vector Machine, Naive Bayes, K Nearest Neighbor are individuals of Classification Class. Besides, Model and Dataset classes have a relation: “model is built with dataset”.
2.1. BACKGROUND
Figure 2.6: Example of Ontology for classification and clustering models. The blue circle represents the class individuals while the gray square depicts the classes. The dotted line represents a relation between two classes and the solid line means a hierarchical relation.
Several languages are used to describe ontologies such as Conceptual Graphs (CG) [40], Description Logics (DL) [41], First Order Logic (FOL) [42] and On-tology Web Language (OWL) [43].
OWL is the most popular language recommended by the W3C [43]. This language represents the ontology elements (classes, attributes, instances, relations, etc.) through different formats as XML, RDF, and RDF Schema (RDF-S) [44]. Thus, OWL has the ability to interpret the available content on the Web [45].
2.1.4
Case-based reasoning systems
Case-based reasoning (CBR) is a type of intelligent system that utilizes the knowl-edge acquired from past experiences (also they are named cases) to solve a given problem [46, 47, 20]. The main difference of Case-based reasoning from other reasoning techniques is that it does not lead from true assumptions to true conclu-sions. In other words, if the solution of a past case were correct for its original problem, this may not be the exact solution for a new problem. Therefore, the reuse of the past case may only be “close” to the correct solution of the new prob-lem. This means that applying CBR is a kind of approximate reasoning. In fact,
2.1. BACKGROUND
a CBR is essentially centered on retrieval of cases most similar to a new problem [48]. The general architecture of case-based reasoning systems is shown in Figure 2.7.
Figure 2.7: The general architecture of case-based reasoning systems. The cases are composed of a problem and solution and they are stored in a case-base. The CBR cycle is divided in four main steps:
• Retrieve: the purpose of retrieval phase is to search in the case-base a case or a small set of cases similar to the problem or current situation. In other words, the new caseCqis compared with cases of the case-base in order to
find the most similar past caseCt. This phase is strongly connected with the
case representation and the retrieval techniques. There are many retrieval techniques such as similarity measures and filtering cases [48]. The first consists in computing a similarity score for each case of the case-base and Cq. The second approach selects a set of cases of the case-base respect to
similarity criteria ofCq. In our CBR, we proposed a hybrid retrieval
mech-anism between similarity measures and filtering cases (Subsection 5.2). • Reuse: the solution of retrieved caseCtis selected as a solution to be reused
inCq. The reuse is simple when the new problem ofCq is equal to the
re-trieved case problem Ct. In otherwise, the solution ofCtrequires an
adap-tation supported in the knowledge of the domain [48].
• Revise: a solution is proposed (the adapted case in the reuse phase) to solve the new problem of Cq, and it is completed when it is confirmed. Revise
2.2. RELATED WORKS
aims to evaluate the applicability of the proposed solution in the real world [48]. When the CBR is evaluated in the real world, some aspects may not have considered in the model. This fact is named the frame problem in Artificial Intelligence when all objects of the real world cannot be modeled [49].
• Retain: if the solution of theCqis successful, then the case newCqis stored
in the case-base to be reused in the future.
For the CBR proposed, we included the Revise step into Reuse phase.
From the general architecture of case-based reasoning systems, the authors of [50] proposed different CBR families:
• Textual CBR: the cases are given as text in natural language [51].
• Knowledge-intensive CBR: a rich domain model is built for supporting small case-bases [50]. In other words, Knowledge-intensive CBR is ap-propriate when the developers do not have enough experiences available and the knowledge of the domain is represented through of models as on-tologies [52].
• Data-intensive CBR: the cases are the main source of information with no domain knowledge available [53].
• Distributed CBR: multi-agent systems collaborate to reach conclusions based on their particular case bases [54].
We built a CBR based on Knowledge-intensive due our case-base is composed of 56 cases. Thus, we proposed a Data cleaning ontology (Chapter 4) for case representation, also in Reuse phase, the Data cleaning ontology suggests similar solutions to the solution space of the retrieval case.
2.2
Related works
This section presents a review of the current literature around three major topic areas. The first section covers related works of frameworks in data quality. Sec-ond section concerns related works of ontologies for data cleaning. Finally, third section presents Case-based reasoning systems.
2.2. RELATED WORKS
2.2.1
Data Quality Frameworks
Several studies provided data quality frameworks in relational databases, concep-tual (theoretical guide process), health systems and big data. Table 2.1 presents a summary of the related works. Most of the works are from the relational databases and data warehouses.
Table 2.1: Related works: Data Quality Frameworks
Works Publication year Area
[55, 28, 56, 57, 58, 59] 2000 – 2015 Databases, Data warehouses [60, 61, 62] 2002 – 2018 Health systems [63, 64, 65, 66] 1995 – 2016 Conceptual
[67, 59] 2013 – 2015 Big data
Authors in [55] developed a data quality framework to customer relationship management problem in relational database. The framework is composed by two components:
• Validation design: validates the schema of the input data by: integrity con-straints, validation of overloaded table.
• Customer profiling: implements the necessary tables and data quality rules to capture customer preferences as: customer demographic data, and in-formation about a customer’s preferences for particular products, areas of interest, and customer activity.
Framework for a quality-driven mining rules is proposed in [28]. The main contributions are: (i) A quality of Data metadata (extension of Common Ware-house Metamodel) which stored data quality measures and cleansing methods de-scription (eliminating duplicates, handling inconsistencies, managing imprecise data, missing data, and data freshness). (ii) A method for scoring the quality of association rules that combines QoD measures. Data quality measures and cleans-ing methods are computed on SQL.
In [56] offers data cleansing process for relational databases: data transfor-mation, duplicate elimination and data fusion. Each data cleansing process is supported by four type of transformations:
• Mapping: produces records with a suitable format by applying operations such as column splitting.
2.2. RELATED WORKS
• Matching: searches pairs of tuples that contain the same real object.
• Clustering: creates groups based on high similarities among real objects and a set of criteria.
• Merging: applies to each individual cluster in order to eliminate duplicates or produce new records for the resulting integrated data source.
The work presented in [66] develops a framework for analyzing data quality research, and uses it as the basis for organizational databases. The framework consists of six elements:
• Management responsibilities: from the requirements of a client/company, data quality policies are defined.
• Research and development: this phase involves the selection of dimensions for assessing the data quality.
• Production: this task analyses the raw data based on set of quality dimen-sions.
• Distribution: this module organizes the data produced by manufacturing systems.
• Personnel management: this element assesses the data related with personal abilities as training, formal qualification and the motivation.
• Legal function: the aim of this module is to guarantee the data product safety through a traceability system.
DQ2S is a framework and tool for combining traditional data management with data profiling targeted at data cleansing described in [57]. The framework allows database users to profile their data while querying the database in a declar-ative way, in preparation for data cleansing, considering dimensions of data qual-ity, such as accuracy, completeness, timeliness and reputation. The quality-related data properties together with the data profiling algorithms represent the criteria un-der which data is assessed, measured and filtered, in accordance with definitions of data quality dimensions chosen and modeled by the user.
In [63] data quality framework is applied to monitor and improve the content in an e-government meta-data repository, using syntactic, semantic and pragmatic data quality metrics: (i) syntactic refers to validations with respect to a predefined schema and/or set of programmatic rules, (ii) semantic applies to conformance with the immaterial object or real world physical objects the data intends to rep-resent, (iii) pragmatic denotes the users perceived quality of the data.
2.2. RELATED WORKS
Framework based on indicators to measure the quality of Open Government Data was defined in [64]. Framework approach to define an open data quality measurement consists of three parts: (i) identification of the most suitable data quality model as theoretical support of the measurement framework e.g. Total data quality management (TDQM), The Data Warehouse Quality methodology (DWQ), Total information quality management (TIQM), (ii) methodology for the selection of data quality characteristics and metrics: completeness, expiration, understandability (iii) results on the selection of data quality characteristics and metrics: incomplete data, out-of-date data, lack of metadata.
Researches in [58] built a framework for data quality management of enter-prise data warehouse based on an object-oriented data quality model (OODQM). The data quality requirements (from dimensions: completeness, correctness, us-ability, currency, consistency, and relevance), the participators, the data quality checking object, and the possible data quality problems, form the core compo-nents of OODQM.
Other data quality frameworks are focused in health systems. For instance, [60] proposes a data quality assessment framework to electronic medical record when matching multiple data sources regardless of context or application. The first assessment phase defines variables of interest for matching multiple data sources. The second assessment identifies and assess if the analytical variables of interest are present and sufficiently represented in the multiple data sources to answer the research questions.
The authors in [61] proposed an initial framework for cloud-based health care systems and electronic health record. The process began with gathering data qual-ity dimensions in organizations and health care systems. In this step, literature review and dictionaries were used to avoid dimensions with the same implica-tion. The next step was to check whether the dimension was relevant to electronic health record content and requirements. The resulting dimensions were grouped into three categories considered the main elements of e-health care systems: in-formation, communication and security.
Framework