THREE ESSAYS ON CAPITAL MARKETS
A Dissertation
Presented to the Faculty of the Graduate School of Cornell University
in Partial Fulfillment of the Requirements for the Degree of Doctor of Philosophy
by Kai Wu
c
2018 Kai Wu
THREE ESSAYS ON CAPITAL MARKETS Kai Wu, Ph.D.
Cornell University 2018
This dissertation is a combination of three papers on capital markets.
The first chapter studies on the impact of cost of capital on corporate invest-ment and financing decisions. Previous literature shows that the implied cost of capital (ICC) has a negative effect on investment, while the factor model-based estimates have positive effects on investment. Our paper documents that these alternative cost-of-equity proxies also have opposite effects on equity issuance. We show that the ICC has negative effects on investment and equity issuance by capturing the firm-specific discount rate news, whereas the factor model-based estimates have positive effects on these decisions by capturing the market-wide cash flow news. Thus, the opposite effects of the ICC and factor-model based estimates can be explained by their distinctive information contents.
In the second chapter, I evaluate the economic consequences of advisory mis-conduct by estimating the effect of publicly disclosed regulatory actions of mu-tual fund advisors on fund flows. Based on a broad set of misconduct events from 2000-2013, I find a 5% reduction in fund flows to malfeasant advisors in one year following the misconduct. Further analysis using the 2001 SEC elec-tronic filing mandate as a positive shock to misconduct transparency corrob-orates these results. In order to mitigate the negative impact on flows, mutual fund companies tend to raise marketing expenditures, reduce contractual
incen-findings highlight the significant impact of misconduct on fund flows and ad-visory contracting in the mutual fund industry.
In the last chapter, we evaluate the effectiveness of Interfund Lending Pro-grams for both borrowing and lending funds in fund families. We find strong support for the positive effect for borrowing funds. Under extreme distress ILP-funds have 0.32% higher returns than non-ILP ILP-funds in the following week. Sub-sample analysis shows that the positive effect is mainly driven by equity and municipal funds, and the effect is more pronounced when funds hold illiq-uid assets, when external funding cost is high, and when fund families are more diversified in styles. Moreover, Interfund Lending Programs facilitate liquidi-ty management and reduce external borrowing activities. But we find limited evidence concerning the effectiveness for lending funds. Taken together, our results suggest that Interfund Lending Programs play a crucial part as internal capital market in fund families.
BIOGRAPHICAL SKETCH
Kai Wu was a Ph.D. student at the Dyson School of Applied Economics and Management, Cornell University from 2013-2018. He defended this dissertation in April 2018, and then became a faculty member at the Central University of Finance and Economics, Beijing, China.
Prior to entering Cornell for his Ph.D. degree, he graduated from Harbin Engineering University in 2010, with a bachelor degree in Management. During 2010-2013 he was a student at Wang Yanan Institute of Studies in Economics, Xiamen University.
ACKNOWLEDGEMENTS
I would like to express my gratitude to members of my dissertation com-mittee David Ng (Chair), Scott Yonker (Co-Chair) and Byoung-Hyoun Hwang for their insightful comments for this dissertation. Their comments improve the papers substantially. I also thank Andrew Karolyi, Pamela Moulton, Jawad Addoum, Yifei Mao, Fang Liu, Elizabeth Berger, Alan Kwan, Jordan Nickerson, Atif Mian, Justin Murfin, Francesco D’Acunto, and seminar participants at Cor-nell University for invaluable suggestions.
Additionally, I would like to thank the Dyson School of Applied Economics and Management for providing me with generous funding over the past years. My special thanks are dedicated to Graduate Field Assistant, Linda Sanderson, for her kindness and support. The Cornell Graduate School also offers me con-ference travel grants. I would also thank the U.S. Securities and Exchange Com-mission for providing me the Form-ADV data, which is a indispensable part of my job market paper.
Finally, I owe my greatest debt to my parents, friends and coauthors, who have encouraged and supported me when I face difficulties. The list includes, and is not limited to, Jianwei Xing, Zhenda Yin, Yang Zhang, Yanan Li, Pei Shao, Yili Lian, Soku Byoun, Hugh Hoikwang Kim, Qian Han, Haiqiang Chen, Jun-hua Wu, Juanjuan Huang, Ruyu Chen, Hui Wang, Jianjun Li, SJun-huai Ye, Chuchu Liang, Kaihang Shi, Xiaomeng Lu, Yixiao Wang.
TABLE OF CONTENTS
Biographical Sketch . . . iii
Dedication . . . iv
Acknowledgements . . . v
Table of Contents . . . vi
List of Tables . . . viii
List of Figures . . . x
1 Understanding the Effects of Alternative Cost-of-Equity Proxies on Corporate Investment and Financing 1 1.1 Data and Methodology . . . 9
1.1.1 Sample Construction . . . 9
1.1.2 The Proxies for the Cost of Equity . . . 9
1.1.3 Return Decomposition . . . 10
1.1.4 Summary Statistics . . . 12
1.2 Empirical Results . . . 13
1.2.1 The Cost of Equity and Corporate Investment . . . 13
1.2.2 The Cost of Equity and Net Equity Issuance . . . 14
1.2.3 Cash Flow News and Discount Rate News . . . 15
1.2.4 Behavior of the Cost-of-Equity Estimates around Reces-sions and Following Exogenous Events . . . 17
1.2.5 The Stock Market Information Channel . . . 20
1.3 Robustness Checks . . . 26
1.3.1 Mergers and Acquisitions (M&A) and Research and De-velopment (R&D) . . . 26
1.3.2 Error-in-Variable Consistent GMM . . . 27
1.3.3 Utilizing Fundamentals-basedq . . . 27
1.3.4 Controlling for Other Firm Characteristics . . . 28
1.3.5 Non-Recession Periods . . . 28
1.3.6 Long-term Effects . . . 29
1.4 Summary and Conclusion . . . 29
2 The Economic Consequences of Mutual Fund Advisory Misconduct 49 2.1 Introduction . . . 49
2.2 Data and Summary Statistics . . . 55
2.2.1 Data Sources . . . 55
2.2.2 Sample Construction . . . 57
2.2.3 Summary Statistics . . . 59
2.3 Empirical Results . . . 61
2.3.1 Predicting Mutual Fund Advisory Misconduct . . . 61
2.3.2 Panel Regression . . . 63
2.3.3 Event Study . . . 65
2.4 Further Discussions . . . 71
2.4.1 Fees and Contractual Incentives . . . 71
2.4.2 Investment Restrictions . . . 74
2.4.3 Advising Relationships . . . 76
2.4.4 Advisor Survival . . . 77
2.4.5 Advisor Performance . . . 78
2.5 Conclusion . . . 79
3 Are Interfund Lending Programs Effective? 103 3.1 Introduction . . . 103
3.2 Data and Methodology . . . 110
3.2.1 Data . . . 110 3.2.2 Methodology . . . 111 3.2.3 Summary Statistics . . . 113 3.3 Empirical Results . . . 115 3.3.1 Baseline Regression . . . 115 3.3.2 Sub-Sample Analysis . . . 116
3.3.3 Competitive VS. Cooperative Fund Managers . . . 121
3.3.4 Matched Sample . . . 123
3.3.5 Robustness Checks . . . 125
3.4 Further Discussions . . . 130
3.4.1 Comparison of Alternative Borrowing Channels . . . 130
3.4.2 Liquidity Management and External Borrowing Needs . . 131
3.5 Conclusion . . . 134
LIST OF TABLES
1.1 Descriptive Statistics and Variable Correlations . . . 33
1.2 Estimation Results of Investment Regressions . . . 35
1.3 Estimation Results of Net Equity Issuance Regressions . . . 36
1.4 Sensitivities of Investments and Net Equity Issuance to Cash Flow and Discount Rate News . . . 37
1.5 Sensitivities of Cost-of-Equity Proxies to Cash Flow News and Discount Rate News . . . 38
1.6 Sensitivities of Investments and Net Equity Issuance to Cash-Flow and Discount-Rate Expected Return Components . . . 39
1.7 Changes in Cost-of-Capital Estimates Prior to Recession Period . 40 1.8 Difference-in-Difference Estimation for Cost-of-Equity Proxies . 41 1.9 Price Informativeness and Investment/Financing Sensitivity . . 42
1.10 Equity Dependence and Investment/Financing Sensitivity to COE Proxies . . . 44
1.11 Estimation Results of Investment Regressions Including R&D and M&A Expenses . . . 46
1.12 Estimation Results of Investment/Financing Regressions with Additional Controls . . . 47
2.1 Summary Statistics . . . 86
2.2 Predicting Mutual Fund Advisory Misconduct . . . 87
2.3 Mutual Fund Advisory Misconduct and Advisors’ Aggregate Flows . . . 88
2.4 Aggregate Fund Flows Around The SEC Electronic Filing Mandate 91 2.5 Robustness Checks: Excluding 2003-2005 Market Timing/Late Trading Scandals . . . 95
2.6 Robustness Checks: Quarterly Flows . . . 96
2.7 Robustness Checks: Omitted Variable Bias . . . 97
2.8 Post-Misconduct Changes in Fees and Contractual Incentives . . 98
2.9 Post-Misconduct Changes in Investment Restrictions . . . 99
2.10 Misconduct and Advisor Replacement . . . 100
2.11 Misconduct and Advisor Survival . . . 101
2.12 Misconduct and Advisor Performance . . . 102
3.1 Style-Wide Distress Events . . . 142
3.2 Summary Statistics . . . 143
3.3 Effectiveness of Interfund Lending Programs: Baseline Regression 144 3.4 Effectiveness of Interfund Lending Programs by Board Invest-ment Style . . . 145
3.5 Effectiveness of Interfund Lending Programs Conditional on Credit Market Liquidity . . . 146
3.6 Effectiveness of Interfund Lending Programs Conditional on Intra-Family Style Diversity . . . 148
3.7 Competitive VS. Cooperative Fund Managers . . . 150
3.8 Effectiveness of Interfund Lending Programs around Collapse of Lehman Brothers . . . 152
3.9 Robustness Checks: Defining Distress Events with Broad CRSP Investment Styles . . . 155
3.10 Robustness Checks: Defining Distress Events with N-SAR In-vestment Styles . . . 156
3.11 Robustness Checks: Defining Distress Events with Fixed Return Thresholds . . . 157
3.12 Robustness Checks: Excluding Financial Crisis Period . . . 158
3.13 Robustness Checks: ILP Application . . . 159
3.14 Robustness Checks: Additional Control Variables . . . 160
3.15 Liquidity Management and External Borrowing . . . 161
3.16 Comparison Between Interfund Lending Program and External Borrowing . . . 162
A.1 Variable Definitions . . . 166
A.2 Erickson & Whited Errors-in-Variables GMM . . . 167
A.3 Controlling for Cummins et al. (2006)’s Real Q . . . 168
A.4 The Performance of COE Proxies in Recession / Non-Recession Period . . . 169
A.5 Long-term Effects of the Cost-of-Equity Proxies . . . 170
A.6 Breakdown of Advisory Misconduct . . . 172
A.7 Examples of Mutual Fund Advisory Misconduct Cases . . . 173
A.8 Variable Definitions . . . 174
A.9 Variable Definitions . . . 175
A.10 Interfund Lending Program: Application and Order Date . . . . 176
LIST OF FIGURES
1.1 Times Series Patterns of the Cost-of-Equity Proxies . . . 32
2.1 Organization Structure of Mutual Fund Advisory Business . . . 82
2.2 Mutual Fund Advisory Misconduct Cases Over Time . . . 83
2.3 Effect of Mutual Fund Advisory Misconduct on Flows . . . 84
2.4 Advisors’ Cumulative Aggregate Flows Around The Mandate . 85
3.1 Number of Distressed Funds . . . 136
3.2 Number of ILP and External Borrowing Funds in Distress . . . . 137
3.3 Effectiveness of Interfund Lending Programs . . . 138
3.4 Effectiveness of Interfund Lending Programs for Borrowers . . . 139
3.5 Effectiveness of Interfund Lending Programs for Lenders . . . . 140
3.6 Effectiveness of ILP for Matched Sample . . . 141
CHAPTER 1
UNDERSTANDING THE EFFECTS OF ALTERNATIVE COST-OF-EQUITY PROXIES ON CORPORATE INVESTMENT AND FINANCING
The CAPM and the (Fama and French, 1992, 1993) model (FFM) are current-ly the standard textbook choices for estimating the cost of equity. Yet, there is mounting skepticism over their application for capital budgeting decisions from both academic researchers and practitioners. For instance, Levi and Welch (2014) contend that factor model-based estimates are useless for capital bud-geting purposes as they predict subsequent returns with a wrong sign. Hackel (2011) also raises doubt about using factor models in estimating the cost of eq-uity.
Recent literature suggests the implied cost of capital (ICC) as an alternative way of estimating the cost of equity, by equating the stock price to the present value of expected future cash flows.1 Frank and Shen (2016) document that the
ICC has the anticipatednegativeeffect on investment. They also show, however, that the factor model-based estimates havepositive effects on investment. Our paper contributes to understanding the puzzling opposite effects of alternative cost-of-equity proxies on investment by investigating the nature of their infor-mation contents.
1The ICC has been used in various contexts, especially in asset pricing. For example,
previ-ous papers use the ICC to study: the unconditional equity premium (Claus and Thomas (2001) and Fama and French (2002)); stock market return predictability (Li et al. (2013)); theories on betas (Kaplan and Ruback (1995), Botosan (1997), Gebhardt et al. (2001), Gode and Mohanram (2003), Brav et al. (2005), and Easton and Monahan (2005)); international asset pricing (Lee et al. (2009)); default risk (Chava and Purnanandam (2010)); cross-sectional expected returns (Hou and Van Dijk (2010), Botosan et al. (2011)); stock return volatility (Friend et al. (1978)); and the cost of equity (Burgstahler et al. (2006), Botosan and Plumlee (2005), and Hughes et al. (2009)).
According to Abel and Blanchard (1986), investment is affected negative-ly by discount rates and positivenegative-ly by expected cash flows. In particular, they
show that the discount rate and the marginal profit components of Tobin’s q
have significant and opposite effects on investment beyond q. Accordingly, if the discount rate drives the stock return, the expected stock return will show a negative effect on investment because an increase in the discount rate implies higher expected return (Campbell et al. (2010)) and low investment (Abel and Blanchard (1986)). When the stock return is driven by cash flow growth, how-ever, the expected stock return will have a positive effect on investment (Fama (1990) and Schwert (1990)). Thus, whether the ICC and factor model-based es-timates capture the shocks to expected cash flows or discount rates is critical in understanding their opposite effects on corporate investment.
The ICC is designed to capture the firm-specific discount rate as demonstrat-ed in Pastor et al. (2008) and Chen et al. (2013). Factor model-basdemonstrat-ed estimates, however, may be related more to cash flows and market-wide information. For instance, Vuolteenaho (2002) find that firm-level stock returns are mainly driven by cash flow news rather than by discount rate news. Campbell and Vuolteena-ho (2004) find that the required return on a stock is determined by permanent cash flow shocks to the market and the temporary shocks to the market discount rate. Chen et al. (2013) show that the common variation in stock returns is driv-en more by cash flow news than discount rate news. Moreover, Campbell et al. (2010) suggest that the systematic risks of value and growth stocks are deter-mined by the properties of their cash flow fundamentals. Patton and Verardo (2012) also suggest that betas reflect the revised expectations about the prof-itability of the aggregate economy. These studies imply that factor model-based estimates may capture more of cash flow news that are related to the aggregate
economy or market-wide shocks.
Given the current state of the literature on the cost of equity, the focus of our investigation is twofold: 1) whether the cash flow or discount rate news is re-flected on the cost-of-equity proxies and corporate investment; and 2) whether private or market-wide information drives the link between the cost-of-equity proxies and corporate investment. To this end, we also explore the equity fi-nancing channel because Morck et al. (1990) and Baker et al. (2003) suggest that the key channel for the cost of equity to affect corporate investment is through the issuance of new equity. Given that the cost of equity is a critical input from the stock market in the capital budgeting process, the equity financing channel may help us better understand the information contents of cost-of-equity prox-ies, particularly in the presence of asymmetric information. Moreover, the link between cost-of-equity proxies and equity issuance has not yet been explored.
Following Chen et al. (2013) and Campbell and Shiller (1988), we decompose realized stock returns into two components; discount rate news and cash flow news. We confirm that cash flow news has positive effects, while discount rate news has negative effects, on investment and equity issuance decisions. We then show that ICC measures are associated positively with discount rate news and negatively with cash flow news, whereas factor model-based estimates are asso-ciated negatively with discount rate news and positively with cash flow news. Furthermore, using the Campbell and Vuolteenaho (2004) two-beta model and similar decomposition of other factors, we find that corporate investment and equity issuance decisions are mainly driven by the bad beta which reflects news
mainly from market-wide cash flow news. Thus, the opposite effects of the ICC and factor model-based estimates on investment and financing decisions can be attributed to the ways they reflect cash flow news and discount rate news.
To further understand the link between the cost-of-equity proxies and dis-count rate news/cash flow news in more controlled settings, we also examine their behavior around recessions and following exogenous shocks. The reces-sion periods are characterized by the heightened uncertainty and risk averreces-sion of investors with diminishing cash flows (Gonz´alez-Hermosillo (2008), Coudert and Gex (2008), and Frank and Goyal (2009)), which implies positive discount rate shocks and negative cash flow shocks. Our results show that, prior to re-cessions, ICC measures steeply increase, reflecting mainly positive discount rate shocks, whereas factor model-based estimates exhibit steep decreases, reflecting mainly negative cash flow shocks. These results suggest that the ICC captures mainly the discount rate news, while factor model-based estimates capture the cash flow news.
We also utilize Taxpayer Relief Act of 1997 and the Jobs and Growth Tax Re-lief Reconciliation Act of 2003 as exogenous shocks to the discount rate. Dhaliw-al et Dhaliw-al. (2007) and Dai et Dhaliw-al. (2013) show that these legislations have reduced the cost of equity for financially constrained firms. We find that, following these leg-islations, ICC measures decrease, while factor model-based estimates increase, especially for financially constrained firms whose investment and financing de-cisions are most likely to be sensitive to the discount rate shock. Again, these findings indicate that the ICC captures mainly the discount rate shock, while factor model-based estimates capture the cash flow effect of the discount rate shocks.
The effect of the cost of equity on investment through the external financ-ing channel is expected to be more pronounced for firms with greater financial constraint/equity dependence (Baker et al. (2003)). Accordingly, we examine the effects of the cost-of-equity proxies on net equity issuance as well as in-vestment, conditional on firm’s equity dependence. We find that the ICC has significant and negative effects on equity issuance and investment for equity-dependent firms. The factor model-based estimates do not show significant effects on these decisions for equity-dependent firms. Instead, they show posi-tive effects on investment and equity issuance for less equity-dependent firms. These results suggest that the ICC, reflecting mainly the firm-specific discoun-t radiscoun-te news, has significandiscoun-t effecdiscoun-ts on invesdiscoun-tmendiscoun-t and financing decisions, for firms that are more likely to be sensitive to the discount rate news. In contrast, the factor model-based estimates appear to predict investment and financing decisions positively for less equity-dependent firms by reflecting fundamentals affecting cash flows. These results suggest that the ICC and factor-model based estimates may also differ in another dimension: whether they reflect the private or public information.
Chen et al. (2007) suggest that investment decisions respond to stock prices as firms are informed about their investments from the stock market. The main driver of such an information feedback channel is private information which is the component of stock return that is not explained by the market and indus-try portfolio. Consequently, we test whether the effects of the ICC and factor model-based estimates on investment and financing decisions are through the private or public information channel. Our findings show that the ICC has
sig-icant and positive effects for firms with less private information.
We further examine the effects of the ICC and factor model-based estimates on investment including M&As (and R&D), because previous studies suggest that these investments are particularly affected by private information on s-tock valuation.2 We find that the ICC has significant and negative effects on
this broadly defined investment, whereas factor model-based estimates show insignificant effects. These findings suggest that firms’ investment decisions are particularly sensitive to private information on the discount rate. We further address errors-in-variable issues regardingqand cost-of-equity proxies, utilize fundamentals-basedq, control for other firm characteristics, and consider alter-native specifications. Our results remain robust.
Taken together, our results suggest that the opposite effects of the ICC and factor model-based estimates on corporate investment and financing decisions can be explained by their distinct information contents. The ICC has negative effects on investment and financing decisions as it contains information about the firm-specific discount rate. Its main effects are found for firms with more equity dependence and more private information whose decisions are likely to be most sensitive to the discount rate news. In contrast, factor model-based estimates contain information about market-wide cash flows and have positive effects on investment and equity issuance for firms with less equity dependence and less private information.
Our findings have important implications for finance instructors and re-searchers. We teach students that capital budgeting decisions involve estimat-ing cash flows from a project, and then applyestimat-ing the cost of capital from capital
2For example, see Shleifer and Vishny (2003), Rhodes-Kropf and Viswanathan (2004),
markets as the discount rate or the hurdle rate. Our results suggest that the ICC is close to the effective cost of equity managers come up with after considering the market conditions and expected cash flows. In contrast, factor model-based estimates contain information about market-wide expected cash flows. In this regard, factor models miss out some important information on the discount rate, especially for firms whose investment and financing decisions are most sensi-tive to it.
Our paper is related to the literature on estimating the cost of equity. The cost of equity is indispensable for capital budgeting but the current practice of estimating it remains controversial. Levi and Welch (2017) maintain that fac-tor models fail because they are based on common inputs for facfac-tor exposures estimated from historical observations.3 Our results suggest that factor models
do not capture the firm-specific discount rate but market-wide cash flow infor-mation. Frank and Shen (2016) argue that both the ICC and factor-model-based estimates, despite their opposite effects, provide relevant and independent in-formation for corporate investment. However, they remain agnostic as to the information contents of these cost-of-equity proxies. Our study contributes to the literature by showing the nature of information conveyed by these alter-native proxies and by explaining their opposite effects. Levi and Welch (2017) argue that one obstacle to abandoning factor models may be the absence of an alternative. We suggest that the ICC could be a practical alternative to factor models.
fac-ed returns are negatively correlatfac-ed with each other. Moreover, they show that the survey expectations are more consistent with investors’ actual behavior like mutual fund inflows. Gennaioli et al. (2016) further show that the survey expec-tation of earnings also affects corporate investment. Consistent with these find-ings, our results suggest that the ICC, reflecting the forward-looking discount rate based on the analysts-surveyed expected cash flows, negatively affect cor-porate investment and financing decisions, while factor model-based estimates show opposite effects.
Our study is also linked to the q-model theory with the interdependence of investment and financing decisions (for example, Gomes (2001) and Bolton et al. (2011)). This theory suggests that external financing costs due to asymmet-ric information and managerial incentive problems have impact on investment beyond q. Consistent with the theory, our findings suggest that the ICC is highly informative beyond q, particularly about the risk of investment opportunities.
We also contribute to the literature on private information in stock price for investment decisions. For example, previous studies conjecture that the stock market affects corporate investment as it informs managers about real variables (Dow and Gorton (1997), Subrahmanyam and Titman (1999), Dow and Rahi (2003), Chen et al. (2007), and Goldstein and Guembel (2008)).4 Our findings
suggest that the discount rate implied by the stock price is particularly impor-tant information for managers to assess investment and financing decisions. By capturing the firm-specific discount rate, the ICC informs managers about the market’s assessment of the firm’s project risk, which they incorporate in their investment and financing decisions.
4Bond and Goldstein (2011) provides an excellent review on the real effects of financial
1.1
Data and Methodology
1.1.1
Sample Construction
Our initial sample consists of US firms from the Center for Research in Securi-ty Prices (CRSP)/ Compustat Merged Database from 1985 to 2013. We obtain the stock price, the number of shares outstanding, the SIC code, monthly re-turns from CRSP, firm-level annual accounting data from Compustat, analysts’ earnings forecasts from I/B/E/S, and the nominal GDP growth rates from the Bureau of Economic Analysis. We exclude firms operating in regulated utilities (SIC code 4000-4999) and financial industries (SIC code 6000-6999). We further drop firm-year observations with negative sales or total assets. Since comput-ing ICCs requires analysts’ earncomput-ings forecasts, the number of firms with valid information is reduced to 40,123 firm-year observations.
1.1.2
The Proxies for the Cost of Equity
We estimate the cost of equity using the CAPM, the Fama and French (1992, 1993) 3-factor model (FF3M), and the 4-factor model (FF4M, Carhart (1997)). There is no consensus about the computing procedure of the ICC in the liter-ature. Each study makes its own specific assumptions to facilitate the compu-tation of the ICC. We compute the ICC in three different ways for each firm, following the procedures utilized by Claus and Thomas (2001) (ICC-CT),
Geb-1.1.3
Return Decomposition
We first follow the methodology of Chen et al. (2013) to decompose the realized return into two components: (1) cash flow news (CFN), defined as the price change holding the discount rate constant, and (2) discount rate news (DRN), defined as the price change holding the cash flow forecasts constant. Specifical-ly, the stock return between monthtandt+1can be written as follows:
ri,t = Pi,t+1−Pi,t Pi,t = f ci,t+1,di,t+1− f ci,t,di,t Pi,t =CFNi,t−DRNi,t, (1.1)
where f(·)is the discounted cash flow function, andci,tanddi,tare the cash flow
forecast and the discount rate of firm iat month t, respectively. The cash flow news (CFN) and discount rate news (DRN) could be expressed as:
CFNi,t = 1 2 " f ci,t+1,di,t+1− f ci,t,di,t+1 Pi,t + f ci,t+1,di,t− f ci,t,di,t Pi,t # (1.2) DRNi,t =− 1 2 " f ci,t,di,t+1− f ci,t,di,t Pi,t + f ci,t+1,di,t+1− f ci,t+1,di,t Pi,t # . (1.3)
We compound the monthlyCFN and DRN to annualize over the firm’s fiscal
year. Since this methodology uses earnings forecasts and stock prices, it iden-tifies forward-looking cash flow news and discount rate news by construction (Chen et al. (2013)). The ICC is also based on earnings forecasts and stock price. Therefore, to ensure that our results are not spuriously induced by common earnings forecasts, we also consider alternative methodology.
Campbell and Shiller (1988) develop an alternative methodology to decom-pose the stock return intoCFN (related to future dividends) and DRN (related to the discount rate). The basic idea is to predict cash flows and discount rate
use the vector autoregression (VAR) to generate a forecast of cash flows and dis-count rates. Vuolteenaho (2002) further develop this methodology to be based on the unexpected return. In particular, omitting the firm subscripti, the unex-pected return can be expressed as
rt−Et−1(rt)=CFNt−DRNt. (1.4)
Following Vuolteenaho (2002), we estimate the components of equation (1.4) with the following VAR system of log-linear dynamic equations:
rt =α1rt−1+α2roet−1+α3bmt−1+η1t (1.5)
roet =β1rt−1+β2roet−1+β3bmt−1+η2t (1.6)
bmt =γ1bmt−1+γ2roet−1+γ3bmt−1+η3t. (1.7)
whereris market-adjusted log stock return,roeis market-adjusted log return on equity, andbmis the market-adjusted log book-to-market ratio. This approach uses ROE as the basic cash flow fundamental to predict cash flows and discount rate.
The Campbell and Shiller (1988) approach provides a decomposition of the unexpected total equity returns, whereas the Chen et al. (2013) approach pro-vides a decomposition of the total capital appreciation on a stock (including
both expected and unexpected capital appreciation). SeparatingDRN andCFN
from the stock return allows us to examine whether and how distinctively
cost-of-equity proxies captureDRN andCFN. According to the Abel and Blanchard
(1986) model,CFNis expected to have a positive effect, while DRN is expected to have a negative effect, on investment.
1.1.4
Summary Statistics
Panel A in Table 1.1 provides the summary statistics for the sample. The average (median) capital expenditure (CAPX) is 6.8% (4.6%) of total assets. The average net equity issuance is 11.2% of total assets and the median is mere 0.8%. Thus, firms engage in fairly active capital investment activities, while issuing equi-ty lumpily and less frequently. The average ICC ranges from 9.8% (ICC-GLS) to 14% (ICC-LNS), while the factor model-based estimates range from 11% to 12.1%.
We report the correlation matrix for our estimates on Panel B. ICC measures and factor model-based estimates are highly correlated among themselves, re-spectively, but there are also significant positive correlations between factor model-based estimates and ICC measures. ICC measures have significant and positive correlations with the discount rate news but show mixed correlations with cash flow news. The CAPM estimate also shows positive correlation with the discount rate news, whereas the FFM estimates show little correlation with the discount rate news. Both the CAPM and the FFM estimates show little cor-relation with cash flow news.
1.2
Empirical Results
1.2.1
The Cost of Equity and Corporate Investment
In order to investigate the effect of each of the cost-of-equity proxies on corpo-rate investment, we start with the following baseline regression model:
Ii,t =α0+α1Rei,t−1+α2CFi,t+α3Qi,t−1+ηt+θi+εi,t, (1.8)
where subscripts iand trepresent firm and time, respectively. I is investment (capital expenditure scaled by beginning-of-the-year assets), Re is the cost-of-equity proxy, CF is cash flow divided by total assets, and Q is Tobin’s q. We also include firm fixed effects θi and year effects ηt in order to control for
un-observable firm-specific characteristics and general economic trends. Detailed definitions of variables are provided in Appendix B.
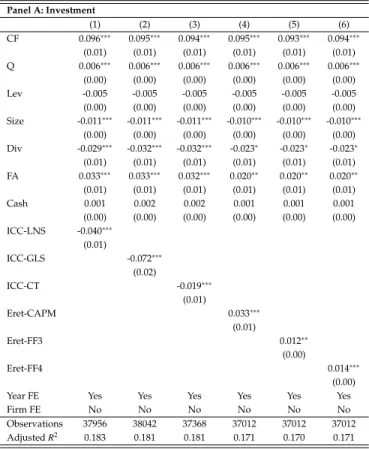
Table 1.2 reports the estimation results of investment regression (1.8). The co-efficient estimates on all ICC measures are significant and negative, suggesting that firms invest less when the cost of equity is higher. In contrast, the coef-ficient estimates on factor model-based estimates are positive and significant, suggesting that firms invest more when the cost of equity is higher. The results also show thatCF and Q have significant and positive effects on investment, consistent with previous results.
In order to examine whether the ICC absorbs the explanatory power of factor model-based estimates, or vice versa, we simultaneously include both the ICC
Our findings confirm the opposite effects of the ICC and factor model-based estimates on investment documented by Frank and Shen (2016). In the next sec-tion, we also examine their effects on equity issuance. Given that equity financ-ing is a key channel for the effect of the cost of equity on investment (Morck et al. (1990) and Baker et al. (2003)), it is interesting to see if firms’ equity issuance is also similarly affected by these alternative cost-of-equity estimates. Moreover, the literature has not yet explored this link.
1.2.2
The Cost of Equity and Net Equity Issuance
In Table 1.3, we investigate the effects of the cost-of-equity proxies on net equity issuance using the same regression model of (1.8) with the dependent variable replaced by net equity issuance. The coefficient estimates on ICC mea-sures are all significant and negative, whereas the coefficient estimates on factor model-based estimates are positive and significant. The results also suggest that
CF andqhave positive effects on net equity issuance.
Our findings of the negative relations between the ICC and investment/net equity issuance suggest that firms increase their equity issuance and investment when the cost of equity is relatively low. Factor model-based estimates, howev-er, show opposite effects. Thus, the ICC and factor model-based estimates con-tain information relevant not only for investment but also for equity issuance. In the next section, we try to understand the nature of information conveyed by these estimates and their opposite effects on investment and equity issuance.
1.2.3
Cash Flow News and Discount Rate News
In order to understand the contradicting effects of the ICC and factor model-based estimates, we examine their relations with the cash flow news (CFN) and
discount rate news (DRN). We first examine howCFN and DRN affect
invest-ment and net equity issuance based on the following regression model:
Yi,t = β0+β1CFi,t+β2Qi,t−1+β3CFNi,t−1+β4DRNi,t−1+ηt +θi+εi,t. (1.9)
whereYi,t is either investment or net equity issuance as used before.
Table 1.4 reports the estimation results for both investment and equity is-suance. In all regressions, the coefficient estimates on CFN are positive and significant, while those on DRN are negative and significant. The results are similar whether we use the Chen et al. (2013) or Campbell and Shiller (1988) ap-proach for theCFN-DRNdecomposition. Thus, these findings confirm that CFN has positive effects, while DRN having negative effects, on investment and eq-uity issuance decisions. These findings are consistent with Abel and Blanchard (1986) who find that the cash flow and discount rate components ofqstill show significant effects when added to theq-investment regression.
Given the findings of the opposite effects of CFN and DRN on investment
and equity issuance, we now examine how cost-of-equity proxies are associated withCFN/DRN with the following regressions:
similar results. ICC measures reflect both theCFNandDRN. The coefficient es-timates on DRN are positive and significant, while those onCFN are negative and significant, which suggests that the positive discount rate news and the neg-ative cash flow news are associated with higher ICC. For the CAPM estimate,
however, the coefficient estimates on both DRN and CFN are not significant.
Moreover, for the FFM estimates, the coefficient estimates onDRNare negative, while those onCFNare positive.
Next, we examine if the cash flow component of factor model-based esti-mates indeed drive investment/financing decisions. To this end, we follow Campbell and Vuolteenaho (2004) who develop the two-beta model in which the CAPM beta is broken into two components, one reflecting news on the mar-ket’s future cash flows (“bad beta”) and one reflecting news on the marmar-ket’s dis-count rate (“good beta”). Following their approach, we decompose the CAPM estimate into two components in order to examine their respective effects on investment and equity issuance. We also estimate cash flow and discount rate betas for each of MKT, SMB, HML and UMD factors separately, and then use the sum of the products of cash flow (discount rate) betas and corresponding fac-tor premiums as the cash flow (discount rate) component of the FFM expected returns.
The results in Table 1.6 show that investment and equity issuance are mainly driven by the “bad beta” reflecting news about future cash flows. Similarly, for the FFM estimates, the cash flow component is the main driver for their effect-s on corporate inveeffect-stment and financing decieffect-sioneffect-s. Thueffect-s, the poeffect-sitive effecteffect-s of the factor model-based estimates on investment and equity issuance appear to be driven by the part of the expected return associated with the market’s
cash flow news. These findings are consistent with previous studies showing that stock returns and betas in factor models are associated with relatively more cash flow news than discount rate news (Vuolteenaho (2002), Campbell and Vuolteenaho (2004), Campbell et al. (2010), and Chen et al. (2013)).
In sum, the findings in this section suggest that the discount rate news and cash flow news contained in the ICC and factor model-based estimates may ex-plain their opposite effects on investment and equity issuance. We also observe that both the discount rate and cash flow news have significant but opposite ef-fects on some of the cost-of-equity proxies. Given that the discount rate and cash flow components tend to move cyclically together (Abel and Blanchard (1986)), it is possible that the cost-of-equity proxies spuriously appear to capture both the discount rate and cash flow news when they in fact capture mainly one of them. In order to test for this suspected channel in more controlled settings, we examine their behavior around recessions and following exogenous events in the next section.
1.2.4
Behavior of the Cost-of-Equity Estimates around
Reces-sions and Following Exogenous Events
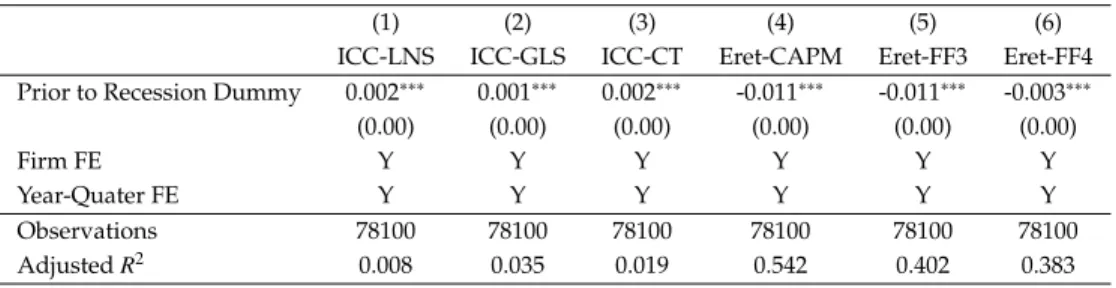
Recessions are characterized by heightened uncertainty and risk aversion of in-vestors (Gonz´alez-Hermosillo (2008), Coudert and Gex (2008), and Frank and Goyal (2009)), which increases the risk premium and thereby the discount rate. Firms may also face lower cash flows during recessions. If a cost-of-equity
prox-the discount rate news or prox-the cash flow news by examining prox-their movements prior to recessions.
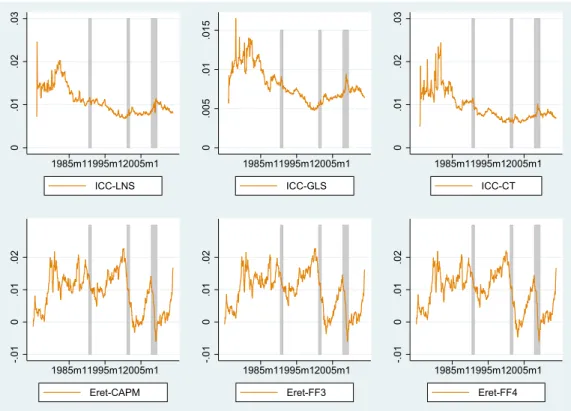
We first plot the time trends of the cost-of-equity proxies in Figure 1.1. IC-C measures tend to increase prior to the highlighted recession periods, while factor model-based estimates show the opposite trend. ICC measures appear to reflect the discount rate news, while factor model-based estimates appear to reflect the cash flow news stemming from the diminishing profitability during recessions.
In table 1.7, we run panel regressions with firm and year-quarter fixed ef-fects, to test if the ICC and factor model-based estimates indeed show opposite movements prior to recessions. Our main interest is the coefficient estimate on the dummy variable for the quarter prior to recession periods. The results clear-ly show that the ICC increases significantclear-ly prior to recessions capturing the dis-count rate shocks, whereas factor model-based estimates decrease significantly prior to recessions capturing the cash flow shocks.
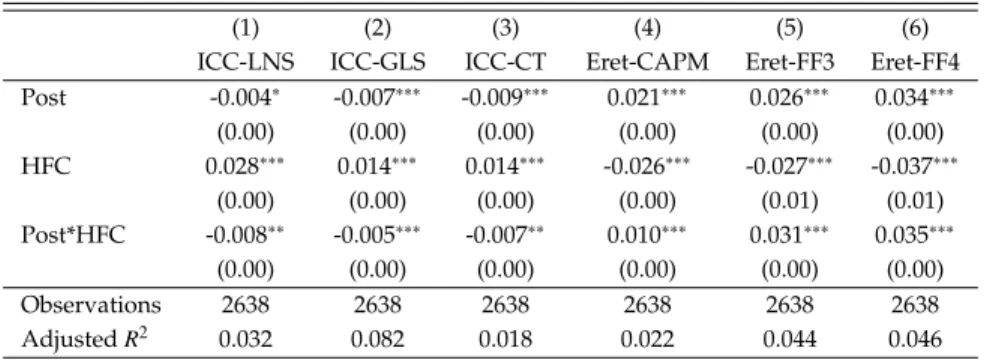
Taxpayer Relief Act of 1997 (TRA) and the Jobs and Growth Tax Relief Rec-onciliation Act of 2003 (JGTRRA) provide tax cuts in capital gains, raising the effective after-tax return for equity investors and thereby increasing the supply of equity capital. These legislations are likely to affect the cost of equity, in-dependent of firms’ decisions. Moreover, these tax cuts are not likely to have immediate impacts on firms’ cash flows. Accordingly, we use these tax cuts to have a clean test whether the ICC and factor model-based estimates capture the discount rate news or not. The effects of the tax cuts on the cost of equity will depend on the elasticity of capital demand. With perfectly inelastic demand, the cost of equity will be reduced by the tax cut. With perfectly elastic demand,
the cost of equity will not change. Since financially constrained firms have low demand elasticity of equity capital, they are expected to experience a larger re-duction in the cost of equity following the tax cuts. Indeed, Dhaliwal et al. (2007) and Dai et al. (2013) show that these tax cuts have reduced the cost of equity particularly for financially constrained firms. Thus, we hypothesize that the cost-of-equity estimates will capture the discount rate shocks for financially constrained firms.
We test the hypothesis with the following difference-in-difference (DID) re-gression:
Rei,t = α0+α1Postt+α2HFCi+α3Postt×HFCi+εit, (1.11)
where Postis a dummy variable that takes 1 if it is the third quarter of 1997 or 2003, and 0 if it is the first quarter of 1997 or 2003 (skipping the announcement quarter). HFC is a dummy variable which takes value of 1 if the firm is on the top 30% of financial constraint (FC) at the beginning of the year, defined as in Hadlock and Pierce (2010):5
FCi,t = 0.737×Sizei,t+0.043×Size2i,t−0.04×Firmagei,t. (1.12)
whereS izeis the log of total assets (replaced with log($4.5 billion) if the actual value exceeds this threshold) andFirmageis the number of years since the firm’s initial public offering (replaced with 37 if it exceeds 37).
Table 1.8 presents the estimation results of the DID regressions. The coeffi-cient estimates onPost are negative and significant for all three ICC measures, indicating that the cost of equity becomes lower following the discount rate
suggest that after the adoption of TRA and JGTRRA, the cost of equity decreased significantly more for financially constrained firms than for non-constrained firms. For factor model-based estimates, however, the coefficient estimates on
Postand Post∗HFCare all significant and positive, suggesting that the cost of equity is higher following the discount rate shocks and especially for financially constrained firms.
The results in Table 1.8 verify that the ICC captures the discount rate shocks, while factor model-based estimates capture the cash flow effects of the discount rate shocks. In the next section, we try to understand whether and how such in-formation flows from the stock market to managers who make investment and financing decisions. More specifically, we want to see if the ICC contains firm-specific information on the discount rate, while factor model-based estimates contain market-wide information on cash flows from the stock market.
1.2.5
The Stock Market Information Channel
In the perfect market, q should be sufficient information for investment deci-sion (Abel and Blanchard (1986)). In the presence of market frictions such as information asymmetry and external financing constraints, however, manag-er may look to additional information when making investment and financing decisions. Given that the cost of equity essentially reflects the market’s assess-ment of the firm-specific risk contained in the stock price, a cost-of-equity proxy should inform managers about the market’s assessment of their firms’ risk or discount rate when making investment and financing decisions. Consequently, in this section, we seek to understand the information contained in the
cost-of-equity proxies by investigating their effects on investment and cost-of-equity issuance in relation to such market frictions. In particular, we investigate if the effects of alternative cost-of-equity proxies on investment and equity issuance can be explained by the information channel from the stock market to managers.
Even though the stock price-investment link has been well documented, the literature does not agree on its cause. On the one hand, Baker et al. (2003), Gilchrist et al. (2005), and Polk and Sapienza (2009) show significant effects of mis-pricing on investment. In particular, Baker et al. (2003) suggest that finan-cially constrained or equity-dependent firms’ investment is espefinan-cially sensitive to mispricing in the stock market. On the other hand, Dow and Gorton (1997), Subrahmanyam and Titman (1999), and Chen et al. (2007) suggest that such ef-fects of stock price on corporate investment reflect private information as man-agers are informed about their investments from the stock market. Moreover, Bakke and Whited (2010) suggest that corporate investment does not respond to stock-market mispricing nor private information but to legitimate informa-tion (q) contained in stock price movement. Nonetheless, these studies agree at least on the finding that the stock price-investment link is more pronounced for equity dependent firms and private information firms.
Since the cost of equity is a critical input from the capital market for the discount rate in the capital budgeting process, we expect that firms with more private information than those with less private information show greater sen-sitivity to the cost of capital for their investment and financing decisions. Simi-larly, equity dependent firms’ investment and financing decisions are expected
opportunities (Baker et al. (2003)). Accordingly, we examine if cost-of-equity proxies capture these patterns of the stock price-investment link as they con-tain information on the discount rate and cash flows from the stock market. In particular, the ICC is to capture firm-specific information on the discount rate by its design (Pastor et al. (2008) and Chen et al. (2013)). Thus, we expect that the ICC has negative effects on investment and equity issuance for firms with more private information and equity dependence. Given our findings that fac-tor model-based estimates capture cash flow news and the previous results that they reflect market-wide information (Campbell and Vuolteenaho (2004) and Campbell et al. (2010)), we do not expect such effects for factor model-based es-timates. To the extent that the stock market informs managers of the economy-wide cash flows, however, the positive effects of factor model-based estimates on investment and equity issuance may be more pronounced for non-private information and non-equity dependent firms.
Private Information
We measure the amount of private information by the price nonsynchronicity calculated as one minus R-square from the time-series regression of daily stock return on the market and 3-digit SIC industry portfolio returns over the fiscal year.6 Chen et al. (2007) suggest that a weak correlation of a firm’s stock return
with the market and industry returns indicates more private information that is useful for the firm’s investment decision. Based on the price nonsynchronicity measure, we define the top 30% as large private information firms and the bot-tom 30% as small private information firms. For the estimation of price
nonsyn-6This measure was first suggested by Roll (1988) and later developed by Morck et al. (2000),
chronicity, we require that firms have at least 150 days of non-missing returns during the given year.
Table 1.9 presents the results. For investment regressions on Panels A and B, the coefficient estimates on ICC measures are all negative and significant for firms with large private information, whereas the coefficient estimates on ICC measures are all insignificant for firms with small private information. In con-trast, the coefficient estimates on factor model-based estimates are all insignifi-cant for firms with large private information, whereas they are all positive and significant for firms with small private information. For net equity issuance re-gressions on Panels C and D, ICC measures have significant and negative effects for large private information firms, while they have insignificant or marginal ef-fects for small private information firms. Factor model-based estimates, in con-trast, show mostly insignificant effects for large private information firms, while showing significant and positive effects for small private information firms.
The findings in this section suggest that a firm’s investment and equity is-suance are particularly sensitive to the ICC when there is greater amount of private information in the stock price. Thus, the ICC appears to contain infor-mation about the market’s assessment of project risk beyond what is reflected inqand cash flows. However, the results for factor model-based estimates sug-gest that firms with less private information tend to be sensitive to the cash flow shocks in the public information set. It is also notable that the results show sim-ilar effects for equity issuance. Thus, the discount rate may inform managers of not just the timing of investment but also the timing of equity issuance.
Equity Dependence
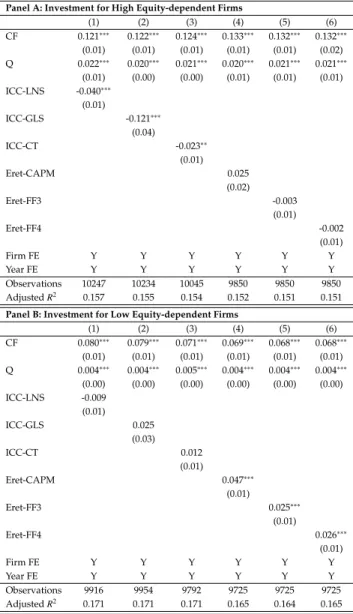
Here, we compare the sensitivities of firms’ investment and equity issuance to alternative cost-of-equity proxies between high and low equity-dependent firm-s. Following Baker et al. (2003) and Bakke and Whited (2010), we use the KZ index to measure equity dependence as follows:
KZi,t = −1.002CFi,t−39.368DIVit−1.315CAS Hi,t +3.139LEVi,t. (1.13)
We define firms with the top 30% KZ index as high equity-dependent and firms with the bottom 30% KZ index as low equity-dependent.
Table 1.10 presents the results. For high equity-dependent firms’ investment on Panel A, we find that the coefficient estimates on ICC measures are all neg-ative and highly significant, while those on factor model-based estimates are all insignificant. For low equity-dependent firms’ investment on Panel B, the coefficient estimates on ICC measure are insignificant, while those on factor model-based estimates exhibit strong positive effects. For equity issuance on Panels C and D, the results show that ICC measures have unequivocally sig-nificant and negative effects for high equity-dependent firm, while having less significant but still negative effects for low equity-dependent firms. The nega-tive effect of the ICC on equity issuance but insignificant effect on investment for low equity-dependent firms suggest that the low cost of equity may induce managers to issue equity that is not necessarily linked to concurrent investment. In contrast, factor model-based estimates show insignificant effects on equity is-suance for high equity-dependent firms, while showing significant and positive effects for low equity-dependent firms.
and equity issuance are particularly sensitive to the discount rate component captured by the ICC. In contrast, factor model-based estimates show significant and positive effects for non-equity-dependent firms, suggesting that financially unconstrained firms’ investment and equity issuance are sensitive to the cash flow news.
Overall, firms with greater private information and equity dependence ex-hibit most sensitivities of their investment and equity issuance to the ICC. These findings suggest that the discount rate component contained in the ICC is im-portant private information that affects firms’ investment and equity issuance. Moreover, the significant effects of the ICC for equity dependent firms sug-gest that what drives the stock price-investment link is the discount rate news in the stock price. In contrast, factor model-based estimates affect investment and financing decisions for non-equity dependent and non-private information firms, which suggests that factor model-based estimates contain information on market-wide cash flows which in turn affects firms’ investment and financing decisions.
1.3
Robustness Checks
1.3.1
Mergers and Acquisitions (M&A) and Research and
De-velopment (R&D)
Both theoretical and empirical studies suggest that M&As are significantly af-fected by stock market valuation.7 The key component of these theoretical
mod-els is private information. Moreover, Daniel et al. (2016) argue that for non-manufacturing firms R&D is more important investment than capital expendi-tures, and M&As could substitute for capital expenditures and R&D. Brown et al. (2009) also show that the supply of equity has a significant effect on R&D expenditures. Consequently, we estimate our investment regressions with the dependent variable broadly defined as the sum of capital expenditure (CAPX) plus M&A and R&D scaled by beginning-of-the-year assets.
The results in Table 1.11 show that all coefficient estimates on ICC measures remain negative and highly significant, whereas those on factor model-based estimates are insignificant. To the extent that these broadly defined investments are more sensitive to the discount rate shock and private information, these findings suggest that firms’ investment decisions are particularly sensitive to private information on the discount rate news captured by the ICC.
7Shleifer and Vishny (2003), Rhodes-Kropf and Viswanathan (2004),Rhodes-Kropf et al.
(2005), and Dong, Hirshleifer, Richardson, and Teoh (2006) argue that M&As are driven by high market valuation.
1.3.2
Error-in-Variable Consistent GMM
Erickson and Whited (2000, 2002, 2012) demonstrate that a regression of invest-ment onqis seriously misspecified because of measurement error inq. Accord-ingly, it is possible that our results are driven by measurement errors inq. It is also possible that the cost-of-equity proxies are subject to the errors-in-variable biases. Erickson et al. (2014) show that the high order linear cumulant estima-tor is asymptotically equivalent to the high order moments estimaestima-tor suggested by Erickson and Whited (2000, 2002), but the former performs better in finite samples. Accordingly, we follow Erickson et al. (2014) and Erickson et al. (2015) to implement their measurement-error consistent GMM technique to correct for measurement errors inqand the cost-of-equity estimates. Specifically, we treat
qand cost-of-equity proxies as misspecified variable and use fifth-order cumu-lants. The results (Table A.2 in the Appendix) show that our findings remain quantitatively and qualitatively the same. Thus, we rule out that the potential effects of measurement errors inqand cost-of-equity proxies drive our results.
1.3.3
Utilizing Fundamentals-based
q
Cummins et al. (2006) suggest thatqconstructed using analysts’ forecast earn-ings better reflects fundamentals important for investment spending. In partic-ular, using the analysts’ forecast earnings-based q rather than the stock price, they find no evidence that investment is sensitive to cash flows. Their earnings-based qis particularly interesting for our study because the ICC is also based
in q and cash flows, the effects of the ICC will remain significant. Thus, we examine if our results are altered when the earnings-basedqis used.
The results (in Table A.3 in the Appendix) show that all coefficient estimates on ICC measures remain negative and highly significant, whereas those on fac-tor model-based estimates are still positive and significant. The results are con-sistent with our main finding that the ICC informs managers about the discount rate, beyondqand cash flows.
1.3.4
Controlling for Other Firm Characteristics
We also investigate the effect of the cost-of-equity proxies on corporate invest-ment while controlling for other firm characteristics, which should mitigate the concern that our cost-of-equity proxies simply capture some firm characteristics not reflected in q. For this exercise, we estimate regression (1.8) including the following additional control variables: leverage (Lev), firm size (S ize), cash div-idend (Div), fixed assets (FA), and cash holdings (Cash). Table 1.12 reports the results. The signs and significance of all coefficient estimates for cost-of-equity proxies remain the same as previously reported.
1.3.5
Non-Recession Periods
Given the opposite patterns of the ICC and factor-model-based estimates are particularly conspicuous around recession periods as shown in Figure 1.1 and Table 1.7, we check if the results are driven by recession periods. To this end, we run regressions after excluding the years containing the recession periods.
The results (in Table A.4 in the Appendix) based on non-recession periods show that the coefficient estimates on ICC measures are significant and nega-tive, whereas the coefficient estimates on factor model-based estimates are pos-itive and mostly significant. Thus, the opposite effects of the ICC and factor model-based estimates are not exclusively driven by their particular behavior around recession periods.
1.3.6
Long-term Effects
Given that some capital projects involve long-term planning and implementa-tion, there may be a time gap between the time of estimating the cost of equity and the actual investment for a project. In order to check the potential effect of this time gap, we try longer (up to two-year) lags of the cost of equity proxies.
The estimation results with the second-year lags of the cost-of-equity prox-ies (in Table A.5 in the Appendix) show that the long-term effects are mostly in-significant except for the two-year lagged 4-factor model-based estimate which shows a positive and significant effect. Thus, our findings suggest that long-term effects of the cost-of-equity proxies on investment are limited.
1.4
Summary and Conclusion
the CAPM and the Fama-French model (FFM). Furthermore, we find that factor model-based estimates also have positive effects on equity issuance. We show that such positive effects are resulting from the fact that factor model-based esti-mates capture the cash flow news that has positive effects on investment and e-quity issuance. In contrast, the ICC, reflecting discount rate news for given fore-cast cash flows, show negative effects on investment and equity issuance. The ICC increases prior to recession periods capturing the discount rate news, while the factor model-based estimates decrease prior to recession periods capturing the cash flow news. Moreover, the ICC decreases following positive supply shocks in equity capital, while the factor model-based estimates show opposite effects. The ICC exhibits stronger effects for firms with more equity dependence and greater private information. In contrast, the factor model-based estimates, capturing cash flow news contained in the public information set, show positive effects on firms’ investment and equity issuance.
Our findings suggest that the ICC captures the firm-specific discount rate that is contained in the stock price. It may be close to what managers come up with after considering the market conditions as it shows direct effects on invest-ment and financing decisions. Such consideration is particularly important for more equity dependent firms that are more likely to face financial constraints and firms with greater private information that are more likely to be sensitive to the discount rate news for their investment and financing decisions. In contrast, the factor model-based estimates capture the market-wide cash flow news and positively predict corporate investment and equity issuance. The factor mod-els seem to miss out the firm-specific discount rate news that are particularly relevant for corporate investment and financing decisions.
If we evaluate cost-of-capital proxies based on their ability to capture the discount rate that can be used for capital budgeting decisions, our results sup-port the ICC as an alternative to the traditional factor model-based estimates. The main advantage of the ICC is that it captures the discount rate from the forward-looking perspective. Such an advantage may be particularly important in the presence of market frictions such as financing constraints and asymmetric information.
0 .01 .02 .03 1985m11995m12005m1 ICC-LNS 0 .005 .01 .015 1985m11995m12005m1 ICC-GLS 0 .01 .02 .03 1985m11995m12005m1 ICC-CT -.01 0 .01 .02 1985m11995m12005m1 Eret-CAPM -.01 0 .01 .02 1985m11995m12005m1 Eret-FF3 -.01 0 .01 .02 1985m11995m12005m1 Eret-FF4
Figure 1.1: Times Series Patterns of the Cost-of-Equity Proxies
The figure shows the patterns of ICC and factor model-based expected return estimates during recession and non-recession periods. The sample consists of US firms from 1985 to 2013. ICC-LNS, ICC-GLS and ICC-CT are the implied cost of equity estimates following the methods of Li et al. (2013), Claus and Thomas (2001), and Gebhardt et al. (2001), respectively. CAPM, FF3, and FF4 are expected returns based on the CAPM, the Fama and French three-factor and four-factor models, respectively. The shaded regions are NBER recession peri-ods.
Table 1.1: Descriptive Statistics and Variable Correlations
Panel A of the table provides the summary statistics for the variables used in the study. The sample consists of US firms from 1985 to 2013. For each variable, we report the number of observations (N), mean (Mean), standard deviation (Std), 25th percentile, median and 75th percentile. Panel B provides Pearson correlation matrix of cost-of-equity proxies and return components. ICC-LNS, ICC-GLS and ICC-CT are the implied cost of equity estimates following the methods of Li et al. (2013), Claus and Thomas (2001), and Gebhardt et al. (2001), respectively. Eret-CAPM, Eret-FF3, and Eret-FF4 are expected returns based on the CAPM, the Fama and French three-factor and four-factor models, respectively. CFN-CDZ (CFN-CS) and DRN-CDZ (DRN-CS) are cash flow news and discount rate news following the method of Chen et al. (2013) (Campbell and Shiller (1988)). Eret-Cash Flow and Eret-Discount Rate are cash-flow and discount-rate expected return components, respectively, where cash-flow beta and discount-rate beta are estimated following Campbell and Vuolteenaho (2004)’s approach. Detailed definitions of the variables are provided in Appendix B. ***, ** and * denote statistical significance at the 1%, 5% and 10% levels, respectively.
Panel A. Summary Statistics
N Mean S.D. Q25 Median Q75 CPAX 40053 0.068 0.071 0.024 0.046 0.084 CAPX+R&D 40053 0.109 0.098 0.041 0.081 0.144 Issuance 37929 0.112 0.332 -0.003 0.008 0.038 CF 40053 0.097 0.112 0.054 0.102 0.153 Q 40057 1.843 1.166 1.120 1.468 2.112 Real Q 36995 1.607 1.643 0.569 1.137 2.037 1-R2 40123 0.753 0.209 0.634 0.812 0.919 ICC-LNS 40123 0.140 0.071 0.093 0.120 0.170 ICC-GLS 40123 0.098 0.029 0.079 0.095 0.113 ICC-CT 40123 0.110 0.063 0.078 0.097 0.123 Eret-CAPM 40123 0.110 0.094 0.028 0.112 0.170 Eret-FF3 40123 0.121 0.098 0.054 0.114 0.181 Eret-FF4 40123 0.110 0.108 0.039 0.104 0.175 CFN-CDZ 39752 0.067 0.608 -0.390 0.090 0.584 CFN-CS 37751 0.045 0.613 -0.424 0.092 0.531 DRN-CDZ 39752 -0.027 0.626 -0.566 -0.048 0.498 DRN-CS 37751 -0.004 0.534 -0.224 0.019 0.178 Eret-MKTCF 40091 0.084 0.068 0.022 0.085 0.129 Eret-MKTDR 40091 0.038 0.027 0.012 0.039 0.059 Eret-SMBCF 40091 0.045 0.044 0.018 0.041 0.064 Eret-SMBDR 40091 0.036 0.029 0.014 0.040 0.054 Eret-HMLCF 40091 0.015 0.038 -0.003 0.016 0.042 Eret-HMLDR 40091 0.032 0.023 0.010 0.034 0.049 Eret-UMDCF 40091 0.026 0.076 -0.013 0.026 0.070 Eret-UMDDR 40091 0.040 0.029 0.013 0.045 0.060
Panel B. Correlation
ICC-LNS ICC-GLS ICC-CT Eret-CAPM Eret-FF3 Eret-FF4 CFN-CDZ DRN-CDZ ICC-LNS 1.00 ICC-GLS 0.50∗∗∗ 1.00 ICC-CT 0.57∗∗∗ 0.58∗∗∗ 1.00 Eret-CAPM 0.12∗∗∗ 0.09∗∗∗ 0.12∗∗∗ 1.00 Eret-FF3 0.08∗∗∗ 0.06∗∗∗ 0.07∗∗∗ 0.59∗∗∗ 1.00 Eret-FF4 0.03∗∗∗ 0.01∗ 0.05∗∗∗ 0.47∗∗∗ 0.85∗∗∗ 1.00 CFN-CDZ 0.15∗∗∗ -0.03∗∗∗ 0.03∗∗∗ -0.00 -0.00 0.00 1.00 DRN-CDZ 0.21∗∗∗ 0.06∗∗∗ 0.08∗∗∗ 0.02∗∗∗ -0.00 -0.00 0.84∗∗∗ 1.00
Table 1.2: Estimation Results of Investment Regressions
This table provides estimation results from panel regressions. The sample consists of US firms from 1985 to 2013. The dependent variables are capital expenditures (CAPX) scaled by beginning-of-year total assets (AT). ICC-LNS, ICC-GLS and ICC-CT are the implied cost of equity estimates following the methods of Li, Ng, and Swaminathan (2013), Claus and Thomas (2001), and Gebhardt, Lee, and Swaminathan (2001), respectively. Eret-CAPM, Eret-FF3, and Eret-FF4 are expected returns based on the CAPM, the Fama and French three-factor and four-factor models, respectively. All the cost-of-equity proxies are measured at the beginning of the year. Q is Tobin’s q at the beginning of the year and CF is concurrent free cash flow. All regressions include year and firm fixed effects. Detailed definitions of variables are provided in Appendix B. The robust standard errors adjusted for firm-level clustering are reported in parentheses. ***, ** and * denote statistical significance at the 1%, 5% and 10% levels, respectively.
Dependent Variable: CAPX
(1) (2) (3) (4) (5) (6) (7) (8) (9) (10) CF 0.102∗∗∗ 0.107∗∗∗ 0.106∗∗∗ 0.105∗∗∗ 0.105∗∗∗ 0.104∗∗∗ 0.104∗∗∗ 0.110∗∗∗ 0.109∗∗∗ 0.109∗∗∗ (0.01) (0.01) (0.01) (0.01) (0.01) (0.01) (0.01) (0.01) (0.01) (0.01) Q 0.007∗∗∗ 0.006∗∗∗ 0.006∗∗∗ 0.007∗∗∗ 0.007∗∗∗ 0.007∗∗∗ 0.007∗∗∗ 0.006∗∗∗ 0.006∗∗∗ 0.006∗∗∗ (0.00) (0.00) (0.00) (0.00) (0.00) (0.00) (0.00) (0.00) (0.00) (0.00) ICC-LNS -0.036∗∗∗ -0.034∗∗∗ -0.034∗∗∗ -0.034∗∗∗ (0.01) (0.01) (0.01) (0.01) ICC-GLS -0.065∗∗∗ (0.02) ICC-CT -0.012∗ (0.01) Eret-CAPM 0.031∗∗∗ 0.034∗∗∗ (0.01) (0.01) Eret-FF3 0.012∗∗ 0.016∗∗∗ (0.00) (0.01) Eret-FF4 0.014∗∗∗ 0.015∗∗∗ (0.00) (0.00) Firm FE Y Y Y Y Y Y Y Y Y Y Year FE Y Y Y Y Y Y Y Y Y Y Observations 40050 38093 38180 37503 37176 37176 37176 35420 35420 35420 AdjustedR2 0.154 0.162 0.161 0.161 0.155 0.155 0.155 0.163 0.163 0.163
Table 1.3: Estimation Results of Net Equity Issuance Regressions
This table provides estimation results from panel regression. The sample consists of US firms from 1985 to 2013. The dependent variable is Issuance, defined as the difference of log adjusted shares outstanding between fiscal yeartand
t−1. ICC-LNS, ICC-GLS and ICC-CT are the implied cost of equity estimates following the methods of Li, Ng, and Swaminathan (2013), Claus and Thomas (2001), and Gebhardt, Lee, and Swaminathan (2001), respectively. Eret-CAPM, Eret-FF3, and Eret-FF4 are expected returns based on the CAPM, the Fama and French three-factor and four-factor models, respectively. All the cost-of-equity proxies are measured at the beginning of the year. Q is Tobin’s q at the beginning of the year and CF is concurrent free cash flow. All regressions include year and firm fixed effects. Detailed definitions of variables are provided in Appendix B. The robust standard errors adjusted for firm-level clustering are reported in parentheses. ***, ** and * denote statistical significance at the 1%, 5% and 10% levels, respectively.
Dependent Variable: ISSUANCE
(1) (2) (3) (4) (5) (6) (7) (8) (9) CF 0.489∗∗∗ 0.480∗∗∗ 0.480∗∗∗ 0.473∗∗∗ 0.470∗∗∗ 0.470∗∗∗ 0.497∗∗∗ 0.494∗∗∗ 0.494∗∗∗ (0.03) (0.03) (0.03) (0.03) (0.03) (0.03) (0.03) (0.03) (0.03) Q 0.030∗∗∗ 0.031∗∗∗ 0.033∗∗∗ 0.031∗∗∗ 0.031∗∗∗ 0.031∗∗∗ 0.032∗∗∗ 0.032∗∗∗ 0.032∗∗∗ (0.00) (0.00) (0.00) (0.00) (0.00) (0.00) (0.00) (0.00) (0.00) ICC-LNS -0.182∗∗∗ -0.176∗∗∗ -0.175∗∗∗ -0.173∗∗∗ (0.03) (0.03) (0.03) (0.03) ICC-GLS -0.214∗∗ (0.09) ICC-CT -0.046∗ (0.03) Eret-CAPM 0.086∗ 0.100∗∗ (0.04) (0.05) Eret-FF3 0.093∗∗∗ 0.099∗∗∗ (0.03) (0.03) Eret-FF4 0.082∗∗∗ 0.082∗∗∗ (0.02) (0.02) Firm FE Y Y Y Y Y Y Y Y Y Year FE Y Y Y Y Y Y Y Y Y Observations 36103 36188 35563 35238 35238 35238 33606 33606 33606 AdjustedR2 0.068 0.066 0.067 0.064 0.064 0.064 0.067 0.067 0.067
Table 1.4: Sensitivities of Investments and Net Equity Issuance to Cash Flow and Discount Rate News
This table provides estimation results from panel regression. The sample consists of US firms from 1985 to 2013. The dependent variables are capital expenditures (CAPX) scaled by beginning-of-year total assets (AT); and Issuance, de-fined as the difference of log adjusted shares outstanding between fiscal yeartandt−1. CFN-CDZ and DRN-CDZ are cash flow news and discount rate news, respectively, according to the Chen et al. (2013)’s approach. CFN-CS and DRN-CS are cash flow news and discount rate news, respectively, according to Campbell and Shiller (1988) approach. All the cost-of-equity proxies are measured at the beginning of the year. Q is Tobin’s q at the beginning of the year and CF is concurrent free cash flow. All regressions include year and firm fixed effects. Detailed definitions of variables are provided in Appendix B. The robust standard errors adjusted for firm-level clustering are reported in parentheses. ***, ** and * denote statistical significance at the 1%, 5% and 10% levels, respectively.
(1) (2) (3) (4)
CAPX ISSUANCE CAPX ISSUANCE
CF 0.105∗∗∗ 0.425∗∗∗ 0.094∗∗∗ 0.382∗∗∗ (0.01) (0.03) (0.01) (0.03) Q 0.006∗∗∗ 0.021∗∗∗ 0.006∗∗∗ 0.021∗∗∗ (0.00) (0.00) (0.00) (0.00) CFN-CDZ 0.009∗∗∗ 0.145∗∗∗ (0.00) (0.01) DRN-CDZ -0.008∗∗∗ -0.143∗∗∗ (0.00) (0.01) CFN-CS 0.014∗∗∗ 0.132∗∗∗ (0.00) (0.01) DRN-CS -0.014∗∗∗ -0.118∗∗∗ (0.00) (0.01) Firm FE Y Y Y Y Year FE Y Y Y Y Observations 37774 35802 37698 35672 AdjustedR2 0.164 0.084 0.160 0.076
Table 1.5: Sensitivities of Cost-of-Equity Proxies to Cash Flow News and Dis-count Rate News
This table provides estimation results from Fama-Macbeth regression. The sample consists of US firms from 1985 to 2013. The dependent variables include implied cost of capital measures and factor model-based proxies. LNS, ICC-GLS and ICC-CT are the implied cost of equity estimates following the methods of Li et al. (2013), Claus and Thomas (2001), and Gebhardt et al. (2001), respectively. Eret-CAPM, Eret-FF3, and Eret-FF4 are expected returns based on the CAPM, the Fama