Wright State University Wright State University
CORE Scholar
CORE Scholar
Browse all Theses and Dissertations Theses and Dissertations
2018
Impact of Noise Level on Task Performance and Workload and
Impact of Noise Level on Task Performance and Workload and
Correlation to Personality
Correlation to Personality
Kaylee Marie Eakins Wright State University
Follow this and additional works at: https://corescholar.libraries.wright.edu/etd_all
Part of the Operations Research, Systems Engineering and Industrial Engineering Commons
Repository Citation Repository Citation
Eakins, Kaylee Marie, "Impact of Noise Level on Task Performance and Workload and Correlation to Personality" (2018). Browse all Theses and Dissertations. 1948.
https://corescholar.libraries.wright.edu/etd_all/1948
This Thesis is brought to you for free and open access by the Theses and Dissertations at CORE Scholar. It has been accepted for inclusion in Browse all Theses and Dissertations by an authorized administrator of CORE Scholar. For more information, please contact [email protected].
Impact of Noise Level on Task Performance and Workload and Correlation to Personality
A thesis submitted in partial fulfillment
of the requirements for the degree of
Master of Science in Industrial and Human Factors Engineering
By
KAYLEE MARIE EAKINS B.S.B.E., Wright State University 2017
2018
WRIGHT STATE UNIVERSITY
GRADUATE SCHOOL
April 19, 2018
I HEREBY RECOMMEND THAT THE THESIS PREPARED UNDER MY SUPERVISION BY Kaylee Marie Eakins ENTITLED Impact of Noise Level on Task Performance and
Workload and Correlation to Personality TO BE ACCEPTED IN PARTIAL FULFILLMENT OF THE REQUIREMENTS FOR THE DEGREE OF Master of Science in Industrial and Human Factors Engineering
___________________________________ Mary Fendley, Ph.D., Thesis Director
___________________________________ Jaime Ramirez-Vick, Ph.D., Chair Department of Biomedical, Industrial and Human Factors Engineering
Committee on Final Examination ___________________________________ Mary Fendley, Ph.D. ___________________________________ Frank Ciarallo, Ph.D. ___________________________________ Matthew Sherwood, Ph.D. __________________________________ Barry Milligan, Ph.D.,
iii
ABSTRACT
Eakins, Kaylee Marie. M.S.I.H.E., Department of Biomedical, Industrial and Human Factors Engineering, Wright State University, 2018. Impact of Noise Level on Task Performance and Workload and Correlation to Personality.
An ideal work environment supports a culture of high performance, low mental workload, and
quick turnarounds. The impact of noise on three types of tasks in a lab work environment were examined while attempting to identify correlations between a subject’s personality and their
tolerance to noise. Neuroticism, agreeableness, conscientiousness, and extroversion correlated
significantly with subjective (NASA-TLX) and physiological mental workload measures (heart
rate variability and eye-tracking). The results show that task type impacts the performance, task
duration, and mental workload. Although the physiological workload measures showed
significant impact, the parameters standard deviation of R-R intervals and LF/HF ratio agreed
with the NASA-TLX scores while the parameters RMSSD value and standardized mean of R-R
intervals disagreed. Noise level nearly showed statistical significance with task duration and
LF/HF ratio; however, more research is necessary to completely rule out the influence of noise
iv
Table of Contents
1.0 Introduction ... 1 1.1 Background ... 1 1.2 Research Objective ... 2 2.0 Literature Review... 22.1 Task and Multiple Resource Theory ... 2
2.2 Noise Interruption ... 5
2.3 Mental Workload Analysis... 6
2.3.1 NASA TLX... 6
2.3.2 Eye-tracking ... 7
2.3.3 Heart Rate Variability ... 9
2.4 Personality ... 12
3.0 Methods... 16
3.1 Experimental Design ... 16
3.2 Participants ... 17
3.3 Stimuli and Apparatus ... 18
3.4 Procedure ... 20 3.5 Data Analysis ... 21 3.5.1 Performance Scoring ... 21 3.5.2 Duration of task ... 22 3.5.3 NASA-TLX ... 22 3.5.4 Eye-tracking ... 23
3.5.5 Heart Rate Variability ... 23
3.6 Hypotheses ... 24
v
3.6.2 Duration of the Tasks ... 24
3.6.3 NASA-TLX Mental Workload ... 25
3.6.4 Eye-tracking and HRV Parameters ... 25
4.0 Results ... 26
4.1 Performance ... 27
4.2 Duration ... 30
4.3 NASA-TLX Mental Workload... 32
4.4 Physiological Mental Workload ... 34
4.4.1 Heart Rate Variability Analysis ... 34
4.4.2 Eye-tracking Analysis... 39
4.4.3 Summary of Physiological Parameters ... 43
4.5 Correlation Testing ... 43
5.0 Discussion ... 48
5.1 Performance, Duration, and NASA-TLX ... 48
5.2 Physiological Mental Workload ... 50
5.3 Correlation Tests ... 55
6.0 Conclusion ... 56
7.0 Appendix ... 57
7.1 Appendix A: Experimental Design and Combinations Table ... 57
7.2 Appendix B: Questionnaires and Task Problems (with answers) ... 60
7.2.1 Noise Tolerance Questionnaire ... 60
7.2.2 Big Five Inventory (Link) ... 61
7.2.3 NASA-TLX (Link) ... 61
7.2.4 Anomaly Detection Task (with answers) ... 62
vi
7.2.6 Mathematical Arithmetic Task (with answers) ... 63
7.3 Appendix C: Eye-tracking Illustrations... 63
7.4 Appendix D: Residual Plots ... 67
7.4.1 Normal Distribution Checks ... 67
7.4.2 Residual vs. Predicted Plots... 71
7.5 Appendix E: Connecting Letters Reports and Interaction Plots ... 74
7.5.1 Task Performance ... 74
7.5.2 Task Duration ... 75
7.5.3 Mental Workload ... 76
7.5.4 Heart Rate Parameters ... 77
7.5.5 Eye-tracking Parameters ... 79
7.6 Appendix F: Correlation Tables ... 80
vii
List of Figures
Figure 1: Illustration of R-R interval in EKG signal ... 9
Figure 2: Graphical user interface for data entry task... 19
Figure 3: Anomaly detection task with anomaly circled ... 19
Figure 4: Arithmetic task set-up with manual pill counter, beads, and pill bottle ... 20
Figure 5: Average task type and noise level vs. performance (error bars are standard deviation) 28 Figure 6: Task type, noise level, and task type*noise level interaction connecting letters reports for performance ... 29
Figure 7: Average of task duration vs. task type and noise level ... 30
Figure 8: Task type, noise level, and task type*noise level interaction connecting letters reports for task duration ... 31
Figure 9: Averages of NASA-TLX scores vs. task type and noise level ... 32
Figure 10: Task type, noise level, and task type*noise level interaction connecting letters reports for NASA-TLX scores ... 34
Figure 11: Correlation scatterplot with ellipse of agreeableness vs. office noise mean pupil diameter... 45
Figure 12: Correlation scatterplot with ellipse of agreeableness vs. data entry mean pupil diameter... 46
Figure 13: Correlation scatterplot with ellipse of neuroticism vs. office noise MWL (NASA-TLX) ... 46
Figure 14: Correlation scatterplot with ellipse of agreeableness vs. anomaly detection mean pupil diameter... 47
viii
Figure 15: Correlation scatterplot with ellipse of agreeableness vs. no noise mean pupil diameter
... 47
Figure 16: Graphical illustration of all mental workload measures for task type ... 52
ix
List of Tables
Table 1: HR and HRV parameters with expected changes with increased mental workload ... 10
Table 2: Independent and Dependent Variable Lists ... 17
Table 3: ANOVA for task performance ... 29
Table 4: ANOVA for task duration ... 31
Table 5: ANOVA for NASA-TLX mental workload scores ... 33
Table 6: ANOVA for LF/HF ratio ... 35
Table 7: ANOVA for mean HRV (not standardized) ... 36
Table 8: ANOVA for standardized mean HRV ... 37
Table 9: ANOVA for standard deviation HRV ... 38
Table 10: ANOVA for root mean squared differences of successive R-R intervals (RMSSD) ... 39
Table 11: ANOVA for mean difference in pupil diameter ... 40
Table 12: ANOVA for pupil diameter standard deviation... 41
Table 13: Table of f-ratios/t-ratios and p values for data entry task's fixation rate, duration, and counts ... 42
Table 14: Table of f-ratios/t-ratios and p values for anomaly detection task's fixation rate, duration, and counts ... 42
Table 15: Summary table of physiological parameters when mental workload increases ... 43
Table 16: Correlation coefficient, p-values, and variables for all correlations that showed significance ... 44
x
ACKNOWLEDGEMENTS
I would like to thank my graduate advisor Dr. Mary Fendley for her patience, dedication,
kindness, and support throughout my college experience. I would like to thank Dr. Ciarallo for
his assistance and willingness to answer all of my questions no matter how long it took. Another
thank you to Dr. Sherwood for also giving me input when I was hitting some dead ends. Special thanks to Wright State’s Biomedical, Industrial, and Human Factors Engineering Department for
their hard work and care for students. I would also like to thank Dr. Joe Tritschler for hiring me
on, allowing me to focus on school rather than where my funding is coming from. I want to also
mention my great appreciation to my research colleagues Alex Dominic, Noel Fleeman, and Josh
1
1.0 Introduction
1.1 Background
Human beings are able to control several different aspects of their work environment;
however, there are some aspects that cannot be changed and must be tolerated. Whether this
includes temperature, atmosphere, lighting, mood, or sound level, these aspects have an
influence on the work environment and, in turn, the humans. Noise is an aspect that is present in
many work environments and is easily controlled to benefit the persons working in the
environment. For example, some individuals often choose a quiet space away from people, while
others choose a space with lots of people and plentiful noise. Additionally, while some
individuals may play soft music without lyrics to focus on their work, others may blast lyrical
melodies until their work is completed.
So, how does one know whether the environmental sound around an individual is
supporting accurate task completion, in an effortless timely manner? Multiple studies have found
that task performance deteriorates when noise is produced in the background (Jahncke,
Björkeholm, Marsh, Odelius, & Sörqvist, 2016; Jerison, 1959; Levy-Leboyer, 1989; Nassiri et
al., 2013; Weistein, 1974). Other studies have shown that not only task performance is impacted.
The Reaction time and the mental load on the human during the task is also impacted (Becker,
Warm, Dember, & Hancock 1995; Lahtela, Niemi, Kuusela, & Hypén, 1986; Ljungberg &
Neely, 2007; Nassiri et al., 2013; Tafalla, & Evans, 1997).
Studies have found that personality may have an impact on the quality of a subject’s
performance when there is noise in the background (Belojevic, Jakovljevic, & Slepcevic, 2003;
Dobbs, Furnham, & McClelland, 2011; Furnham, & Strbac, 2002; Jafari & Kazempour, 2013,
2
noise on a human based on the ambient, environmental sounds experienced within the human’s
daily life (Dockrell, Shield, & Dockrell, 2008; Lercher, Evans, & Meis, 2003; Pujol, et al.,
2014).
This research study utilized different types of tasks to examine whether performance,
mental workload, or duration of task are impacted when a subject was exposed to three different
background noise levels. The tasks used in this study were designed to simulate those specific to
professionals in a medical field while the accompanying ambient noise was based on sounds
heard in a typical medical environment (e.g. people talking, copier running, typing, and phone
ringing). Correlation tests were then used to study whether the noise and task type’s influences
relate back to the personality and noise tolerance of the individual. In addition, correlation were
examined to look for a relationship between the effect of noise and task types versus the
personality and lifestyle of the subject.
1.2 Research Objective
The purpose of this study was to assess the influence of noise on human subject task
performance, more specifically: the time it took to complete the tasks, the performance of the
subject, and the mental workload of the subject. Noise tolerance and personality correlation
analyses were taken into consideration to examine the effects of the individual’s personality on
the dependent variables when noise was introduced.
2.0 Literature Review
3
This study incorporates three types of tasks (data entry, anomaly detection, and
mathematical arithmetic) that have been commonly used to study human performance and
mental workload (Cail & Aptel, 2003; Church, 2015; Colligan, Potts, Finn, & Sinkin, 2015;
Dimitrakopoulos et al. 2017; Gabbard, 2017; Galy & Mélan, 2015; Khan & Rizvi, 2010; Kotani,
Takamasu, & Tachibana, 2007; Nickels, 2014; Peng, He, Ji, Wang, & Yang, 2006; Piasecki,
2016). Each of these tasks were designed to simulate actual healthcare practices performed by
different medical personnel. The first task, data entry, relates to the job that a nurse must
complete to catalogue patient information into Electronic Health Records (EHR) (graphical user
interface symbolizing EHR interface found in Appendix B). In fact, Colligan, Potts, Finn, and
Sinkin (2015) analyzed mental workload of pediatric nurses during a data entry task of filling out
EHRs in their actual work environment. The study examined the reaction of the nurses when
switching to the new EHRs, and found that mental workload increased only during the initial
switch to the new EHR.
Both Gabbard (2017) and Piasecki (2016) utilized an anomaly detection task to
investigate mental workload and overall performance of human subjects. Gabbard’s anomalies
were set in a video; while Piasecki had a stagnant scene for the anomalies, the anomalies
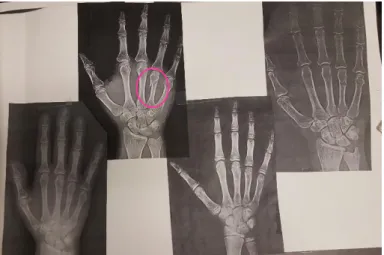
sometimes flashed and moved within the still scene. These types of anomalies are in contrast to this research study’s focus, since both the anomalies and the setting were static. Sets of x-rays
were used in a stagnant image set for the subject to pick out abnormalities (images found in
Appendix B). These stagnant scenarios were appropriate, since a radiologist’s work radiologist’s
profession is far more complex than the task for this experiment and requires years of training ;
thus, the task in this research only attempts to simulate a limited portion of the full
4
The complexity of the actual medical professional’s job also effected the choice of the
mathematical/arithmetic task. An arithmetic task was simulated with counting and categorizing
medical pills, a task that pharmacists are familiar with and one that this study has dubbed the “pharmaceutical task” (set-up and problems found in Appendix B). Filling prescriptions require
years of pharmaceutical training and is not a task that just anyone can pick up and perform;
therefore, this study simplified the task utilizing basic math, colorful beads, and a manual pill
counter. Arithmetic tasks are a common means of testing mental workload (Dimitrakopoulos et
al. 2017; Galy & Mélan, 2015; Kotani, Takamasu, & Tachibana, 2007; Peng, He, Ji, Wang, &
Yang, 2006). In this study, mathematical arithmetic’s role in mental workload studies and the
way subjects use mental mathematics elicited interesting performance scores.
Some tasks require more resources than others. Multiple Resource Theory (MRT) states
that there are limitations on what an individual can do all at one time, dependent on four factors,
based on the amount of resources that a certain task demands (Basil, 1994; Wickens, 2002;
Wickens, 2008). These factors are processing stages, perceptual modalities, visual channels, and
processing codes. Each factor has two dimensions, and each dimension has two discrete levels.
While all the tasks in this study incorporate visual modalities, the anomaly detection task relies
heavily on the ability to visualize and interpret the differences among x-rays. The mathematical
arithmetic task weighs more heavily on working memory in terms of processing the information
given. However, the data entry task requires both verbal and auditory resources. One of the
resources, auditory, is being disrupted with different noise levels within this study. This theory
drove the choice of different types of tasks in the design of this experiment to study the effect of
5 2.2 Noise Interruption
Several studies have shown that introducing noise to an individual during a task has
measurable effects on workload and task performance (Becker, Warm, Dember, & Hancock,
1995; Gabbard, 2017; Hygge, & Knez, 2001; Jerison, 1959; Levy-Leboyer, 1989; Szalma &
Hancock, 2011; Tafalla & Evans, 1997). In addition, a number of these studies characterize noise
in different ways: low frequency hum, music, office noise, background speech (Dobbs et al.,
2011; Furnham, & Strbac, 2002; Jafari & Kazempour, 2013; Jahncke, Björkeholm, Marsh,
Odelius, & Sörqvist, 2016). However, they all have the commonality that noise is considered to
be an auditory interruption to the main work of the subjects in the experiment.
MRT is based on the ideaof multiple separate resources (verbal, auditory, visual,
perceptual, cognitive, and spatial) with a limited capacity. Each task presented to an individual
is allocated to a specific resource (Basil, 1994; Rubio et al., 2004; Horrey and Wickens, 2006;
Wickens & Wickens, 2008). Though these resources are separate from each other, there can be
interference or “resource competition” when two or more resources are occupied simultaneously
in a subject (Horrey and Wickens, 2006). This theory explains why human performance during a
task focusing on one source (i.e. visual) can suffer when another resource (i.e. auditory) is
causing interference.
A study at the University of Cincinnati had students perform a detection task under no
noise, low noise, and high noise conditions (Becker et al., 1995). Not only did their detection
performance decrease with noise, but their perceived mental workload increased. Another study
found that noise appeared to have the same effect (Tafalla & Evans, 1997). Given an arithmetic
6
high effort conditions and thus high workload conditions. When noise was present, the reaction
time slowed and effort was low.
A more recent study analyzed the performance of 40 male subjects during noise
interruption (Nassiri et al., 2013). The task involved the use of hand tools while testing
steadiness and dexterity. The results showed that intermediate noise worsened the subjective work environment of the participants, but treble noise reduced the subject’s performance.
Another study found similar results when office noise was in the background during task
performance of 30 students (Jahncke et al., 2016). In this case, each participant experienced
office noise in the background during their task. Some participants were split into another
experimental group that wore headphones with nature sounds to mask the office noises. The
students who performed the tasks without masking had lower performance compared to when the
noise was masked.
This research study uses headphones to play the noise. These headphones were worn for
all three noise levels. These noise levels were office noise, white noise, and no noise. Varying
the sound playing in the background with these levels will determine whether one noise level has
a stronger effect than another.
2.3 Mental Workload Analysis 2.3.1 NASA TLX
The NASA Task Load Index (NASA-TLX) is a validated source for measuring subjective
mental workload in studies concerned with the cognitive load on subjects (Hart, 2006; Francisco
Ruiz-Rabelo et al., 2015; Gerhard & de Winter, 2015; Hu, Lu, Tan, & Lomanto, 2016; Liang,
7
2004; Sönmez, Oğuz, Kutlu, & Yıldırım, 2017). The dimensions that the NASA-TLX assess are
mental demand, physical demand, temporal demand, performance, effort, and frustration. Each
dimension is rated by subjects on a scale out of 20, and each rating can either be weighted to
obtain a global score or taken as a sum of all six dimensions together to obtain a raw score
(Francisco Ruiz-Rabelo et al, 2015; Rubio et al. 2004). There are other mental workload
questionnaires that exist, such as the Subjective Workload Assessment Technique (SWAT) and
Workload Profile (WP). NASA-TLX was chosen for this study because of its better range for a
rating scale, the number of dimensions that directly relate to the study (mental workload,
frustration, temporal demand, and effort), and the lack of time pressure ratings, which was not
necessary for the study (Rubio et al., 2004).
2.3.2 Eye-tracking
Eye tracking parameters, such as blinks, fixations, saccades, and pupil dilation, are a
relevant way to track mental workload of a subject (Cardona & Quevedo, 2014; Gao, Wang, Li,
Dong, & Song, 2013; Gerhard & Joost, 2015; He, Wang, Gao, & Chen, 2012; Holmqvist et al.,
2011; Marquart, Cabrall, & de Winter, 2015; Tokuda, Obinata, Palmer, & Chaparro, 2011; Van
Orden, Limbert, Makeig, & Jung, 2001). Marquart, Cabrall, and de Winter (2015) utilized an
arithmetic task and viewed the changes in the pupil diameter. The results showed that the mean
pupil diameter and the change in pupil diameter correlated with the difficulty of the arithmetic
problem that was presented to the subject. While He et al. (2012) also investigated the pupil size
as a means of mental workload, they also examined fixation duration. While fixation duration
decreased with increased time pressure of the task for smaller time pressures, it increased when
the pressure began to overload the subject mentally. As in previous studies, He et al. (2012)
8
Dong, and Song (2013) compared seven different eye-tracking measures and found that blink
rate was sensitive to overall task complexity and blink duration increased over the task period.
However, Faure, Lobjois, and Benguigui (2016) attempted to use blink rate as a means of
quantifying mental workload and found that there was not a significant correlation.
Cardona and Quevedo (2014) found that blink rate did not vary significantly across
complexity levels; however, large amplitude saccades (i.e. the angular distance the eye moves)
accompanied with a blink was related to high cognitive demands. The main findings of Tokuda,
Obinata, Palmer, and Chaparro (2011) showed that saccadic intrusions (SI) were regularly
observed during higher mental workload. SI is a type of eye movement that is jerky and quick.
Compared to a micro-saccade (also a quick, jerky eye movement) SI has a larger amplitude and
does not usually change gaze direction. Pupil diameter is also related to mental workload;
however, SI was still a better indicator of mental workload for this study (Tokuda, Obinata,
Palmer, & Chaparro, 2011).
Van Orden, Limbert, Makeig, and Jung (2001) found that different eye-tracking
parameters distinguished mental workload. They used target density in a mock air warfare task to
vary the task complexity, thus changing the mental workload of the subjects that performed the
tasks. There was a decrease in blink duration and frequency when the target density (complexity)
increased. The opposite happened with fixation frequency; more fixations occurred when the
target density increased.
This research study utilized several eye-tracking parameters. Pupil diameter mean was
9
deviation for the subjects was also calculated. Automatic gaze mapping was utilized on two
tasks to assess the fixation rates, fixation durations, and fixation counts during those tasks.
2.3.3 Heart Rate Variability
Heart rate variability can be used as a physiological measure of mental workload in
several ways. There are several HRV parameters that can be calculated by using the R-R
interval. Figure 1 shows an illustration of an R-R interval.
Figure 1: Illustration of R-R interval in EKG signal
Mansikka, Virtanen, Harris, and Simola (2016) provide a table that helps in interpreting
heart rate variability and how it changes with pilot mental workload (PMWL). Though the tasks
presented in this study are not the same as those required of a pilot, they are tasks that may cause
increased cognitive load. Thus, the PMWL presented in Table 1 created by Mansikka et al.
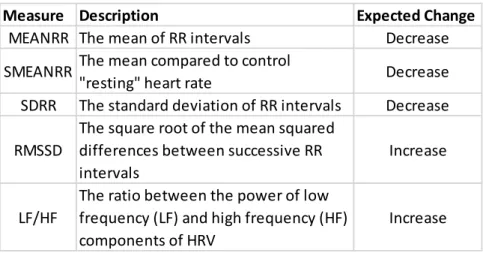
(2016) can relate to this study as well. Table 1 summarizes what occurs to the HRV measures
with this study with increased mental workload. The parameters found in the table can be
calculated using the R-R intervals (also referred to as normal to normal or N-N intervals). R-R interval
10
Table 1: HR and HRV parameters with expected changes with increased mental workload
Mansikka, Virtanen, Harris, and Simola (2016) were able to differentiate autonomous
nervous system response variation between the task segments, rather than just between rest and
trial conditions. While there were significant HRV/HR differences between segments of the
tasks, there were no significant differences in performance. This is a strange phenomenon
considering that other studies found performance to decrease when mental workload increases
(Hu et al., 2016; Nickels, 2014; Prabhu, Smith, Yurko, Acker, & Stefanidis, 2010).
Analysis of HRV defines two different categories of parameters: time domain measures
and frequency domain analysis. LF, HF, and LF/HF all assess variance over a longer period of
time in terms of frequency. RMSSD, SDNN, and MEANRR utilize the normal to normal beat
intervals (time between heart beats) (Heine, Lenis, Reichensperger, Beran, Doessel, & Deml,
2017; Mansikka et al., 2016; Sugimoto, Kitamura, Murai, Wang, and Wang, 2016). These time
and frequency domain measures have been analyzed in studies concerned with mental workload.
One study examined drivers’ mental workload by using a series of R-R intervals gathered from
the subjects and analyzed them based on rhythmical or morphological features (based on the
quantifying form of the ECG waves) (Heine et al., 2017). Unfortunately, none of the features
could distinguish the different levels of mental workload. Sugimoto, Kitamura, Murai, Wang,
Measure Description Expected Change
MEANRR The mean of RR intervals Decrease
SMEANRR The mean compared to control
"resting" heart rate Decrease
SDRR The standard deviation of RR intervals Decrease RMSSD
The square root of the mean squared differences between successive RR intervals
Increase
LF/HF
The ratio between the power of low frequency (LF) and high frequency (HF) components of HRV
11
and Wang (2016) not only used the time domain measures of R-R intervals, but the low/high
frequency (LF/HF) components of the ECG as well. The study showed an increase in LF/HF,
thus an increase in mental workload, through specific events during the study.
The following study gathered R-R intervals and used them to obtain frequency domain
and time domain measures. The frequency domain parameters taken from the R-R interval data
was LF/ HF. The ratio of LF/HF is assumed to show a shift in dominance from the
parasympathetic to the sympathetic (Billman, 2013). The ratio of LF/HF has been shown to
increase when mental workload increases, which correlates with this shift to the sympathetic
nervous system. The high frequency range is 0.15 to 0.4 hertz, while low frequency range is 0.04
to 0.15. These frequency components are partitioned from the total variance of the continuous
series of beats (Billman, 2013; Mansikka, et al., 2016). Because the time interval the data was
collected from was short, statistical significance was not expected from the frequency domain
parameter; thus, only the LF/HF ratio was used in the analysis. The time domain parameters that
were taken from the data were the mean of the normal to normal beats, the standard deviation of
the normal to normal beats, and the square root of the mean squared difference (RMSSD)
between normal to normal beats. Because the mean is not normalized, and humans tend to have
different resting heart rates, another parameter, standardized mean R-R intervals, will be
analyzed as well to counteract this phenomenon in this study. The standard deviation examines
the change in the R-R intervals of each subject, so it is not necessary to compare this value to a
control. This is also holds true for the RMSSD value (1).
𝑅𝑀𝑆𝑆𝐷 = √ 1
𝑛−1∑ (𝑅𝑅𝑖+1− 𝑅𝑅𝑖)2 𝑛−1
12
For equating the RMSSD value, the initial normal to normal or R-R interval (𝑅𝑅𝑖) is subtracted from the next R-R interval(𝑅𝑅𝑖+1). This difference is squared, while the next two intervals are taken and squared and so on until the end of the specified time interval. After this,
the number of sampled R-R intervals (n) in this time interval are considered via division before
square rooting (Vollmer, 2015). The mean and standard deviation of the R-R intervals are
suspected to decrease whereas the RMSSD is suspected to increase (Mansikka et al., 2016). A
study by Guo, Tian, Tan, Zhao, and Li (2016) agreed with the RMSSD value increasing with
mental workload, but the standard deviation of R-R intervals increased. Yet, another study
conducted by Arnrich, Cinaz, Arnrich, La Marca, & Troester (2011) resulted in a decrease
RMSSD value, disagreeing with Table 1. Research is inconclusive and more is necessary to
definitively prove that a certain change in a physiological parameter like RMSSD or standard
deviation of R-R intervals correlates with a change in mental workload.
2.4 Personality
Personality tests are widely used in psychology to assess the mindset of humans. If
features of personality interact with environmental variables to affect performance, personality tests can be further used to ultimately customize an individual’s work environment.
Since there are a myriad of personality tests to choose from this study conducted a review
to determine the most appropriate test for the participants of this study. The tests that were
reviewed include the Myers-Briggs, Eysenck Personality Questionnaire, and Big Five Inventory.
Myers-Briggs is among the most common personality tests (Pittenger, 1993; Gerras &
Wong, 2016, Cooper, McCord, Campbell, 2017; Boonghee Neelankavil, de Guzman, & Lim,
13
schools, churches, the workplace, and counseling centers (Pittenger, 1993). Many users have
accessed the true form of the Myers-Briggs while others have found an online version that was
not a true copy of the test. Myers-Briggs personalities are based on typologies, or distinct
groups of people that the user taking the test can fit into, such as ISTJ (Introverted, Sensing,
Thinking, Judging) or ENFP (Extroverted, Intuition, Feeling, Perceiving). The assignment of
people into one of 16 groups is restrictive because the idea of the user fitting into more than one
group is not accounted for (Myers, 2016; Pittenger, 2005). While a person may fall into an ISFP
group, their other personality traits that are not covered by the test may closely resemble one of
the other fifteen groups. The Myers-Briggs also will place someone into one group, even though
one of their scores barely allows them into that group because they were on the edge or middle
percentile. If a user takes the test and scores 1 percent more for introversion than extroversion,
they are placed into a group known as “Introverts.” The scale scores for introvert vs. extrovert or
any of the three other personality type pairs must be sufficiently large to make a definite
distinction and place an individual into a group (Pittenger, 2005).
Another personality test that is widely used is the Eysenck Personality Questionnaire
(EPQ). Several studies that have tested a noisy and quiet work environment have provided this
test to their participants (Furnham, & Strbac, 2002; Belojevic, Jakovljevic, & Slepcevic, 2003;
Dobbs et al., 2017; Jafari & Kazempour, 2013). The noisy backgrounds common in the studies
that incorporated the EPQ ranged from a “white noise” effect with a low frequency hum to
music. These studies found that under noisy conditions, extroverts performed better and/or faster
on one or more tasks, where introverts did not improve or even decreased in performance levels
14
Over the span of 50 years, the EPQ has changed dramatically, with the early form called
Maudsley Medical Questionnaire having 40 items and the Revised Eysenck Personality
Questionnaire (EPQR) in 1985 containing 100 items (Francis, Lewis, & Ziebertz, 2006; Gentry,
Wakefield, & Friedman, 1985). While a shorter form was devised in 1985 (EPQR-S), the
48-question test requires further research to test the validity (Francis et al., 2006). The EPQ test surveys an individual’s extroversion, neuroticism, and psychoticism while also producing a “lie
score”, that tells the experimenter whether the person taking the test is lying to make themselves
look good (Gentry et al., 1985).
The last personality test reviewed was the Big Five Inventory. Created in the 1980s, the
Big Five Inventory is composed of short phrases in a 44-item inventory, measured 5 different
dimensions, and takes 5 minutes or less to finish (Rammstedt & John, 2007). Multiple studies
have validated the Big Five Inventory’s use in determining job performance (Aarde, Meiring, &
Wiernik, 2017; Rodriques & Rebelo, 2013; Judge, Rodell, Klinger, & Simon, 2013; Alessandri
& Veccione, 2012). Despite its short test time, the Big Five Inventory has proven to be a reliable
and valid survey around the world (Alansari, 2016; Aterberry, Martens, Cadigan, & Rohrer,
2014; Lovik, Verbeke, & Molenberghs, 2017; Reyes Zamorano, Álvarez Carrillo, Peredo Silva,
Sandoval, & Rebolledo Pastrana, 2014) One study tested the validity of the Big Five using 685
undergraduate students from Kuwait. The study’s primary purpose was to test the reliability and
validity of the Arabic translation of the Big Five (Alansari, 2016). A Belgium paper analyzed a
study that used a Dutch version of the Big Five (Lovik et al., 2017). The study utilized a Flemish
population sample where nearly 10,000 surveys were collected. The analysis of the original
study validated the imposed five-factor structure of the Dutch version of the personality test.
15
that the reliability score of the Big Five Inventory was acceptable (Aterberry et al., 2014). In
Mexico City, a population of 472 adult male and females took the Big Five Inventory (Reyes
Zamorano et al., 2014). The large sample size was used to determine the reliability of the test,
which was proven in the study using a specific procedure that gave them a reliability score.
Taken together, all of these recent studies found the Big Five Inventory to be reliable, even as it
travelled across borders.
The Myers-Briggs is often passed around to individuals within companies, school, and
churches to assess personality while others take a free yet potentially inaccurate version online.
Because there is the chance that answers will be skewed due to participants already taking a form
of the test before and being placed into a particular typology group, the widespread
Myers-Briggs was not chosen for this study. The EPQ is a test with a lengthy read time, but only three
personality dimensions analyzed. While the three facets in this test do breakdown further, the
three aspects are not favorable for a study that is looking for the effect of not only noise, but
stress when performing a task. Because there are three tasks in the study, each being performed
more than once, a shorter test than the EPQ was desired (Francis et al., 2006). Thus, a personality
test that was quicker, easier, and had more facets that supported the study was preferred. The
Big Five Inventory, as stated previously, takes only a few minutes to administer to a user. The
five dimensions presented in the Big Five were believed to best correlate to the test variables
presented in this study. These items include extroversion vs. introversion, openness vs.
closedness to experience, emotional stability vs. neuroticism, agreeableness vs disagreeableness,
and conscientiousness vs. lack of direction (John, Naumann, & Soto, 2008). In addition to this,
16
important measure for this study since many of the participants come from a university with a
diverse population of students.
3.0 Methods
3.1 Experimental Design
The goal of this study is to understand whether task performance, mental workload, and
duration of different types of tasks are impacted by noise. The study was a 3 x 3 experimental
design with no repetition of any factor level. Thus, this experiment was neither a within or
between subject design. This type of design allowed for all the factor levels to be experienced
once by every subject without the subject potentially getting used to a level that they have
already experienced. Further tables and illustrations of the experimental design and combination
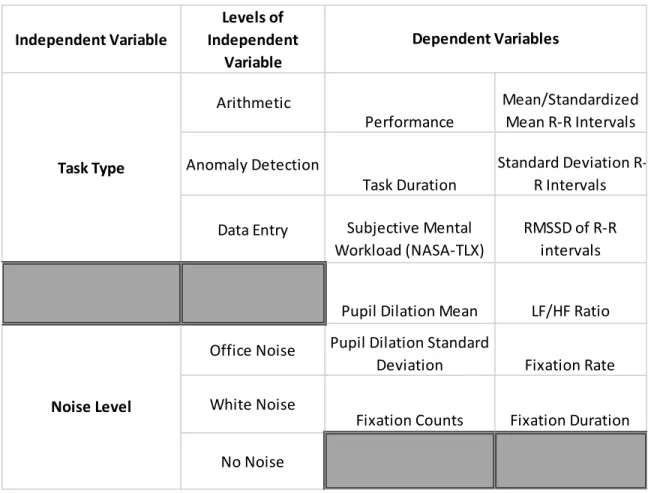
distribution can be found in Appendix A. The independent variables are task (data entry,
anomaly detection, and mathematical arithmetic) and noise type (white, office, and no noise).
The dependent variables are performance, duration, and mental workload (subjective and
17
Table 2: Independent and Dependent Variable Lists
3.2 Participants
The experiment included 60 participants, 29 females, and 31 males, recruited from
Wright State University. Ages of participants range from 18-31 (M=22.7, SD=2.1). The subjects
were assigned the all three task types and the all three sounds, but the combination of the sound
condition and task types were determined randomly. The order for each task-noise pairing, total
of nine pairings, was randomized using Microsoft Office Excel 2016. This study was approved by the Wright State University’s Institutional Review Board. Participants were not monetarily
compensated for their participation, but those who were eligible for extra credit in their classes
for participating in a study were able to use their participation for this credit. Independent Variable Levels of Independent Variable Arithmetic Performance Mean/Standardized Mean R-R Intervals Anomaly Detection Task Duration Standard Deviation R-R Intervals
Data Entry Subjective Mental
Workload (NASA-TLX)
RMSSD of R-R intervals
Pupil Dilation Mean LF/HF Ratio Office Noise Pupil Dilation Standard
Deviation Fixation Rate
White Noise
Fixation Counts Fixation Duration No Noise
Dependent Variables
Task Type
18 3.3 Stimuli and Apparatus
The experiment was conducted in the Neuroscience Engineering Collaboration building
Lab 431 where both temperature and lighting were held constant. Prior to the study, a Well at
Walgreens Deluxe Arm Blood Pressure Monitor was used to collect blood pressure and pulse
rate data. Additionally, a noise tolerance questionnaire and the Big Five Questionnaire (found in
Appendix B) were given to the subject at the beginning of the experiment. The NASA-TLX was
prescribed after each task. During the actual experiment, a Biopac Student Lab MP36 Data
Acquisition Unit was used to collect EKG data. Tobii Pro Glasses 2 were placed on each
participant along with headphones. The computer, used for the data entry task, had a monitor that
measured 15 inches diagonal, while the GUI itself on the computer screen measured 2 by 6
inches. A Grafco 5709 manual pill counter was used for the mathematical arithmetic task, while
a Restar 2.4 GHz Laser Presenter was used by the subject to circle anomalies in the anomaly
detection task.
Noise Level. ATH-M40x Professional Monitor Headphones were kept on the participant
throughout the experiment regardless of the sound playing. The noise was placed at a safe level,
approximately 67 dB (Rabinowitzs, 2000). The control level was simply no noise, the next level
was a crowd of people talking vaguely (representing a white noise effect), and the last noise level
was intermittent office noises: copy machine, typing on a keyboard, phone ringing, and jet flying
overhead.
Task Type. The three tasks were related to the medical field. The data entry task mimics the task
a nurse must do to gather patient information and type it into an EHR on a computer (the
19
used four x-rays of the same body part in each of five sets. In each set, one of the four x-rays
had an anomaly. An example x-ray set with the anomaly circled can be found in Figure 3. The
third task was a mathematical arithmetic task that used a pharmaceutical pill counter, pill bottles,
and beads (to represent pills). A photo of the mathematical arithmetic task set-up and problem set
can be seen in Figure 4.
Figure 2: Graphical user interface for data entry task
20
Figure 4: Arithmetic task set-up with manual pill counter, beads, and pill bottle
3.4 Procedure
After signing the informed consent, the subject filled out the noise tolerance
questionnaire and the Big Five Inventory (questionnaires found in Appendix B). Once
completed, the subject was asked their age. Then, their blood pressure and pulse rate were taken,
and they were asked whether these values were normal. If blood pressure cuff reading was not
successful after three attempts, the pulse rate was taken manually at the left wrist by the principal
investigator. The subject was then asked to clean the skin on both inner ankles and the inner
wrist of their non-dominant side. Once dry, disposable electrodes were attached so the Biopac
system could collect EKG data. Tobii Pro Glasses 2 wearable eye tracker was placed on the face
of the subject. Headphones were placed over the subject’s ears to be worn throughout the
experiment while the glasses were calibrated, and EKG signal was checked for any problems
with the signal. To ensure that the subject could hear the sound coming from the headphones, the
sound was played and they were asked if they could hear the sound and if it was too loud. If the
sound was too loud for the subject, the noise was turned down until the subject was comfortable
21
The subject was given instruction on each task and verbally confirmed their
understanding of the task to be performed. The anomaly detection task had two example sets of
x-rays given to the subject for brief training on what sort of anomalies will appear in the five
sets. As the subject performed the three tasks, they were exposed to three different background
noise levels. At the end of each task, a NASA-TLX was completed by the subject based on the
task just performed. The experiment was considered complete once all three tasks were finished
and the corresponding NASA-TLX questionnaire for the last task was filled out. The EKG signal
was saved, the eye-tracking recording stopped and stored, and the subject was permitted to
remove the data collecting equipment and leave.
3.5 Data Analysis 3.5.1 Performance Scoring
Each task was graded on a different scale, but all were converted to percentages for
analysis. The anomaly detection task gave the subject three opportunities to identify the anomaly
correctly on each of the five sets. The anomaly detection task was graded on a 15-point scale,
meaning that each set had 3 points possible associated with the 3 guesses allotted. The subject
started with 15 points, and each wrong answer subtracted a point from their total score. The
lowest score possible of 0/15 meant that the subject did not answer any of the anomalies
correctly, where a 15/15 meant that the subject had no wrong answers.
The data entry task was graded on a 10-point scale, each point associated with one entry
on the GUI. A complete wrong answer or blank entries meant no point was received for that
22
So, a 0/10 meant that all the entries were wrong or empty and a 10/10 meant all the entries were
filled in completely with the correct spelling.
The mathematical arithmetic task was the most complex task to score because of all the
possible mistakes that could occur. So, each correct pill in each bottle was worth one point for a
total of 38 points. A point was received for each bead that was correct. Since there was no way to
interpret the mental arithmetic of the subject during the task, each bottle was scored solely on the
correct bead placement for each problem. Each bottle was associated with one problem for a total
of five problems/bottles.
The three scores associated with the three tasks for each subject were placed in JMP® by
SAS® (2014) for ANOVA and correlational testing.
3.5.2 Duration of task
Each task was timed, starting when the principal investigator verbally told the subject to
start and ending when the subject completed the task. None of the subjects were told that the
tasks were timed, and no time constraint was set in place to avoid undesired mental workload
due to time pressure felt by the subject. The stress of noise on each of the tasks was the desired
factor to be assessed, not time pressure. The duration of each task was placed into JMP® by
SAS® (2014) for ANOVA and correlational tests.
3.5.3 NASA-TLX
The NASA-TLX is based on a 20-point scale. The scales from each NASA-TLX were
summed and the raw score was taken for analysis (Rubio et al. 2004). Because there were three
23
mental workload scores. The scores were placed into JMP® by SAS® (2014) for ANOVA and
correlational tests.
3.5.4 Eye-tracking
The files created from the Tobii Eyetracking Controller Software were imported into the
Tobii Analyzer software for analysis. Only the anomaly detection task and the data entry tasks
were given areas of interest (AOI) to analyze the fixation rate, fixation duration, and fixation
counts from the task. An AOI provided a set region within the task’s stimulus for which more
information would like to be gathered, i.e. the fixation parameters (Holmqvist et al., 2011). The
AOIs for this study can be seen in Appendix C.
The task intervals were manually marked, and the gaze data for the AOIs was mapped
automatically using the software. All the tasks were analyzed for pupil diameter. Thus, the
anomaly and data entry task had a separate analysis in JMP® by SAS® (2014). All three tasks
and noise levels were included with the dependent variable pupil diameter based on average
difference from the control, which was recorded when no task was being performed from the
start of the recording to start of the first task.
3.5.5 Heart Rate Variability
Using Python IDLE Version 3.6, Biopac acquisition files were converted into a readable
text file format. A MATLAB (The Mathworks, Inc) code scanned through the file to obtain the
R-R intervals. These intervals were sifted through to obtain the LF/HF, R-R interval means,
standard deviation of R- R intervals, and the root mean squared differences of successive R-R
intervals. There were three total numbers taken for each parameter from each subject to compare
the three tasks and the three noise levels. For control comparison, the first 60 seconds before the
24
the start of their task, and instead, the chunk of time before the task was recorded instead. During
this time, the subject was given instructions. Recording the EKG signal only 60 seconds before
the task ensured that these longer intervals with issues where electrodes may have needed
adjustment were not taken as the control. This control allowed for further comparison between
when the subject was not working a task to when they were for the standardized mean R-R
interval parameter.
3.6 Hypotheses 3.6.1 Performance
This study hypothesized that when noise interrupts the human subject, task performance
will decrease. Based on the hypothesis, the no noise condition should show the best performance
scores on average, and the office noise (deemed as the more disruptive noise condition) should
show the lowest performance averages. As for task conditions, it is predicted that being a simpler
task, the data entry task will show relatively high scores. However, due to the concept of MRT,
this task will have worse performance scores when noise interrupts (the interaction of this task
and noise will show lower scores than other tasks and noise interactions). Data entry requires the
auditory and verbal cognitive channels while the other tasks do not. The noise will interfere with
the auditory channel, which leaves more possibilities for errors.
3.6.2 Duration of the Tasks
The study hypothesized that the duration of the task will increase when noise is played in
the background. The reasoning for this was that when the subject is interrupted, the subject must
recover before returning to the task at hand, a process that will require time. The task that is
predicted to take the most time is the arithmetic task due to the intense working memory and
25
the beads and placing them into the bottles. However, the task type and noise interaction that is
predicted to show the higher task durations, again, the data entry task with office noise due to the
auditory channels being overwhelmed when they are needed for the task.
3.6.3 NASA-TLX Mental Workload
The NASA-TLX subjective workload has different predictions in terms of the task.
Despite MRT, it is hypothesized that the subject will rate the arithmetic task higher because of
the amount of working memory necessary to complete this task. The noise that is predicted to
show the higher raw NASA-TLX scores on average is the office noise because of the disruptive
work environment the sounds create for the subject. As far as interaction, the office noise and
arithmetic task interaction is predicted to show the higher subject mental workload scores
because of the intermittent, non-continuous nature of this auditory work environment and the
mental math the subject must do to complete the task.
3.6.4 Eye-tracking and HRV Parameters
The eye-tracking parameters that were analyzed are pupil diameter for all tasks and
fixation rates, counts, and durations for the anomaly detection and data entry tasks. It is
hypothesized that an increase in pupil diameter will indicate an increase in subject mental
workload (He et al., 2012). This parameter was normalized by taking the difference of it and the
control (time before the first task start). However, the pupil diameter’s standard deviation (not
normalized) will decrease with increased workload (Othman & Romli, 2016). For heart rate
variability, the predictions follow those of Table 1 when mental workload increases: mean and
standard deviation of R intervals will decrease, root mean squared differences of successive
R-R intervals will increase, and the LF/HF ratio will increase. If the mean is suspected to decrease
26
same if the task’s values are subtracted from the control. The control should have a greater heart
rate mean than when the subject is performing a mentally demanding task. The more demanding,
the lower mean, the less the difference between the control and task mean R-R intervals will be
(some will even be negative). It is predicted that the same tasks, noises, and task type noise
interactions observed as mental overload using subjective measures will also be observed using
physiological measures.
Fixation rates, counts, and durations were analyzed in two separate one-way ANOVAs in order
to ensure that noise was the only factor analyzed. It is hypothesized that the office noise will
create a more mentally taxing work environment for the subject because it is more disruptive.
The no noise condition will show less of an impact on mental workload. For these parameters,
when mental workload increases, the fixation counts will increase while the fixation duration and
rates will decrease (He et al., 2012; Holmquist et al., 2011; and Van Orden et al., 2001).
4.0 Results
From this study’s 60 subjects, the data for 2 subjects were completely excluded due to an
issue with the sound system and a misunderstanding with one of the subject’s arithmetic tasks.
To perform the statistical analysis, all the data was placed into JMP® by SAS® (2014).
Two-way ANOVAs for the two independent variables (task type and noise level) was performed. All
residual plots testing for normality and unequal variances can be found in Appendix D. The
connecting letters reports, created using Tukey’s HSD test, and interaction plots (for
performance, task duration, and NASA-TLX scores) can be found in Appendix E.
All analysis of the physiological measures of mental workload used the same sample size,
27
were excluded from the analysis if less than 70% gaze data was collected, their EKG signal was
too noisy, or a technical difficulty occurred. After consideration, a total of 10 of the 60 subjects
were removed from this analysis. The eye-tracking and HRV data was also analyzed using
JMP® by SAS® (2014). However, instead of a two-way ANOVA for the AOI parameters
(fixation counts, fixation duration, and fixation rate) a one-way ANOVA was conducted for each
of the two tasks that had AOIs (data entry and anomaly detection). The values provided in this
section with ANOVA as the statistcal analysis are written as (mean ± standard error). The F ratio
and p-value are also given in the text as well as in the ANOVA tables. Both Microsoft Office
Excel 2016 and JMP® by SAS® (2014) were used for the correlation tests of personality and
noise tolerance measures, two factors that could not easily be controlled in the experiment.
4.1 Performance
There was no strong evidence, provided by the residual plots in Appendix D, that the
variances were different for the performance scores among the three tasks. The residual plots that
tested for normality did not show significant evidence to say that the data was not normally
28
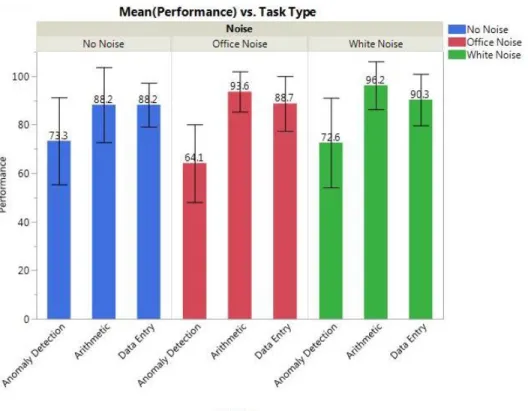
Figure 5: Average task type and noise level vs. performance (error bars are standard deviation)
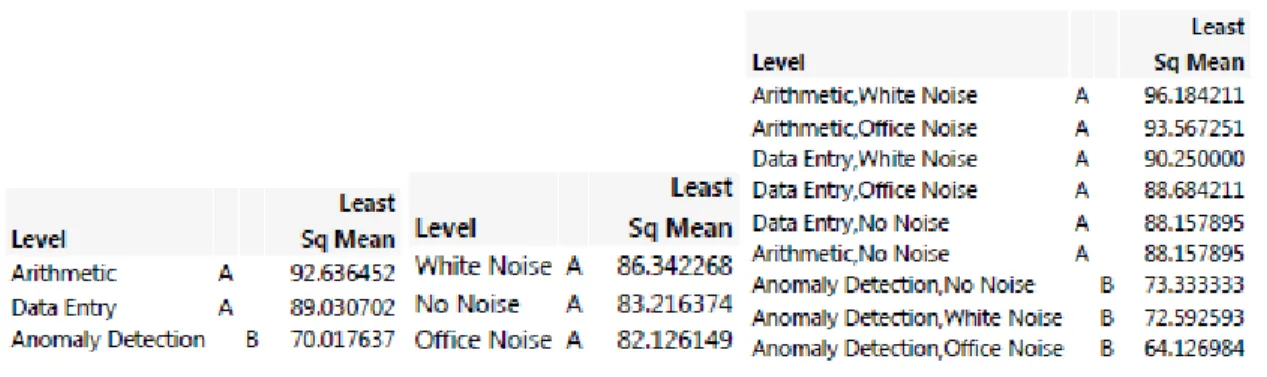
Figure 5 shows a graph of the performance scores average of the different task type under
the three noise conditions. The lowest performance appears to be from the anomaly detection
task while the arithmetic task appears to have the higher scores. Statistical analysis agrees with
this trend. The model showed significance in terms of performance [F(8, 165) = 13.22,
p=<.0001]. The task type with the highest performance score average was the arithmetic task
(92.60 ± 1.78) while the lowest was the anomaly detection task (70.02 ± 1.77). The noise with
the highest performance average was white noise (86.82 ± 1.77) and the lowest was office noise
(81.3 ± 1.78). As far as interactions, the highest performance score was the arithmetic task with
white noise (96.18 ± 3.02) and the lowest performance score average is the interaction of
29
Table 2 shows the ANOVA table for the performance metric. The task type factor
showed significance in influencing the performance scores (p-value < 0.0001), but the noise
level did not. Figure 6 shows the connecting letters reports for each task level and the
interactions that further reveals the separation of anomaly detection from the rest of the tasks for
performance scores.
Table 3: ANOVA for task performance
Source DF F ratio p-value
Model 8 13.2252 <.0001
Error 165
Total 173
Source DF F ratio p-value
Task Type 2 49.8471 <.0001
Noise 2 1.5199 0.2218
Task Type * Noise 4 1.6065 0.175
30 4.2 Duration
According to the residual plots in Appendix D, there was no strong evidence to suggest
that there were unequal variances for the duration times (recorded strictly in minutes, not
seconds) or that the duration data was not normally distributed.
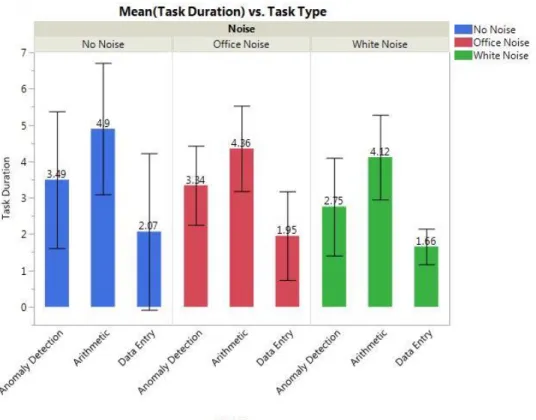
Figure 7: Average of task duration vs. task type and noise level
From Figure 7, the data entry task appears to take the shortest amount of time to complete
and the arithmetic task takes the longest. The statistics show the same conclusion as the averages
presented in the graph. The model showed significance in terms of duration [F(8, 165) = 12.30,
p=<.0001]. The arithmetic task had the longest task duration average (4.46 min ± 0.19) and the
shortest task duration average for task type was data entry (1.89 min ± 0.19). The longest task
31
for noise level was white noise (2.85 ± 0.19). For task type and noise interactions, the longest
task duration average occurs in the interaction of arithmetic task and no noise (4.90 ± 0.32) and
the shortest average duration occurs in the interaction of data entry task and white noise (1.66 ±
0.32).
Table 3 displays the ANOVA table for the task duration times. Figure 8 displays the
differences between the task levels and the connecting letters report and how the no noise and
white noise level are different, but both connected to the disruptive noise level.
Table 4: ANOVA for task duration
Source DF F ratio p-value
Model 8 12.30435 <.0001
Error 165
Total 173
Source DF F ratio p-value
Task Type 2 45.5581 <.0001
Noise 2 2.9149 0.057
Task Type * Noise 4 0.202 0.937
32 4.3 NASA-TLX Mental Workload
According to the residual plots in Appendix D, there was no strong evidence to suggest
that there were unequal variances for the NASA-TLX raw or that the data was not normally
distributed.
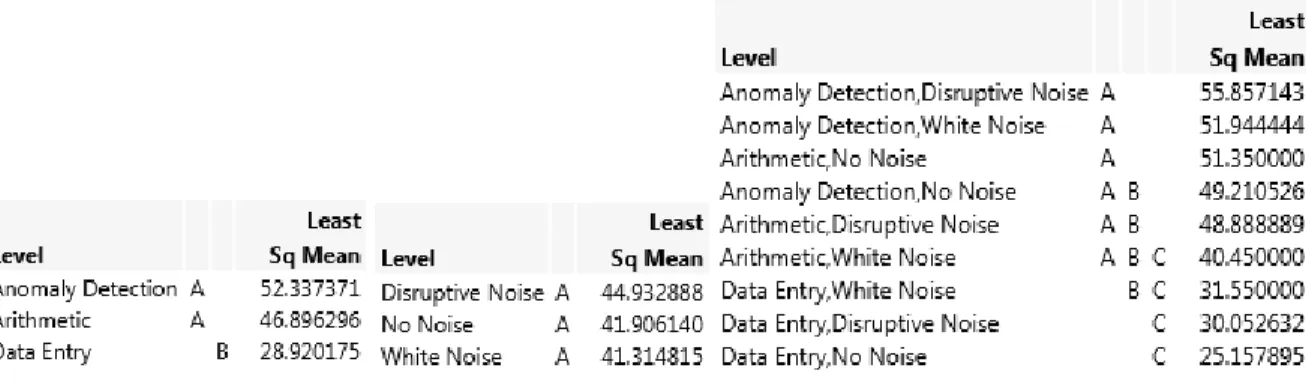
Figure 9: Averages of NASA-TLX scores vs. task type and noise level
As with the other graphs that display the averages of the dependent variables, the
conclusion drawn from Figure 9 on NASA-TLX scores match that of the statistical analysis.
Data entry appears to have the lowest scores, meaning the lowest stress felt by the subject.
Anomaly detection task seems to have the higher scores in most cases except for the no noise
condition where arithmetic pulls ahead slightly. The model showed significance in terms of
33
raw NASA-TLX mental workload scores was anomaly detection (52.47 ± 2.32), the lowest raw
score average task type being data entry (28.92 ± 2.32). As for the noise level, the highest
NASA-TLX scores average was found in tasks with office noise playing in the background
(45.24 ± 2.32) and the lowest when white noise played in the background (40.95 ± 2.32). As for
the interactions, the highest scores on average came from the anomaly detection and office noise
interaction (55.86 ± 3.85) and the lowest coming for the no noise and data entry interaction
(25.16 ± 4.05).
Table 4 shows the ANOVA for the subject mental workload raw scores that came from
summing the scores of the NASA-TLX for each task. Figure 10 shows the connecting letters
reports for task type and noise level. It shows that the data entry task is different than the other
two tasks for mental workload scores, but the mental workload scores did not change when the
noise level changed because the letters are all similar.
Table 5: ANOVA for NASA-TLX mental workload scores
Source DF F ratio p-value
Model 8 7.885192 <.0001
Error 165
Total 173
Source DF F ratio p-value
Task Type 2 27.9313 <.0001
Noise 2 0.6995 0.4983
34
Figure 10: Task type, noise level, and task type*noise level interaction connecting letters reports for NASA-TLX scores
4.4 Physiological Mental Workload
As stated before, the physiological mental workload measures were given different
sample sizes due to the issues that occurred with the Tobii Eye-tracking and Biopac systems. The
same two subjects that were removed for the main ANOVA were removed from this analysis.
Three more subjects were removed due to the noisy EKG signals while another subject was
removed because the cord for the EKG recording came un-plugged during the experiment,
unbeknownst to the PI until after the task was finished. Five more subjects were removed
because of the low gaze data score (<70%). Thus, the sample size subjected to analysis was 50
subjects as opposed to the original 60 subjects that were run for the experiment. According to
the residuals plots in Appendix D, there was no significant evidence that the variances for any of
the physiological data were unequal or the data was not normally distributed. Appendix E has all
of the connecting letters reports.
4.4.1 Heart Rate Variability Analysis
As stated earlier, there were four parameters that were analyzed for heart rate variability,
one frequency domain (LF/HF) and three-time domain (mean, standard deviation, RMSSD)
35
The LF/HF ratio showed significance in the model [F(8,141) =4.0032, p=0.0003].When
the analysis was run, the highest LF/HF value for task type came from the anomaly detection
task (0.914 ± 0.038) and the lowest coming from the data entry task (0.65 ± 0.039). The noise
level with the highest LF/HF ratio was office noise (0.812 ± 0.038) while white noise had the
lowest ratio (0.6957 ± 0.0385). The task and noise type that had the highest LF/HF value
average was anomaly detection with office noise played in the background (0.994 ± 0.066) and
the lowest LF/HF average being when white noise was played in the background of the data
entry task (0.606 ± 0.062). An ANOVA table for this ratio is found in Table 5.
Table 6: ANOVA for LF/HF ratio
Source DF F ratio p-value
Model 8 4.003171 <.0003
Error 141
Total 149
Source DF F ratio p-value
Task Type 2 11.4415 <.0001
Noise 2 3.0275 0.0516
Task Type * Noise 4 0.5664 0.6874
The non-standardized mean did not show significance within the model [F(8,141) =
1.649, p=0.116]. However, the task type did have a statistically significant impact on the
non-standardized mean, despite the difference in resting heart rates [F(2, 141) = 4.7176, p=0.0104].
The task type with the lowest mean R-R intervals on average was data entry (0.694 ± 0.015)
while anomaly detection had the highest (0.755 ± 0.015). The task type that showed the highest
36
(0.694 ± 0.015). The highest mean R-R interval for noise level was office noise (0.723 ± 0.015)
while the lowest was white noise (0.709 ± 0.015). The interaction with the highest mean R-R
interval average was anomaly detection with office noise (0.770 ± 0.026). The lowest values for
interaction were found in the interaction of data entry with office noise (0.675 ± 0.026). The
standardized mean showed significance in the model [F (8, 141) =3.82, p=0.004]. For the
standardized mean, the highest task type was anomaly detection (0.055 ± 0.01) and the lowest
was data entry (-0.008 ± 0.01). The noise level that had the highest standardized mean was
office noise (0.022 ± 0.01) and the lowest was white noise (0.008 ± 0.01). When anomaly
detection had office noise played in the background, the standardized mean was the highest on
average (0.067 ± 0.017), and arithmetic task with white noise in the background had the lowest
standardized mean (-0.028 ± 0.018). The non-standardized mean and standardized mean
ANOVA tables are presented in Table 6 and 7.
Table 7: ANOVA for mean HRV (not standardized)
Source DF F ratio p-value
Model 8 1.649596 0.116
Error 141
Total 149
Source DF F ratio p-value
Task Type 2 4.7176 0.0104
Noise 2 0.2387 0.7880
37 Table 8: ANOVA for standardized mean HRV
Source DF F ratio p-value
Model 8 3.82 0.0004
Error 141
Total 149
Source DF F ratio p-value
Task Type 2 11.673 <0.0001
Noise 2 0.6072 0.5463
Task Type * Noise 4 1.5910 0.1800
Standard deviation of R-R intervals did show significance in the model [F(8,141) = 3.02,
p=0.0036].The task type that showed the lowest standard deviation in R-R intervals on average
was the anomaly detection task (0.07 ± 0.005) while the highest standard deviation came from
the data entry task (0.102 ± 0.005). Office noise, which played in the background for the task,
had the lowest standard deviation (0.08 ± 0.005) and “no noise” in the background had the
highest noise level R-R interval standard deviation average (0.09 ± 0.005). The task type and
noise level pairing, anomaly detection with office noise played in the background, showed the
lowest standard deviation R-R interval average (0.067 ± 0.009). The highest average pairing for
this HRV parameter was the “no noise” level played during the data entry task (0.121 ± 0.010). Table 8 displays the standard deviation HRV’s ANOVA values.
38 Table 9: ANOVA for standard deviation HRV
Source DF F ratio p-value
Model 8 3.022596 0.0036
Error 141
Total 149
Source DF F ratio p-value
Task Type 2 9.5674 0.0001
Noise 2 0.7837 0.4587
Task Type * Noise 4 1.322 0.2647
RMSSD of the successive R-R intervals showed significance in the model as well,
[F(8,141) = 4.19, p=0.0002]. Thus, the highest RMSSD for a task type was data entry (0.117 ±
0.007) versus the lowest RMSSD coming from anomaly detection (0.0634 ± 0.007). The noise
condition that had the highest RMSSD value on average was no noise (0.094 ± 0.007) and the
lowest RMSSD value was office noise (0.081 ± 0.007). The highest RMSSD from interaction
was data entry with no noise (0.137 ± 0.0137) and the lowest at anomaly detection with office
39
Table 10: ANOVA for root mean squared differences of successive R-R intervals (RMSSD)
Source DF F ratio p-value
Model 8 4.192103 0.0002
Error 141
Total 149
Source DF F ratio p-value
Task Type 2 14.815 0.0001
Noise 2 0.8665 0.4226
Task Type * Noise 4 0.9065 0.462
4.4.2 Eye-tracking Analysis
All tasks and noise levels had pupil diameter measures, or the widening of the pupil in
diameter, that were also taken before the start of the first task for each participant (max.60
seconds). This allowed for the pupil diameter to be normalized by taking the pupil diameter
average for each task and subtracting it by the control average pupil diameter. The greatest mean
difference in pupil diameter average compared to the control comes from the task type data entry
(0.16 ± 0.076) while the lowest was anomaly detection (-0.121 ± 0.075). The noise with the
greatest mean difference in pupil diameter was no noise (0.041 ± 0.076) while the lowest was
seen during the white noise condition (-0.014 ± 0.076). Table 10 shows the ANOVA values for