DECEMBER 2019
THESSALONIKI – GREECE
Implementation of a
web-based platform for Data
Analysis, Visualization and
Machine Learning
Konstantinos Mouratidis
SID: 8180012
Supervisor: Prof. Ioannis Magnisalis
Supervising Committee
Members:
Assoc. Prof. Name Surname Assist. Prof. Name Surname
SCHOOL OF SCIENCE & TECHNOLOGY
Prof. Berberidis Christos Prof. Stavrinides Stavros
A thesis submitted for the degree of
Master of Science (MSc) in Data Science
DECEMBER 2019
THESSALONIKI – GREECE
Abstract
This dissertation attempt to explain the process of building an open-source platform for data science that allows users to easily upload their data or connect to data sources, visualize said data, and create machine learning models to solve common problems in the field. Everything is implemented with a simple-to-use web-based graphical interface, and is designed for usage/deployment in a cloud environment.
This project came about with the help of my supervisor and mentor, Prof. Ioannis Magnisalis, and fellow students – the team that helped in the implementation of the first version - Vaso Tsichli, George Katrilakas, and Chris Timamopoulos. And a shout-out to the thousands of contributors of the open-source tools that this project used, mainly of plotly/dash and the SciPy stack.
Konstantinos Mouratidis December 1st, 2019
Contents
1. Introduction ... 5
1.1 Background ... 5
1.2 This project ... 6
1.3 Licensing & private/public version ... 7
1.4 Structure ... 8
1.5 Absence of definitions and terminology, and final remarks ... 9
2. Literature (i.e. competitors’) Review ... 11
2.1 Overview of papers on various topics relating to implementations ... 11
2.1.1 Data type inference ... 11
2.1.2 Other guiding sources... 12
2.2 Overviews of competitors and other products ... 13
2.2.1 Visualization Software ... 13
2.2.2 Machine Learning / Statistical Modeling Software ... 27
2.2.3 Cloud providers and services ... 34
3. Designing an open-source solution for data visualization and analysis ... 39
3.1 Python libraries ... 40
3.1.1 Tech and computing stack ... 40
3.1.2 Interface / web stack ... 44
3.2 Database technologies ... 48
3.2.1 Redis ... 48
3.2.2 SQLite ... 49
3.3 Other libraries and tools ... 50
4. Implementing the EDA Miner tool ... 52
4.1 Project Structure: Dash & Flask ... 54
4.2 Per-app implementation notes ... 61
4.2.1 Data app ... 61
4.2.2 Visualization app ... 65
4.2.3 Modeling app ... 68
4.3 Database Technologies & Models ... 74
4.4 Directory structure for project & apps, and extensions ... 81
4.4.1 Directory structure: project ... 81
4.4.3 A demonstration: Google Analytics REST API ... 83
5. Conclusions & future work ... 86
Bibliography ... 90
Appendix 1, Gartner reports ... 94
Appendix 2, table comparison of tools ... 98
Appendix 3, sklearn performance ... 99
Appendix 4, Redis benchmarks ... 100
Appendix 5, Flask + hey Benchmarks ... 102
Appendix 6, Contributor guidelines ... 105
Table of contents ... 105
Learning resources ... 105
Style guide recommendations ... 106
General info on project structure ... 106
General info on contributions ... 108
Contributions for code quality ... 108
Contributions for visualization ... 109
Contributions for data ... 109
Contributions for modeling ... 110
Contributions for deployment and scaling ... 111
List of contributors ... 112
1. Introduction
1.1 Background
With the recent hype on Data Science, Machine Learning, and Artificial Intelligence a lot of new tools have been created to aid the practitioners of these three domains with their daily work, and a large array of older tools is still relevant and have resurfaced. The popular debates (e.g. “R vs Python”, “PyTorch vs Tensorflow”, and the list goes on) have become commonplace across social media platforms and due to self-posting on platforms like Medium1 you can find literally thousands of articles on these topics.
Furthermore, each year seems to be having its own “hype word(s)”, usually spanning multiple subdomains of computer science and statistics. Some of them are “Deep Neural Networks” (and their derivatives), “DevOps” and “Micro-Services”, “Big Data”. These guide investments from various funds to startups, as well as hordes of young talent to corporate positions with cool titles. Usually, the hype is an overstatement and when the balloon pops, so do expectations.
Taking a broader perspective, most of what is done today is not much different from what used to be done in earlier “eras”. What has really changed is how almost all of these practices are now freely and openly available to the public, wrapped in nice programmatic interfaces (APIs) that significantly aid the development process. However, even that has its caveats.
Despite our infinite wisdom, we still fall victim to the most recent trend. Big Data however is not a trend, it is simply a niche. This is not to say that big data technologies are useless, just not necessary to a large part of those dealing with data. In fact, as lots of large scale companies have discovered, they need to collect their data, in so-called data lakes and warehouses, and then they find out that they have to mine them for insights,
and their computers are simply not strong enough. They need to resort to other measures, using clusters and distributed computing.
But not every company can support, or even needs, that sort of infrastructure scale. In my experience, so far, most datasets can easily be handled with an average gaming computer: the GPU would have to work for ~1 week to train on OpenPose or similar academic datasets, recommender systems algorithms trained on 80M ratings would fit nicely into a machine with 8 GB (perhaps using out-of-core algorithms) to 32 GB of RAM, and most datasets from companies that I worked with as a freelancer could be very easily handled by a moderately fast quad-core CPU (heck, I could even handle some of it with 2010‟s Intel Core 2 Duo E5500). Of course, even such a computer is not always accessible, and other problems exist too. In fact, data are never enough (Wu, 2019), and good and helpful datasets are always hard to find. Considering thus that there is still a market for small- and medium-sized datasets, it is no wonder that a lot of tools have spawned in order to aid those companies who have data but no analysts.
The employees tasked with the analysis face the same problem new practitioners in the field face: a lifted knowledge bar in the sense that they have to span multiple domains, but the various tools aim at easing the learning curve. However, if you are not experienced with analysis techniques, the tools don‟t really help you. The learning curve is not the only obstacle. But even analysts may lack expertise in specific data domains, and equipment. Even more often, the super-abundance of available tools has a negative effect: when shown a new tool a commonly occurring first though is along the lines of “why do we need another tool?”, or when first starting “what tool should I choose?”.
1.2 This project
This project is indeed yet another tool. Even worse, EDA Miner started as a joke, something evident from the name: after the course on Exploratory Data Analysis (EDA), and the popular tool RapidMiner. A particular pain point that got us into this was the mentality that certain closed-source, expensive, and over-hyped tools “are better”. In this regard, a few stand out in particular; ordered by our increasing annoyance: SPSS, SAS,
Matlab, and finally SAP. RapidMiner‟s core is open-source so it barely didn‟t make the list.
In all arrogance, the design philosophy was “to make a better version of the combined RapidMiner, SAP Hana, Weka, PowerBI, and Orange3” stack. We didn‟t, obviously, and we mention this again in the conclusions.
What EDA Miner aspires to be is a free and open-source tool that can not only handle basic tasks encountered in all of the aforementioned tools but will also learn from its users and actually incorporate machine learning in its design, so as to completely level the learning curve of data science tools. Also, the target audience is not only data experts but also (and mainly) anyone with at least a dataset and a question. In this era of buzzwords, what is probably truly unique is the “Cloud” and its benefits, so EDA Miner is a web-based application for anyone with internet access but without access to a strong enough computer (Park, 2019).
The development of EDA Miner, at start, followed a “monkey see, monkey do” mentality, simply copying functionality from other tools and tasks, and just doing what “felt right”. Midway, it turned into a serious project that is influenced by previous work on “yet another tool”, MIT‟s Data Integration and Visualization Engine (DIVE)2, among others. Proper scheduling of features and a timetable have been introduced. The project adopted a Code of Conduct3, created Contributing guidelines4, and hosts documentation5, everything online.
1.3 Licensing & private/public version
As mentioned previously, EDA Miner is a free and open-source tools, and the code is publicly available on GitHub. As for the license of the project, the initial team decision was to go with GNU General Public License v3.06, mainly for the condition of
2 http://dive.media.mit.edu/ 3
https://github.com/KMouratidis/EDA_miner/blob/master/CODE_OF_CONDUCT.md
4 See appendix 6, or https://github.com/KMouratidis/EDA_miner/blob/master/CONTRIBUTING.md 5 http://edaminer.com/docs
“source disclosure”. This decision is not set in stone and, should the need or demand arise, it might be revised or changed but only in favor of a more permissive license.
The private version was dropped from v0.3 onwards, but why did we need a private version in the first place? The public version was mostly a mirror of the private one, the main differences being a PDF-printing functionality and a login menu. There were various reasons why we decided on this, and (nearly) doubling the commit count (contributions) on our GitHub profiles was definitely not one of them. First, at that point in time, these functionalities were neither well-developed nor well-tested and thus security was a serious consideration. Secondly, some of these, like the login, were originally meant to be used by the university (if and) when it is deployed on its servers, but we decided that other users might like this functionality too. Finally, it served as a great discussion and experimentation ground for the core team to work on still unsupported features, however since I‟m the only contributor now this isn‟t an issue either.
1.4 Structure
This report on the project is divided in five sections. This introductory chapter simply served as a place for me to complain and troll, but also explain some of the motivations behind the whole project.
The second chapter focuses on going over similar tools that are currently in the market and their features. We will review visualization and machine learning tools, both commercial and academic.
The third chapter goes over the tools this project uses. It discusses shortly what each library/framework/tool does, the community behind it, and more.
The fourth chapter is the essence of this report. We will go over all the major design decisions and considerations, how we used each tool, the overall architecture including discussions about its future, the project & directory structure, and more.
The fifth and final chapter contains the closing remarks: missed opportunities, future directions, suggestions for future contributors, and a few final words and comments.
1.5 Absence of definitions and terminology, and final remarks
I expect that people reading this dissertation are at least somewhat familiar with the field, probably due to a degree, online courses, or work experience, and thus I won‟t get into details about those concepts that I consider basic, e.g.: “regression”, “classification”, “visualizations”, “databases”, “object-relational mappers”. It is a common adage that you “google it” when working on/with computers all day, so take responsibility for your knowledge gaps. Furthermore, academics and marketing may actually give a [thought] to distinctions between concepts like “data mining vs statistical/machine learning”, but I will probably be using them interchangeably -often subconsciously- a lot.This essay is not meant as a literary discourse, but rather a report / overview / manual / documentation / whatever. The literature review won‟t be the most comprehensive research (time and money limitations) on the matter, and due to the nature of the task there isn‟t much literature to begin with. A lot of the material referenced will be non-academic (websites, blog posts and articles, dreaded print-screens), and I loathe that just as much as the next person but it can‟t be helped.
As a final reminder, the main deliverable is the software, which I largely developed alone, often using new technologies I had no idea about, creating my own tools for a lot of tasks since available ones didn‟t work (e.g. python doc tools either fail or don‟t work well enough), doing all that within less than 6 months (including the 2 months spent on it before taking it as a dissertation project), and having to handle some important limitations of the framework used. To put things into perspective, this kind of software takes whole teams (of often extremely experienced people, as will become evident later) years to develop. I believe that most, if not all, of the code follows high
coding standards and best practices, and the project as a whole has been structured equally well.
2. Literature (i.e. competitors’) Review
As mentioned in the introduction, this is not the first software of its kind. A lot of others have made similar efforts at assisting the various data workflows, and this is not substantially innovative in terms of provided functionality. What EDA Miner offers is a simple (and yet unpolished) web-based interface for getting your data in, doing the standard visualizations, and offers some machine learning capabilities. One thing that is different, or so we would assume since we cannot possibly have knowledge of closed-source solutions and their code, is that our system is almost entirely able to learn from usage (we discuss this in the final chapter as it is yet unimplemented). Before going into what‟s unique and why, we need to go over existing solutions.
2.1 Overview of papers on various topics relating to
implementations
2.1.1 Data type inference
Before any sort of action on data, any tool that aims at doing any sort of recommendation to the user for visualizations must first be made aware of the data types it has to handle. Different data types mean that different transformations (e.g. standardization for numeric data) and different visualizations (e.g. a pie graph on a float column becomes illegible) can be applied.
The DIVE paper correctly points to this, in the first part of their literature review (Hu, Orghian, & Hidalgo, 2018, p. 2). They mention that popular tools like Power BI and Google Data Studio implement this feature (and so does BigQuery7). An implementation they don‟t mention but we do use as inspiration is the one from Amazon8. In DIVE they define their model as an aggregation of these systems: they take them as features and try to detect both semantic and scale types, as well as relationships. This process is aided by 7 https://cloud.google.com/bigquery/docs/loading-data#loading_json_files 8 https://docs.aws.amazon.com/kinesisanalytics/latest/dev/sch-dis-ref.html, https://docs.aws.amazon.com/kinesisanalytics/latest/dev/sch-dis.html, https://docs.aws.amazon.com/machine-learning/latest/dg/creating-a-data-schema-for-amazon-ml.html
computing statistics. Finally, they mention a few programming libraries they use. One stands out in particular: Messytables, by Open Knowledge Labs9.
Frictionless data, a listed project by Open Knowledge Labs10 provides their own library for data type inference, conveniently named tableschema-py11, which was initially used by us as well. However, this library fails to detect types when they appear in slightly non-ordinary formats, which do however appear in the specification (i.e. “1985-03” is parsed as string instead of yearmonth). This is probably because, just as the other libraries mentioned in DIVE, it uses a heuristic-based approach. We will discuss more on this in the third chapter about design decisions and how we deal with this particular issue, but here we would like to go over the underlying specification on Table Schemas (Walsh & Pollock).
We adopt a lot of the definitions about concepts present in the Table Schema specification, such as those about tabular data, physical and logical representation of data. For brevity, and to avoid confusion, we take data type to mean the logical representation, which we choose to categorize as one of: integer, float (number, in the specification), category, date (covering date, time¸ and datetime), text (string). The descriptor is something you might see us referring to as (data) schema, which we take to contain all the information about data types, sub-types, meta-information – optionally more – as per the specification.
2.1.2 Other guiding sources
Due to working in Python adherence to other, external, specifications may be loosened in favor to adhering to language-specific best practices and norms, such as:
PEP 8 – Style Guide for Python (van Rossum, Warsaw, & Coghlan, 2001)
PEP 20 – The Zen of Python (Peters, 2004)
PEP 257 – Docstring Conventions (Goodger & van Rossum, 2001)
9 https://github.com/okfn/messytables 10 https://okfn.org/projects/
2.2 Overviews of competitors and other products
2.2.1 Visualization Software
There are probably a hundred different platforms and products for data visualization and business intelligence (the buzzword for data analyst of the previous decade) but three stand out in particular. These have been selected based on Gartner‟s continued faith in their companies‟ potential. For the past three years (see the diagrams from (Microsoft, 2017), (Microsoft, 2018), (Qlik, 2019) or the appendices) these are the only companies to have made it consistently in the “Leaders” quadrant, which is defined as a function of “completeness of vision” and “ability to execute”. We will quickly go over them here, and also review visualization capabilities and libraries of the two most dominant programming languages, Python and R. You will also find a more complete comparison of these tools in Appendix 2.
Microsoft’s Power BI12
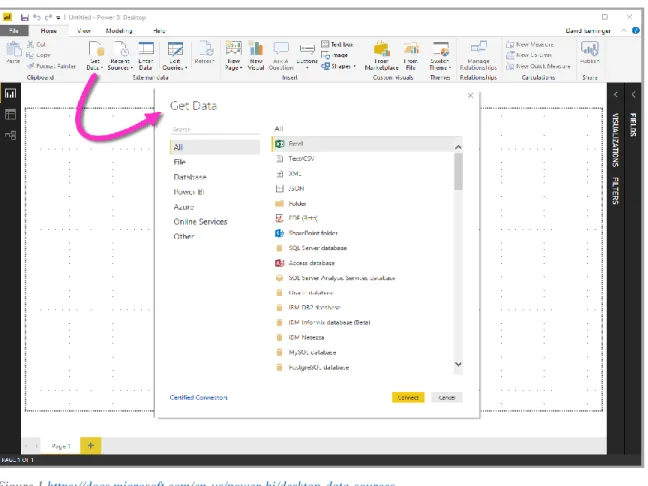
One of the most famous software in the field, with 7.93% according to Datanyze‟s report (Datanyze), and certainly a great solution. It is an application running both locally and on the cloud with a very simple and polished graphical user interface (GUI). Since it is developed by Microsoft it provides seamless integration with their Office stack. Additionally, they allow imports13 from various formats (see Figure 1) including but not limited to files (e.g. CSV, XML, JSON), databases (from various vendors and types, e.g. SQL Server, Oracle, IBM, postgreSQL, SAP HANA, Amazon RedShift, Google BigQuery, MySQL, and of course Azure), and about 40 services (e.g. Facebook, GitHub, MailChimp, Google Analytics, Zendesk). It should be noted that their team has done an excellent job in integrating R and Python as well as big data tools such as Spark and the Hadoop Distributed File System (HDFS), and getting data from a URL. After connecting to a data source (or multiple), optionally transforming and cleaning them, you can create stunning visualizations with minimal efforts, often not more than a couple dozen clicks
12 https://powerbi.microsoft.com/en-us/
(see Figure 2). What makes Power BI differ, from say MS Excel, in terms of visualizations is the ability to create dashboards that you can also publish.
Figure 1 https://docs.microsoft.com/en-us/power-bi/desktop-data-sources
Power BI is also able to detect / infer your table schema (Hu, Orghian, & Hidalgo, 2018, p. 2), and offers a Mixed-Initiative Visualization System which is called Power BI Q&A (see Figure 3).
In all its greatness, it does not offer any Machine Learning, nor is it built for use with other systems such as Linux. This has another serious drawback, that it (seemingly) cannot be integrated with Docker (nish2288, 2018). Furthermore, while the Power BI Desktop version is free, the Power BI Pro ($9.99 per month per user) and Power BI Premium ($4,995 per “dedicated cloud compute and storage resource”) are not14. A comparison between all three does not exist on their website, but some limitations of the free version include: 1) storage limit of 10 GB per user (which is pretty reasonable), 2) no API embedding (e.g. embedding visuals to PowerApps, SharePoint, etc), 3) no
Peer (P2P) sharing. You can however use Python, export reports to PDF, infer data schemata, and save/upload/publish your reports online (xello).
Figure 2 https://docs.microsoft.com/en-us/power-bi/desktop-what-is-desktop
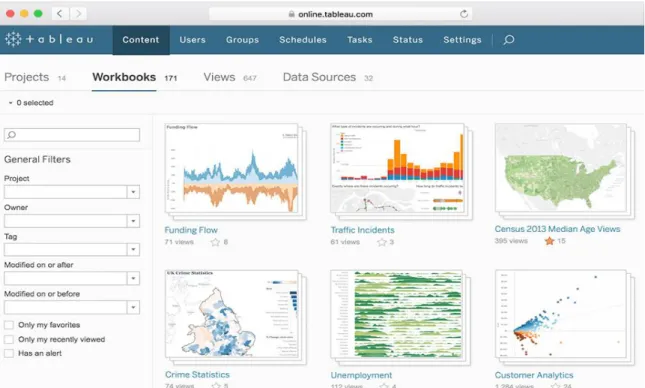
Tableau15
With a market share of 14.51% (Datanyze), the self-proclaimed “analytics platform that disrupted the world of business intelligence”, released in 2003 (Levy, 2013), or about 8 years before Power BI, Tableau is a highly interactive data visualization software.
It features preprocessing functionalities for combining data sources, reshaping, cleaning, and inspecting the data. Similarly to Power BI it can connect to various data sources and providers including Amazon, Azure, IBM, Google, Cloudera, SAP, and various SQL and NoSQL servers16.
Figure 4 Tableau Prep Builder https://www.tableau.com/products/prep
It features a free trial, but after that the price is high with plans starting from $70 per user per month for the Tableau Creator. There are various other offerings as well for teams and organizations or embedded analytics17.
It also offers all the basic visualization types in an easy-to-use menu (see Figure 5), and has Desktop, Online, and Server versions. It is also able to support more complex
15 https://www.tableau.com/
16 https://www.tableau.com/products/prep#data-sources 17 https://www.tableau.com/pricing/
services18.
18 https://www.tableau.com/services
Figure 5 Visualizations https://www.tableau.com/products/what-is-tableau
Finally, Tableau gives developers tools to create their own extensions and make truly interactive dashboards with custom user interfaces. Not only that, but the extensions are pretty flexible allowing for connecting to non-yet-supported data sources, or to even run their own data science models using languages like R, Python, or Matlab. Embedded analytics enable integrations with Salesforce and Microsoft Sharepoint19.
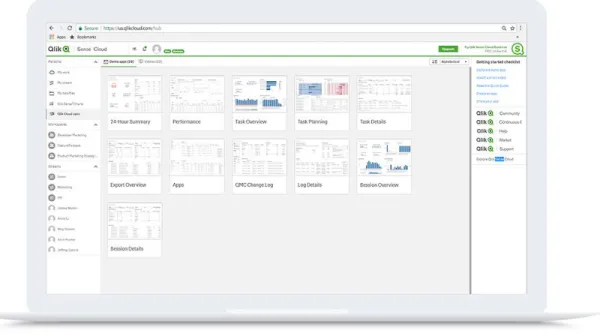
Qlik20
Qlik is, in their words, a “data analytics for modern business intelligence” tool, with a reported market share of 2.22% (Datanyze). QlikTech is probably the older of the bunch having been founded in 1993 with their first product being focused on data analysis (Industrifonden).
Figure 7 Qlik Analytics Platform, https://www.qlik.com/us/products/qlik-sense?ga-link=HP_Mid1_US
They have a free tier, Qlik Sense Cloud Basic, a Business tier for $15 per user per month (including a free trial), and an Enterprise tier with flexible pricing options. They offer similar services to Tableau, like embedded analytics21, with their main product being their analytics platform. Furthermore, they offer other products like data indexing22, reporting23, conversational analytics24, and consulting among others. Using 19 https://www.tableau.com/developer/tools 20 https://www.tableau.com/ 21 https://www.qlik.com/us/bi/embedded-analytics?ga-link=HP_Mid2_US 22 https://www.qlik.com/us/products/associative-big-data-index
Qlik Connectors25, you can integrate your data from various sources such as files,
databases, SAP, salesforce, Azure, Amazon, Google, and more, for a total of over 100 sources.
They provide the basic visualizations26 but you can opt in extra tools such as Qlik GeoAnalytics27 with advanced functionality. In fact, this is a common pattern all around
Qlik (buying “products” with extra functionality).
Open-source programming languages, libraries, and frameworks R project28and Python29
R is primarily a statistical programming language with more than 15,000 currently (R-Project, 2019). Most of these are probably relevant to data analytics tools and trying to map all of them would a nearly impossible feat for a time-limited work such as this one. Python, on the other hand, is more of a general-purpose programming language which has been used in lots of fields and for lots of purposes (scientific computing & data science, web development, game development, gluing other languages). Python boast nearly 190K projects and over 350K users30, being the second most popular (general-purpose) programming language (after JavaScript), second most loved (after Rust), the most wanted (Stack Overflow, 2019, p. Technology), and the one with highest rating change according to TIOBE Index (TIOBE, 2019), with an overall growth shadowing many others (Robinson, 2017).
First on the list is ggplot231, a project with more than 200 contributors on GitHub, nearly 1.5K forks and 4K stars, with a GPL-2.0 open-source license, and is part of the tidyverse collection of packages32. The original publication (book) by Springer (Wickham, 2016) has received 3.6K citations and over 200K downloads. It uses a 23 https://www.qlik.com/us/products/nprinting 24 https://www.qlik.com/us/products/qlik-insight-bot 25 https://www.qlik.com/us/products/qlik-connectors 26 https://help.qlik.com/en-US/sense/February2019/Subsystems/Hub/Content/Sense_Hub/Visualizations/visualizations.htm 27https://www.qlik.com/us/products/qlik-geoanalytics 28 https://www.r-project.org/ 29 https://www.python.org/ 30https://pypi.org/ 31 https://github.com/tidyverse/ggplot2 32 https://www.tidyverse.org/packages/
declarative style of programming, which is often cited as a “mini-language” (Wickham, 2016, p. About). ggplot2 also has a few python clones, the two most popular being ggpy33 (not maintained) and plotnine34 which is the suggested alternative (ChKwK, 2018).
Figure 8 Programming Language Growth,
https://insights.stackoverflow.com/trends?tags=python%2Cjavascript%2Cjava%2Cc%23%2Cphp%2Cc%2B%2B However, the Python equivalent to ggplot is matplotlib35, by John Hunter (Hunter, 2007), with 165 paper citations36. This open-source project uses a Python Software Foundation-based license37, is used by nearly 120K projects, with more than 800 contributors 9.7K stars and 4.3K forks on GitHub. matplotlib supports a wide range of highly customizable visualizations, which aided by an array of third-party libraries (including the ones we mentioned previously38), covers most visualization needs.
33https://github.com/yhat/ggpy 34 https://github.com/has2k1/plotnine 35 https://github.com/matplotlib/matplotlib 36https://ieeexplore.ieee.org/document/4160265 37 https://matplotlib.org/users/license.html 38 https://matplotlib.org/thirdpartypackages/index.html
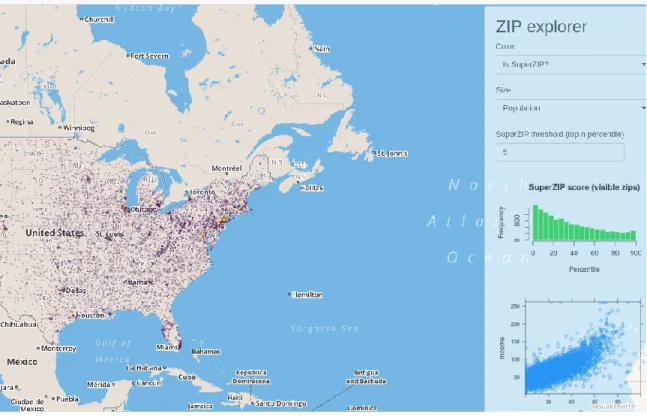
Leaflet39 is a free and open-source JavaScript mapping library that has binding for both R and Python. It has a very short and permissive license40, over 600 contributors, 4K forks, and 25K stars. Furthermore, it is immensely popular and was even used by popular sites such as The New York Times41, GitHub42 and The Washington Post43, among the –at least– 24K other projects.
Figure 9 SuperZip Example - Shiny Gallery, https://shiny.rstudio.com/gallery/superzip-example.html
Finally, two more projects stand out, both focused on creating dashboards: Shiny44 for R, and Bokeh45 for Python. Shiny has 44 contributors, about 3.5K stars and 1.5K forks and a mixed license mainly distributed under GPL-346. Bokeh is more popular, used by 12.8K people, with 11K starts and about 2.8K forks, with 371 contributors and a
39 https://leafletjs.com/, https://github.com/Leaflet/Leaflet 40 https://github.com/Leaflet/Leaflet/blob/master/LICENSE 41http://www.nytimes.com/projects/elections/2013/nyc-primary/mayor/map.html 42 https://github.blog/2013-06-13-there-s-a-map-for-that/ 43 http://www.washingtonpost.com/sf/local/2013/11/09/washington-a-world-apart/ 44https://shiny.rstudio.com/ 45 https://bokeh.pydata.org/en/latest/ 46 https://github.com/rstudio/shiny/blob/master/LICENSE
Clause license47. They both build interactive applications focused on web browser, but Bokeh has one additional merit: it integrates very well with Jupyter Notebooks, one of the most favorite development environments for Python (Stack Overflow, 2019, p. Most Popular Development Environments).
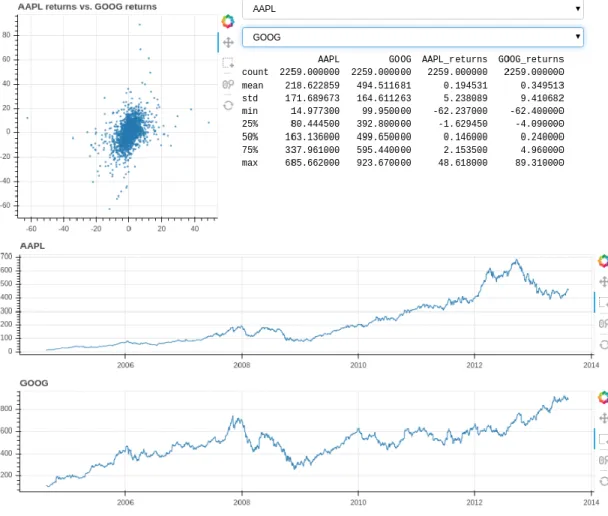
Figure 10: Stocks Example, Bokeh Gallery, https://demo.bokeh.org/stocks
We conveniently left out Plotly and its dashboard tool, Dash, because these are the ones we use for most of our software48. We will go into them in a bit more detail in the next chapters where we will see a high-level overview of the tools used and discuss the design decisions. Before that, let‟s review some similar tools for building Machine Learning models and pipelines.
47
https://github.com/bokeh/bokeh/blob/master/LICENSE.txt
48
Kibana49
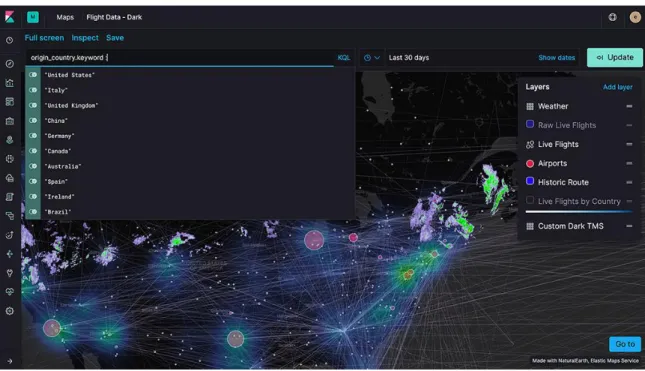
Kibana is part of the Elastic stack50 (with Elasticsearch, Logstash, and now Beats), and it helps you visualize your data. It handles the basics, and provides additional features like time series analysis, machine learning, graphs /networks and maps visualization and analysis, and PDF exports. It also offers integration with Vega for creating custom visualizations51.
Figure 11 Geospatial Analysis, https://www.elastic.co/products/kibana/features
The complete list of features52 (many with their own list of modules) gives much more details, but we will mention a few here. Connections to databases include MySQL, MongoDB, PostgreSQL, Microsoft SQL, connections to external tools include Slack and Jira. Perhaps one of the most interesting is the ability to create dashboards, which is advertised as its main feature, with a nicely polished UI.
49 https://www.elastic.co/products/kibana 50https://www.elastic.co/products/ 51 https://www.elastic.co/products/kibana/features#vega--custom-52 https://www.elastic.co/products/kibana/features
Figure 12 Kibana Dashboard, https://www.elastic.co/guide/en/kibana/current/dashboard.html
Kibana has an open-source version with about 4.9K forks and 12.5K stars, and 400 contributors53. The main license follows Apache License Version 2.054. The open source project has received a lot of traffic (despite the “used by | 5” section, it has about 12.5K closed and 4.6K open issues). It also has a paid (cloud) version starting from $17 per month55. A more detailed comparison, with a huge table of features can be found in Elastic‟s page56, according to which data management, graph exploration and analytics, all of the machine learning features, and the PDF exports are all in the various premium versions. 53 https://github.com/elastic/kibana 54https://github.com/elastic/kibana/blob/master/LICENSE.txt 55 https://www.elastic.co/products/elasticsearch/service/pricing 56 https://www.elastic.co/subscriptions
2.2.2 Machine Learning / Statistical Modeling Software
There are probably as many tools in this category as there are in the previous, and most cloud providers (see Azure, Google, Amazon) also have their own offerings of machine learning and analysis tools. We will only go over three tools here: KNIME, Weka, and RapidMiner. The selection is based on the relevant paper by Al-Khoder and Harmouch (Al-Khoder & Harmouch, 2015), who base their decision on which tools are better fitted to be complete platforms (Al-Khoder & Harmouch, 2015, p. 3). We will add to the list Orange3, because it another completely open-source and popular tool, and Kibana, because even though it is partly open-source (with ML being the non-open-source part), it is already incredibly popular due to being part of the Elastic (“ELK”) stack. Additionally, they are all (completely or mostly) open-source. R is being excluded primarily because the whole language is designed for this specific purpose and going over it is redundant (and we briefly went over it in the previous section). Furthermore, this section will focus mainly on presenting the tools, not on any detailed comparisons; a discussion on this can be found in the literature review later in this chapter.
KNIME57
KNIME is the recommended tool for novices (Al-Khoder & Harmouch, 2015, p. 2), reported as a “data analytics, reporting, and integration platform” under a GPLv358 (Al-Khoder & Harmouch, 2015, pp. 3-4). It has been placed as a “Leader” in Gartner‟s Magic Quadrant for Data Science and Machine Learning Platforms59. The latest publication is from the announcement of version 2 in 2009 (Berthold, et al., 2009).
Just like a lot of the tools already mentioned, it supports integrations with various SQL servers and file formats, with HIVE connectors also available60, as well as connections to APIs61. 57https://www.knime.com/ 58 https://www.knime.com/blog/new-version-210-has-been-released 59
see Appendix 1, illustration 15, also: https://www.knime.com/about/news/knime-recognized-by-gartner-as-a-leader-in-data-science-and-machine-learning-platforms-2019
60
https://www.knime.com/blog/new-version-210-has-been-released
61
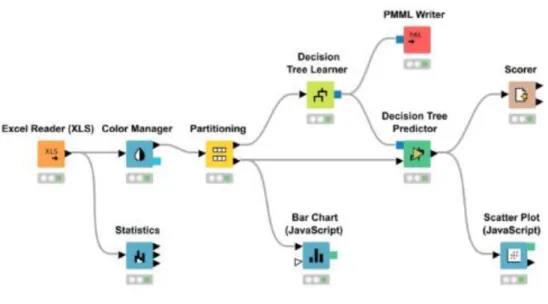
Figure 13 Machine Learning pipelines in KNIME, https://www.knime.com/analytics-expert
One feature that particularly stands out for KNIME is the ability to deploy your models as REST APIs and integrate it easily with R and/or Python, neural networks included62. Apparently KNIME can use Plotly (in essence, via JavaScript or Python63) or RapidMiner64. It also showcases some solutions to common problems like building recommendation systems, inventory optimization, sentiment analysis, churn, and anomaly detection65. While it is a local application it can also deploy interactive browser applications with KNIME WebPortal66 and they also offer a cloud-based version for more than 2 years now67. As per Wikipedia (but couldn‟t find a reference in KNIME‟s website), KNIME works with out-of-core algorithms68.
62 https://www.knime.com/analytics-expert 63 E.g. https://gist.github.com/webbres/3c052788ac55df90ea5b22fe65a68b4e 64 E.g. https://hub.knime.com/aborg/extensions/com.mind_era.knime_rapidminer.knime.feature/latest 65 https://www.knime.com/solutions 66https://www.knime.com/knime-software/knime-webportal 67 https://www.knime.com/knime-software-in-the-cloud-old 68 https://en.wikipedia.org/wiki/KNIME#Internals
WEKA69
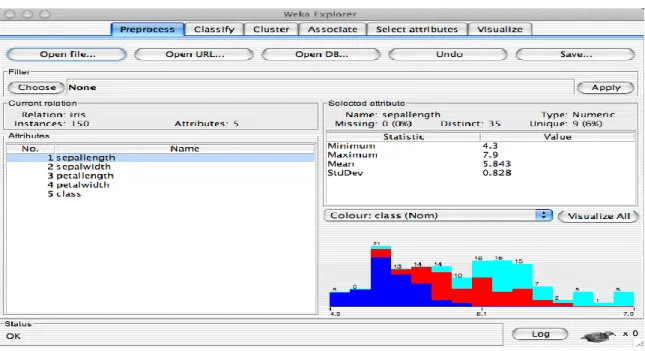
WEKA is definitely one of the most seasoned software in this list, with its first release dating back to 1994 (Holmes, Donkin, & Witten, 1994) by the university of Waikato, New Zealand, with 33 contributors from the university70. It was originally written in C, C++ and LISP (Holmes, Donkin, & Witten, 1994, p. 2) but was later re-written in Java (Witten, et al., 1999, p. 1). WEKA‟s website and source control71 are the least user-friendly of what we viewed here, which mirrors the user interface of the actual application, while also lacking own forums like the other software. Similar comments can be made about their documentation72.
Figure 14 Weka Explorer, https://www.cs.waikato.ac.nz/~ml/weka/gui_explorer.html
That said, WEKA does not lack much with respect to its competitors in terms of available machine learning models. It can easily handle time series, decision trees, rule-based models, neural networks, bagging, boosting, Bayesian, and more (Frank, Hall, & Witten, 2016). It also includes preprocessing utilities (Holmes, Donkin, & Witten, 1994, p. 4). It has the least visualizations of every software examined so far, with only 5 out of 27 listed in (Al-Khoder & Harmouch, 2015, pp. 5-6), as well as data sources support. 69 https://www.cs.waikato.ac.nz/ml/index.html 70https://www.cs.waikato.ac.nz/ml/people.html 71 https://svn.cms.waikato.ac.nz/svn/weka/ 72 http://weka.sourceforge.net/doc.dev/
Even though it lacks more advanced models and does not have equally powerful pipelines (in fact, they probably cannot be called pipelines at all (ben26941, 2017)), it allows integration with languages that data scientists are familiar with (Python73, and R74), and of course Java. Third-party applications have worked to extend WEKA, with some of the first GitHub results being:
autoweka75 (autoML in weka)
wekaDeeplearning4j76
weka python wrapper77
tmweka78 (text mining in weka)
Figure 15 Weka Explorer (2), https://www.cs.waikato.ac.nz/~ml/weka/gui_explorer.html
RapidMiner79
73
E.g. https://pypi.org/project/python-weka-wrapper/, https://www.youtube.com/watch?v=cwbPzumwgNo
74 E.g. https://forums.pentaho.com/threads/154305-Integrating-R-with-Weka/, http://weka.sourceforge.net/packageMetaData/Rplugin/index.html 75 https://github.com/automl/autoweka 76https://github.com/Waikato/wekaDeeplearning4j 77 https://github.com/chrisspen/weka 78 https://github.com/jmgomezh/tmweka
Despite the jokes about RapidMiner in the introduction, it is probably the most complete, easy to use, and intuitive tool in this list. As said previously, the core of RapidMiner Studio80 which provides data visualization and visual creation of pipelines, is free and open-source81, written in Java, and the company‟s business model is based on offering additional services and extensions on top of it. According to their website, more than half a million of users spread across over 30K organizations and 1K universities use their products82.
Figure 16 RapidMiner Pipelines, https://rapidminer.com/products/auto-model/
One such extension, handling data management is Turbo Prep (https://rapidminer.com/products/turbo-prep/) which also allows for exploratory data analysis, data transformations and cleaning, merging datasets. Another one is Auto Model (https://rapidminer.com/products/auto-model/) which handles even more of the modeling process like calculating statistics and judging the quality of datasets, perform automated model selection & tuning as well as automatic feature engineering, and provides dashboards and integrations (e.g. with MS Excel).
79 https://rapidminer.com 80https://rapidminer.com/products/studio/ 81 https://github.com/rapidminer/rapidminer-studio 82 https://rapidminer.com/products/
Furthermore, nearly 4K extensions are available in the RapidMiner Marketplace83. Since RapidMiner allows for Python and R extensions, you can find a lot of those in the Marketplace. The other three extensions are the RapidMiner Server84 which handles deployment of models and collaboration, RapidMiner Real-Time Scoring85 which has also targets deployment but focuses on fast inference times with a REST API wrapper, and RapidMiner Radoop86 which is the RapidMiner Studio big-data version for Hadoop and Spark, providing cluster computing and integration with the Hadoop ecosystem: SparkR, PySpark, Pig, HiveQL, and more.
Figure 17 RapidMiner Auto Model, Simulator, https://rapidminer.com/products/auto-model
Orange387
Orange is an incredibly modular data mining software which steps largely on scikit-learn and the scipy stack88, with matplotlib and Qt handling most of the graphical interface89. It has 1.8K stars, 542 forks, is used by 163 others, and is developed by 71 83 https://marketplace.rapidminer.com/UpdateServer/faces/index.xhtml 84https://rapidminer.com/products/server/ 85 https://rapidminer.com/products/real-time-scoring/ 86 https://rapidminer.com/products/radoop/ 87https://orange.biolab.si/ 88 https://github.com/biolab/orange3/blob/master/requirements-core.txt 89 https://github.com/biolab/orange3/blob/master/requirements-gui.txt
contributors90, with 16 people being mentioned in the original publication (Demsar, et al., 2013) and having contributed the majority of the codebase. The license is based on GPLv3 with the University of Ljubljana being the designated copyright holder91.
A very simple interface with every sub-menu being a popup comprises the whole GUI. It looks a lot like the other tools we discussed so far (see https://orange.biolab.si/screenshots/ for more), and Qt works seamlessly on most operating systems.
Figure 18 Orange3 screenshot, PCA, https://orange.biolab.si/screenshots/
The Workflows tool also allows the user to define complex pipelines including data ingestation, processing, visualization, and machine learning. As Orange uses sklearn behind the scenes for most of its machine learning, everything from there is available, or
90
https://github.com/biolab/orange3/
91
can be ported. It even includes many well-defined tasks such as correspondence analysis, manifold learning, regression. Preprocessing tasks like merging data, finding / removing outliers, imputation, normalization are there too. In terms of visualizations, Orange offers the basics (trees, boxplots, histograms, scatterplots) and a few less commonplace ones (pythagorean tree, radviz). Everything is a widget, and a catalog can be found on their website92. SQL connections are limited to MSSQL and PostegreSQL, but files can be acquired from the web, from the typical formats (Excel, txt, CSV), or from other platforms (e.g. Google Sheets). Some basic data type inference is done, which the user can, of course, modify93.
Although this tool is rather limited when compared to the previous (which is to be expected as this is used mainly as an educational platform), developing new add-ons is easy since Orange is directly written in Python and they provide a reference template94, and thus you can leverage the whole python community and its packages.
2.2.3 Cloud providers and services
In this final part of the competitors‟ review we will quickly go over the cloud offerings of Amazon (AWS), Microsoft (Azure) and Google. There many more, some of which we already visited (e.g. Kibana is mainly a cloud platform, and Tableau Server can also be deployed in cloud providers like AWS) but due to size constraints we cannot go over them here.
Amazon QuickSight and other ML services95
Amazon‟s main offering is an array of specialized services revolving around Infrastructure as a Service, but over the years they have developed tools that can be thought of as Service as a Service, or similar. One such offering is Amazon‟s QuickSight which is a Business Intelligence / Machine Learning service.
92 https://orange.biolab.si/widget-catalog/ 93 https://orange.biolab.si/widget-catalog/data/file/, https://orange-visual-programming.readthedocs.io/loading-your-data/index.html 94 https://github.com/biolab/orange3-example-addon 95 https://aws.amazon.com/quicksight/, https://aws.amazon.com/machine-learning/
Figure 19 Amazon QuickSight workflow, https://aws.amazon.com/blogs/big-data/10-visualizations-to-try-in-amazon-quicksight-with-sample-data/
As one would expect, this works with a usage-based pricing model, as most AWS offerings. When it comes to integrations with data sources, it obviously supports other AWS service like RedShift, S3, Athena, GLUE, and even third-party applications like MySQL, PostgreSQL, Teradata, Salesforce, or common file formats for user uploads96. Is supports dashboard creation and allows for embedding them in your applications. With AutoGraph the system chooses the most appropriate visualization type according to the dataset schema. It supports most of the basic visualization/graph types.
When it comes to ML services, there are perhaps more offerings with Amazon SageMaker, Comprehend, Personalize, Translate, Transcribe, Ground Truth, being a few of them providing solutions to tasks like computer vision, natural language processing, recommendation systems, forecasting, and more. It also supports TensorFlow, PyTorch, Apache MXNet, Gluon, and more out of the box, and often with performance improvements97. Finally, it comes with various helpers for hyperparameter tuning and model selection. 96 https://aws.amazon.com/blogs/big-data/10-visualizations-to-try-in-amazon-quicksight-with-sample-data/ 97 https://aws.amazon.com/sagemaker/
Google Data Studio and ML Engine98
Similarly to Amazon, Google has its own array of offerings. Diving straight into the available connections that Data Studio can handle, it also integrates with other Google services99 (BigQuery, Campain Manager, Google Ads, Google Analytics, Cloud SQL, GoogleCloudStorage, GoogleSheets), popular databases (MySQL, PostegreSQL), and allows file uploads. Through the “partner connectors” you can also integrate with Amazon, Salesforce, Facebook, Instagram, Mailchimp, LinkedIn, Quora, Reddit, Pinterest, Twitter, and over 100 more. It also allows you to create your own dashboards and an extensive gallery100 showcases some amazing works. With the exception of 3D scatterplots (for which I have found no reference), Data Studio provides all of the basic visualizations.
Figure 20 World Cup Finalists,
https://datastudio.google.com/reporting/1Rg5y6r0640X8uo2xo2XY48sG9IyMiYEN/page/wcCU
Again similarly to Amazon, Google provides its own Machine Learning services like the Cloud Machine Learning Engine which also allows for scalable training and comes preconfigured with scikit-learn, XGBoost, Tensorflow and Keras. If you want to add another there is the option of uploading your own Docker containers. It also provides access to CPU, GPU and TPU hardware. Furthermore, using HyperTune can help with 98https://datastudio.google.com/overview, https://cloud.google.com/ml-engine/ 99 https://datastudio.google.com/data 100 https://datastudio.google.com/gallery
hyperparameter tuning. Finally, it too handles common usecases with more specific offerings in computer vision and natural language processing101.
Azure102
The last on the list is Azure, which also provides a dashboard functionality, which is somewhat limited and we won‟t go into detail about that (after all, Microsoft‟s main visualization product is Power BI, and we already covered it).
Figure 21 Azure Machine Learning Service, https://azure.microsoft.com/en-us/services/machine-learning-service/
Azure‟s AI/ML offering comprises of services targeting the same fields as its competitors, with integrations with Databricks, ONNX, PyTorch, Tensorflow, scikit-learn. Azure Machine Learning Service promises to handle all stages from training up to deployment with “automated machine learning capabilities and open-source support”. With Jupyter Notebook integration and the ability to run Python code, it is certainly very extensible and can handle custom data input. Furthermore, it provides both a flowchart for helping you choose a ML model103, and automated ML104.
101 https://cloud.google.com/vision/, https://cloud.google.com/translate/ 102https://azure.microsoft.com/en-us/overview/ai-platform/, https://docs.microsoft.com/en-us/azure/azure-portal/azure-portal-dashboards 103 https://azuremlsimpleds.azurewebsites.net/simpleds/,
Figure 22 Azure Machine Learning Service, https://azure.microsoft.com/en-us/services/machine-learning-service/
104
3. Designing an open-source solution for
data visualization and analysis
This projects stands on the shoulders of (mostly open-source) giants, without the work of whom this endeavor would not have been possible given the time window. These giants roughly sum up to around 40-50 independent projects. Although we will explain the whys and hows for each tool that was used in the next chapter, this small chapter will focus on very briefly introducing them and their capabilities. Seeing that Python was introduced in the previous chapter we will skip over it (same for JavaScript, it being the most popular language).
3.1 Python libraries
3.1.1 Tech and computing stack
scikit-learn105
We mentioned scikit-learn (or sklearn) before multiple times, but briefly. It is a 12-year-old project that started as part of Google Summer of Code project by David Cournapeau106 with the first publication dating back to 2011 (Pedregosa, et al., 2011) which has received a tremendous community following donations from individuals, organizations, universities. The GitHub repository numbers over 17.9K forks, 36K stars and 64K projects in which it is used, with a total of 1380 contributors and a New BSD license107.
In its core, sklearn is a machine learning library with a very concise and well-designed “bare-bones” programmatic API (Pedregosa, et al., 2011, p. 3), that is build using NumPy, SciPy, and matplotlib, and boasts great performance with highly optimized and parallelizable models. Since the underlying libraries use C or C++ code (which is precompiled) they can be made extremely efficient (Pedregosa, et al., 2011, p. 2), and sklearn added to that by adding multi-threading to the mix, a lot of it written in Cython (Pedregosa, et al., 2011, p. 3). It also uses Fortran libraries such as LAPACK (Pedregosa, et al., 2011, p. 3). A comparison with other libraries can be found in Appendix 3, as in their original paper (Pedregosa, et al., 2011, p. 4), which attributes sklearn’s performance improvements to the reduced overhead due to less copying, among others (Pedregosa, et al., 2011, pp. 4-5).
The project provides a lot of documentation, which paired with all previous points makes evident how it came to dominate the ML world in Python. The sklearn docs provide a very detailed User Guide which goes into great depths explaining the models, their theory, and the typical use cases108. The complete user guide at the initial publication was estimated at over 300 pages (Pedregosa, et al., 2011, p. 3), and it probably has grown much more since then. A very popular aid is the Flow Chart which 105 https://scikit-learn.org/stable/index.html 106 https://scikit-learn.org/stable/about.html 107 https://github.com/scikit-learn/scikit-learn 108 https://scikit-learn.org/stable/user_guide.html
really helps beginners select the appropriate models for their tasks quickly. Not only that, but sklearn provides tutorials and examples (along with the hundreds other external sources like YouTube videos, Medium articles, etc).
Figure 24 : SciKit-learn Flow Chart, https://scikit-learn.org/stable/tutorial/machine_learning_map/index.html
Probably the best feature of sklearn is the ability to choose to use the models in standalone mode or stack them in Pipelines109 which are a great way to define more complex models ready for production environments. With simple inheritance from base classes and mix-ins, creating your own estimator and adding it to a pipeline is very easy110: just subclass the base and mix-ins you want, define the appropriate methods (e.g. fit, predict, transform) and you‟re good to go. It is this ease of use and clean API that made us choose it as a base for our project, and the same probably applies to Orange3 and others. SciPy111 109 https://scikit-learn.org/stable/modules/compose.html 110 https://scikit-learn.org/stable/developers/contributing.html#rolling-your-own-estimator 111 https://www.scipy.org/
SciPy, or Scientific Python, is not only a Python library originally published in 2001 (Jones, Oliphant, Peterson, & et al, 2001), but a whole stack of libraries (“ecosystem”) geared towards scientific computing sprung forth later. Both sklearn and the next few packages are also part of this ecosystem. It has its own conferences, a very large community, and a lot of other libraries that greatly enhance Python‟s performance (e.g. Cython, Dask, PyTables). It is a project used by nearly 120K others, with over 6.1K stars, 2.9K forks, and 750 contributors, with a BSD-3-Clause license112. It has lots of applications, from signal processing to image processing, sparse data, Fourier transforms, clustering, and more (e.g. peak finding, convolutions, decompositions, equation optimizers/solvers).
Numpy113
NumPy, or Numerical Python, is primarily used for operations with and on arrays. NumPy allows vectorization of operations, which essentially takes optimized and parallelized code written in C / C++ / Fortran and provides a simple API. The NumPy project is used by nearly 234K others, with 11.4K stars, 3.8K forks and 800 contributors, with the same license as SciPy. Just like SciPy, NumPy is pretty old, with the initial publication dating back to 2006 (Oliphant, 2006).
pandas114
pandas, or Python Data Analysis Library, is the part of the SciPy ecosystem that focuses on data analysis tasks like data cleaning, missing values management, computing statistics, providing functionalities for time series, aggregations, I/O, merging / joining datasets, basic visualization, most of what a Data Analyst / Scientist needs for data handling (McKinney, 2010). It‟s main feature is the DataFrame which should be familiar to R programmers. This project is also immensely popular, being used by over 125.8K others, with over 20.7K stars, 8.2K forks, and 1550 contributors, with the same license as the previous115. 112 https://github.com/scipy/scipy 113 https://www.numpy.org/ 114 https://pandas.pydata.org/ 115 https://github.com/pandas-dev/pandas
SymPy116
SymPy, or Symbolic Python, is the last library of the SciPy stack that we will go over. It is a library for symbolic mathematics but is evolving towards becoming a comprehensive “computer algebra system” (Meurer, et al., 2017). It handles differentiation and integrals, logic, concrete and discrete mathematics, geometry, working with polynomials (e.g. expansion / factoring) and many more (see example below). Perhaps the most interesting feature is the ability to convert symbolic expressions to Python / NumPy functions. The SymPy project is used by more than 11.3K projects, and has about 6.1K stars, 2.7K forks, 770 contributors and, again, a BSD-type license117. >>> from sympy import Symbol, cos
>>> x = Symbol('x') >>> e = 1/cos(x)
>>> print e.series(x, 0, 10)
1 + x**2/2 + 5*x**4/24 + 61*x**6/720 + 277*x**8/8064 + O(x**10)
Other libraries
We cannot introduce every library used (and their dependencies which usually are in the tens) so here is a list of other notable scientific libraries we used in our code:
networkx118 (Hagberg, Schult, & Swart, 2008)
peakutils119 (Hermann Negri & Vestri, 2017)
pygraphviz120 python-Levenshtein121 textblob122 xgboost123 116 https://www.sympy.org/en/index.html 117 https://github.com/sympy/sympy 118 https://github.com/networkx/networkx 119 https://bitbucket.org/lucashnegri/peakutils/src/master/ 120 https://github.com/pygraphviz/pygraphviz 121 https://github.com/ztane/python-Levenshtein 122 https://github.com/sloria/TextBlob 123 https://github.com/dmlc/xgboost
fuzzywuzzy124
3.1.2 Interface / web stack
Dash125
Dash is a Python library, developed by Plotly Technologies Inc. that, behind the scenes, uses Flask as the back-end server and React as the front-end JavaScript framework. It is also a rather popular project, used by over 4K other projects, with about 9.6K stars, 1K forks, and released under an MIT license126. The Dash App Gallery is another great place to take a first look at the project127.
With Dash you can create web applications with HTML and CSS all within Python, and with the use of callback functions (a Python function decorated by dash.Dash.callback) that specify Output (what Dash/HTML element to change, e.g. a graph or a div), Input (what Dash/HTML element triggers -on change- the functions, e.g. “button X was clicked”), and optionally State (something that is read when a function is triggered by the Inputs, e.g. “what is the value of dropdown X when button Y is clicked?”) you can manage the whole interactivity without writing a line of JavaScript. This comes at a small price, and we will discuss that in the next chapter, as well as other limitations and work-arounds.
Dash is extendable by creating your own (or from the community) components in React.js, and using a project boilerplate128 you can easily make them available in Dash. You can also integrate D3.js with Dash129. The documentation is pretty extensive and covers various usage patterns in depth, allowing you to create complex applications, while there is also a repository with examples of advanced functionalities available on GitHub130.
Dash is broken down in several libraries according to their domains. Some were incorporated from community contributions, others were paid by Plotly clients but were
124 https://github.com/seatgeek/fuzzywuzzy 125 https://dash.plot.ly 126 https://github.com/plotly/dash 127 https://dash-gallery.plotly.host/Portal/ 128 https://github.com/plotly/dash-component-boilerplate 129 https://dash.plot.ly/d3-react-components 130 https://github.com/plotly/dash-recipes
open-sourced. Here we will view a few of them, and some that are community-maintained (i.e. outside of Plotly), all of which we used in EDA Miner.
Dash Core Components131 is responsible for high-level components like graphs, dropdowns, sliders, check-boxes, and more.
Dash HTML Components132 contains (almost) every HTML tag like div, button, p, span, h1-h6, and even script.
Dash DAQ133, which was recently open-sourced, contains high-level components that are more geared towards controls like switches, gauges, joysticks, knobs, thermometers, and more.
Dash DataTable134 is a library for creating tables that are highly interactive, and much like spreadsheets you can edit values, add or remove lines or columns, sort, filter, have paging, and more.
Dash Cytoscape135 was also recently released (merely 1.5 months prior to this project‟s start, or 6 month at the time of writing), and is an extension of the popular Cytoscape.js library for network / graph visualizations.
Dash Bootstrap Components136 is an independent community project that ports the Bootstrap project into Dash, giving access to components like modals, navbars, tabs, jumbotrons, cards, and more.
Dash Core Components for Visualization137 is another external project that provides a few extra components: a component to run JavaScript, a network component, and a data-table.
Flask138
Flask is a Python web micro-framework, which means it doesn‟t make too many assumptions for you, nor does it wrap everything around a rigid and opinionated API139. 131 https://dash.plot.ly/dash-core-components 132 https://dash.plot.ly/dash-html-components 133 https://dash.plot.ly/dash-daq 134 https://dash.plot.ly/datatable 135 https://dash.plot.ly/cytoscape 136 https://dash-bootstrap-components.opensource.faculty.ai/ 137 https://github.com/jimmybow/visdcc 138 https://flask.palletsprojects.com/en/1.1.x/ 139 https://flask.palletsprojects.com/en/1.1.x/foreword/
That said, due to their design decisions their API is very simple and polished140, and the scaling of Flask applications is not an issue141. It works by using Werkzeug and Jinja as the underlying mechanisms for a web server gateway interface (WSGI) and template engine respectively. Since sub-classing the Flask object is supported, a lot of applications are based off that, and most notably, the one we used: Dash (to access the Flask server object from the Dash object you call Dash.server).
Flask is, of course, open source as well. The GitHub page shows that is is an immensely popular project with more than 45.8K stars, 12.8K forks, and 550 contributors with a BSD-3-Clause license. It is used by more than 303.7K projects142, with large companies like Pinterest (Steven Cohen cites that it handles “over 12 billion requests” daily (Cohen, 2015)) and LinkedIn (0:45 – 1:15 LinkedIn talk (Sanders, 2014)) being some of them.
As we said, Flask can be sub-classed to create wrappers, but the primary focus of the development community is designing extensions (Sanders, 2014) and we will see a few of them here:
Flask-Login143 is an extension that helps with user authentication, session management, “remember me”, and anonymous users, among others. What is lacks is handling of permissions (an interesting Flask extension is Flask-Security), registration, and account recovery. As a GitHub project, it has nearly 2.2K stars and 500 forks, with 78 contributors and an MIT license144.
Flask-WTF145 is an extension that helps with Forms, the validation of input, CSRF protection, reCAPTCHA and more. The GitHub project uses a BSD License, is used by about 45.3K other projects with nearly 1K stars and 240 forks, with 69 contributors146. 140 https://flask.palletsprojects.com/en/1.1.x/design/ 141 https://flask.palletsprojects.com/en/1.1.x/becomingbig/ 142 https://github.com/pallets/flask 143 https://flask-login.readthedocs.io/en/latest/ 144 https://github.com/maxcountryman/flask-login 145 https://flask-wtf.readthedocs.io/en/stable/ 146 https://github.com/lepture/flask-wtf
Flask-Mail147 is an extension for that provides a simple API to handle mails via SMTP, using a simple dictionary for passing configurations. It is also popular, with 22 contributors, more than 100 forks, 400 stars, and 12.8K projects using it, with a BSD license148.
Flask-SQLAlchemy149 is the Flask extension developed by the core Flask team that supports the Python library SQLAlchemy. It is, essentially, an Object-Relational Mapping (ORM). Used by more than 79.6K projects, with about 2.7K stars, 700 forks, and 82 contributors, it is also shared on GitHub under a BSD-3-Clause license150.
Flask-Caching151 is the last Flask extension on our list, which provides caching support using any of Werkzeug‟s caching back-ends (we use it with the preconfigured Redis) plus custom ones via sub-classing. The GitHub projects sits on the less used side, with about 2.2K projects using it, 400 stars, 70 forks, 60 contributors, and a mixed BSD license152.
Others
We used other frameworks and libraries too, but the limited usage (and the limited space here) won‟t allow us to go into too much detail, especially since the Dash code-base is bigger by far. We will only focus on JavaScript (JS) which, in itself, needs no introduction. We used a bit of “vanilla” JavaScript but the two frameworks we mostly used were React and jQuery:
React153 is an open-source library / framework for creating component-based interactive elements. Writing JSX (essentially JS with a few extras) to extend the React base Component class, compiling with Babel, and optionally using any library (e.g. installed via the Node Package Manager), you can easily create complex components and single-page apps. React is developed by Facebook, 147 https://pythonhosted.org/Flask-Mail/ 148 https://github.com/mattupstate/flask-mail 149 https://flask-sqlalchemy.palletsprojects.com/en/2.x/ 150 https://github.com/pallets/flask-sqlalchemy 151 https://flask-caching.readthedocs.io/en/latest/ 152 https://github.com/sh4nks/flask-caching 153 https://reactjs.org/