O’Reilly Media, Inc.
Big Data Now
2015 Edition
978-1-491-95057-9 [LSI]
Big Data Now: 2015 Edition
by O’Reilly Media, Inc.
Copyright © 2016 O’Reilly Media, Inc. All rights reserved. Printed in the United States of America.
Published by O’Reilly Media, Inc., 1005 Gravenstein Highway North, Sebastopol, CA 95472.
O’Reilly books may be purchased for educational, business, or sales promotional use. Online editions are also available for most titles (http://safaribooksonline.com). For more information, contact our corporate/institutional sales department: 800-998-9938 or [email protected].
Editor: Nicole Tache
Production Editor: Leia Poritz
Copyeditor: Jasmine Kwityn
Proofreader: Kim Cofer
Interior Designer: David Futato
Cover Designer: Karen Montgomery
Illustrator: Rebecca Demarest
January 2016: First Edition
Revision History for the First Edition
2016-01-12: First Release
The O’Reilly logo is a registered trademark of O’Reilly Media, Inc. Big Data Now: 2015 Edition, the cover image, and related trade dress are trademarks of O’Reilly Media, Inc.
While the publisher and the authors have used good faith efforts to ensure that the information and instructions contained in this work are accurate, the publisher and the authors disclaim all responsibility for errors or omissions, including without limitation responsibility for damages resulting from the use of or reliance on this work. Use of the information and instructions contained in this work is at your own risk. If any code samples or other technology this work contains or describes is sub‐ ject to open source licenses or the intellectual property rights of others, it is your responsibility to ensure that your use thereof complies with such licenses and/or rights.
Table of Contents
Introduction. . . v
1. Data-Driven Cultures. . . 1
How an Enterprise Begins Its Data Journey 1
Improving Corporate Planning Through Insight Generation 5
On Leadership 7
Embracing Failure and Learning from the Impostor Syndrome 10
The Key to Agile Data Science: Experimentation 12
2. Data Science. . . 19
What It Means to “Go Pro” in Data Science 20
Graphs in the World: Modeling Systems as Networks 28
Let’s Build Open Source Tensor Libraries for Data Science 37
3. Data Pipelines. . . 43
Building and Deploying Large-Scale Machine Learning Pipelines 43
Three Best Practices for Building Successful Data Pipelines 48
The Log: The Lifeblood of Your Data Pipeline 55
Validating Data Models with Kafka-Based Pipelines 61
4. Big Data Architecture and Infrastructure. . . 65
Lessons from Next-Generation Data-Wrangling Tools 66
Why the Data Center Needs an Operating System 68
A Tale of Two Clusters: Mesos and YARN 74
Accelerating Big Data Analytics Workloads with Tachyon 87
5. The Internet of Things and Real Time. . . 95
A Real-Time Processing Revival 96
Improving on the Lambda Architecture for Streaming Analysis 98
How Intelligent Data Platforms Are Powering Smart Cities 105
The Internet of Things Has Four Big Data Problems 107
6. Applications of Big Data. . . 111
How Trains Are Becoming Data Driven 112
Multimodel Database Case Study: Aircraft Fleet Maintenance 115
Big Data Is Changing the Face of Fashion 127
The Original Big Data Industry 128
7. Security, Ethics, and Governance. . . 131
The Security Infusion 132
We Need Open and Vendor-Neutral Metadata Services 136
What the IoT Can Learn from the Healthcare Industry 138
There Is Room for Global Thinking in IoT Data Privacy Matters 141
Introduction
Data-driven tools are all around us—they filter our email, they rec‐ ommend professional connections, they track our music preferen‐ ces, and they advise us when to tote umbrellas. The more ubiquitous these tools become, the more data we as a culture produce, and the more data there is to parse, store, and analyze for insight. During a keynote talk at Strata + Hadoop World 2015 in New York, Dr. Timothy Howes, chief technology officer at ClearStory Data, said that we can expect to see a 4,300% increase in annual data generated by 2020. But this striking observation isn’t necessarily new.
What is new are the enhancements to data-processing frameworks and tools—enhancements to increase speed, efficiency, and intelli‐ gence (in the case of machine learning) to pace the growing volume and variety of data that is generated. And companies are increas‐ ingly eager to highlight data preparation and business insight capa‐ bilities in their products and services.
What is also new is the rapidly growing user base for big data. According to Forbes, 2014 saw a 123.60% increase in demand for information technology project managers with big data expertise, and an 89.8% increase for computer systems analysts. In addition, we anticipate we’ll see more data analysis tools that non-programmers can use. And businesses will maintain their sharp focus on using data to generate insights, inform decisions, and kick‐ start innovation. Big data analytics is not the domain of a handful of trailblazing companies; it’s a common business practice. Organiza‐ tions of all sizes, in all corners of the world, are asking the same fun‐ damental questions: How can we collect and use data successfully?
Who can help us establish an effective working relationship with data?
Big Data Now recaps the trends, tools, and applications we’ve been talking about over the past year. This collection of O’Reilly blog posts, authored by leading thinkers and professionals in the field, has been grouped according to unique themes that garnered signifi‐ cant attention in 2015:
• Data-driven cultures (Chapter 1) • Data science (Chapter 2)
• Data pipelines (Chapter 3)
• Big data architecture and infrastructure (Chapter 4) • The Internet of Things and real time (Chapter 5) • Applications of big data (Chapter 6)
CHAPTER 1
Data-Driven Cultures
What does it mean to be a truly data-driven culture? What tools and skills are needed to adopt such a mindset? DJ Patil and Hilary Mason cover this topic in O’Reilly’s report “Data Driven,” and the collection of posts in this chapter address the benefits and chal‐ lenges that data-driven cultures experience—from generating invaluable insights to grappling with overloaded enterprise data warehouses.
First, Rachel Wolfson offers a solution to address the challenges of data overload, rising costs, and the skills gap. Evangelos Simoudis then discusses how data storage and management providers are becoming key contributors for insight as a service. Q Ethan McCal‐ lum traces the trajectory of his career from software developer to team leader, and shares the knowledge he gained along the way. Alice Zheng explores the impostor syndrome, and the byproducts of frequent self-doubt and a perfectionist mentality. Finally, Jerry Overton examines the importance of agility in data science and pro‐ vides a real-world example of how a short delivery cycle fosters cre‐ ativity.
How an Enterprise Begins Its Data Journey
by Rachel WolfsonYou can read this post on oreilly.com here.
As the amount of data continues to double in size every two years, organizations are struggling more than ever before to manage,
ingest, store, process, transform, and analyze massive data sets. It has become clear that getting started on the road to using data suc‐ cessfully can be a difficult task, especially with a growing number of new data sources, demands for fresher data, and the need for increased processing capacity. In order to advance operational effi‐ ciencies and drive business growth, however, organizations must address and overcome these challenges.
In recent years, many organizations have heavily invested in the development of enterprise data warehouses (EDW) to serve as the central data system for reporting, extract/transform/load (ETL) pro‐ cesses, and ways to take in data (data ingestion) from diverse data‐ bases and other sources both inside and outside the enterprise. Yet, as the volume, velocity, and variety of data continues to increase, already expensive and cumbersome EDWs are becoming overloaded with data. Furthermore, traditional ETL tools are unable to handle all the data being generated, creating bottlenecks in the EDW that result in major processing burdens.
As a result of this overload, organizations are now turning to open source tools like Hadoop as cost-effective solutions to offloading data warehouse processing functions from the EDW. While Hadoop can help organizations lower costs and increase efficiency by being used as a complement to data warehouse activities, most businesses still lack the skill sets required to deploy Hadoop.
Where to Begin?
Organizations challenged with overburdened EDWs need solutions that can offload the heavy lifting of ETL processing from the data warehouse to an alternative environment that is capable of manag‐ ing today’s data sets. The first question is always How can this be done in a simple, cost-effective manner that doesn’t require specialized skill sets?
Let’s start with Hadoop. As previously mentioned, many organiza‐ tions deploy Hadoop to offload their data warehouse processing functions. After all, Hadoop is a cost-effective, highly scalable plat‐ form that can store volumes of structured, semi-structured, and unstructured data sets. Hadoop can also help accelerate the ETL process, while significantly reducing costs in comparison to running ETL jobs in a traditional data warehouse. However, while the bene‐ fits of Hadoop are appealing, the complexity of this platform contin‐
ues to hinder adoption at many organizations. It has been our goal to find a better solution.
Using Tools to Offload ETL Workloads
One option to solve this problem comes from a combined effort between Dell, Intel, Cloudera, and Syncsort. Together they have developed a preconfigured offloading solution that enables busi‐ nesses to capitalize on the technical and cost-effective features offered by Hadoop. It is an ETL offload solution that delivers a use case–driven Hadoop Reference Architecture that can augment the traditional EDW, ultimately enabling customers to offload ETL workloads to Hadoop, increasing performance, and optimizing EDW utilization by freeing up cycles for analysis in the EDW. The new solution combines the Hadoop distribution from Cloudera with a framework and tool set for ETL offload from Syncsort. These technologies are powered by Dell networking components and Dell PowerEdge R series servers with Intel Xeon processors.
The technology behind the ETL offload solution simplifies data pro‐ cessing by providing an architecture to help users optimize an exist‐ ing data warehouse. So, how does the technology behind all of this actually work?
The ETL offload solution provides the Hadoop environment through Cloudera Enterprise software. The Cloudera Distribution of Hadoop (CDH) delivers the core elements of Hadoop, such as scalable storage and distributed computing, and together with the software from Syncsort, allows users to reduce Hadoop deployment to weeks, develop Hadoop ETL jobs in a matter of hours, and become fully productive in days. Additionally, CDH ensures secu‐ rity, high availability, and integration with the large set of ecosystem tools.
Syncsort DMX-h software is a key component in this reference architecture solution. Designed from the ground up to run effi‐ ciently in Hadoop, Syncsort DMX-h removes barriers for main‐ stream Hadoop adoption by delivering an end-to-end approach for shifting heavy ETL workloads into Hadoop, and provides the con‐ nectivity required to build an enterprise data hub. For even tighter integration and accessibility, DMX-h has monitoring capabilities integrated directly into Cloudera Manager.
With Syncsort DMX-h, organizations no longer have to be equipped with MapReduce skills and write mountains of code to take advan‐ tage of Hadoop. This is made possible through intelligent execution that allows users to graphically design data transformations and focus on business rules rather than underlying platforms or execu‐ tion frameworks. Furthermore, users no longer have to make appli‐ cation changes to deploy the same data flows on or off of Hadoop, on premise, or in the cloud. This future-proofing concept provides a consistent user experience during the process of collecting, blend‐ ing, transforming, and distributing data.
Additionally, Syncsort has developed SILQ, a tool that facilitates understanding, documenting, and converting massive amounts of SQL code to Hadoop. SILQ takes an SQL script as an input and pro‐ vides a detailed flow chart of the entire data stream, mitigating the need for specialized skills and greatly accelerating the process, thereby removing another roadblock to offloading the data ware‐ house into Hadoop.
Dell PowerEdge R730 servers are then used for infrastructure nodes, and Dell PowerEdge R730xd servers are used for data nodes.
The Path Forward
Offloading massive data sets from an EDW can seem like a major barrier to organizations looking for more effective ways to manage their ever-increasing data sets. Fortunately, businesses can now capi‐ talize on ETL offload opportunities with the correct software and hardware required to shift expensive workloads and associated data from overloaded enterprise data warehouses to Hadoop.
By selecting the right tools, organizations can make better use of existing EDW investments by reducing the costs and resource requirements for ETL.
This post is part of a collaboration between O’Reilly, Dell, and Intel. See our statement of editorial independence.
Improving Corporate Planning Through
Insight Generation
by Evangelos Simoudis
You can read this post on oreilly.com here.
Contrary to what many believe, insights are difficult to identify and effectively apply. As the difficulty of insight generation becomes apparent, we are starting to see companies that offer insight genera‐ tion as a service.
Data storage, management, and analytics are maturing into commo‐ ditized services, and the companies that provide these services are well positioned to provide insight on the basis not just of data, but data access and other metadata patterns.
Companies like DataHero and Host Analytics are paving the way in the insight-as-a-service (IaaS) space.1 Host Analytics’ initial product
offering was a cloud-based Enterprise Performance Management (EPM) suite, but far more important is what it is now enabling for the enterprise: It has moved from being an EPM company to being an insight generation company. This post reviews a few of the trends that have enabled IaaS and discusses the general case of using a software-as-a-service (SaaS) EPM solution to corral data and deliver IaaS as the next level of product.
Insight generation is the identification of novel, interesting, plausi‐ ble, and understandable relations among elements of a data set that (a) lead to the formation of an action plan, and (b) result in an improvement as measured by a set of key performance indicators (KPIs). The evaluation of the set of identified relations to establish an insight, and the creation of an action plan associated with a par‐ ticular insight or insights, needs to be done within a particular con‐ text and necessitates the use of domain knowledge.
IaaS refers to action-oriented, analytics-driven, cloud-based solu‐ tions that generate insights and associated action plans. IaaS is a dis‐ tinct layer of the cloud stack (I’ve previously discussed IaaS in “Defining Insight” and “Insight Generation”). In the case of Host Analytics, its EPM solution integrates a customer’s financial plan‐
ning data with actuals from its Enterprise Resource Planning (ERP) applications (e.g., SAP or NetSuite, and relevant syndicated and open source data), creating an IaaS offering that complements their existing solution. EPM, in other words, is not just a matter of streamlining data provisions within the enterprise; it’s an opportu‐ nity to provide a true insight-generation solution.
EPM has evolved as a category much like the rest of the data indus‐ try: from in-house solutions for enterprises to off-the-shelf but hard-to-maintain software to SaaS and cloud-based storage and access. Throughout this evolution, improving the financial plan‐ ning, forecasting, closing, and reporting processes continues to be a priority for corporations. EPM started, as many applications do, in Excel but gave way to automated solutions starting about 20 years ago with the rise of vendors like Hyperion Solutions. Hyperion’s Ess‐ base was the first to use OLAP technology to perform both tradi‐ tional financial analysis as well as line-of-business analysis. Like many other strategic enterprise applications, EPM started moving to the cloud a few years ago. As such, a corporation’s financial data is now available to easily combine with other data sources, open source and proprietary, and deliver insight-generating solutions. The rise of big data—and the access and management of such data by SaaS applications, in particular—is enabling the business user to access internal and external data, including public data. As a result, it has become possible to access the data that companies really care about, everything from the internal financial numbers and sales pipelines to external benchmarking data as well as data about best practices. Analyzing this data to derive insights is critical for corpo‐ rations for two reasons. First, great companies require agility, and want to use all the data that’s available to them. Second, company leadership and corporate boards are now requiring more detailed analysis.
Legacy EPM applications historically have been centralized in the finance department. This led to several different operational “data hubs” existing within each corporation. Because such EPM solutions didn’t effectively reach all departments, critical corporate informa‐ tion was “siloed,” with critical information like CRM data housed separately from the corporate financial plan. This has left the departments to analyze, report, and deliver their data to corporate using manually integrated Excel spreadsheets that are incredibly inefficient to manage and usually require significant time to under‐
stand the data’s source and how they were calculated rather than what to do to drive better performance.
In most corporations, this data remains disconnected. Understand‐ ing the ramifications of this barrier to achieving true enterprise per‐ formance management, IaaS applications are now stretching EPM to incorporate operational functions like marketing, sales, and services into the planning process. IaaS applications are beginning to inte‐ grate data sets from those departments to produce a more compre‐ hensive corporate financial plan, improving the planning process and helping companies better realize the benefits of IaaS. In this way, the CFO, VP of sales, CMO, and VP of services can clearly see the actions that will improve performance in their departments, and by extension, elevate the performance of the entire corporation.
On Leadership
by Q Ethan McCallum
You can read this post on oreilly.com here.
Over a recent dinner with Toss Bhudvanbhen, our conversation meandered into discussion of how much our jobs had changed since we entered the workforce. We started during the dot-com era. Tech‐ nology was a relatively young field then (frankly, it still is), so there wasn’t a well-trodden career path. We just went with the flow. Over time, our titles changed from “software developer,” to “senior developer,” to “application architect,” and so on, until one day we realized that we were writing less code but sending more emails; attending fewer code reviews but more meetings; and were less worried about how to implement a solution, but more con‐ cerned with defining the problem and why it needed to be solved. We had somehow taken on leadership roles.
We’ve stuck with it. Toss now works as a principal consultant at Par‐ iveda Solutions and my consulting work focuses on strategic matters around data and technology.
The thing is, we were never formally trained as management. We just learned along the way. What helped was that we’d worked with some amazing leaders, people who set great examples for us and rec‐ ognized our ability to understand the bigger picture.
Perhaps you’re in a similar position: Yesterday you were called “senior developer” or “data scientist” and now you’ve assumed a technical leadership role. You’re still sussing out what this battlefield promotion really means—or, at least, you would do that if you had the time. We hope the high points of our conversation will help you on your way.
Bridging Two Worlds
You likely gravitated to a leadership role because you can live in two worlds: You have the technical skills to write working code and the domain knowledge to understand how the technology fits the big picture. Your job now involves keeping a foot in each camp so you can translate the needs of the business to your technical team, and vice versa. Your value-add is knowing when a given technology sol‐ ution will really solve a business problem, so you can accelerate decisions and smooth the relationship between the business and technical teams.
Someone Else Will Handle the Details
You’re spending more time in meetings and defining strategy, so you’ll have to delegate technical work to your team. Delegation is not about giving orders; it’s about clearly communicating your goals so that someone else can do the work when you’re not around. Which is great, because you won’t often be around. (If you read between the lines here, delegation is also about you caring more about the high-level result than minutiae of implementation details.) How you communicate your goals depends on the experience of the person in question: You can offer high-level guidance to senior team members, but you’ll likely provide more guidance to the junior staff.
Here to Serve
If your team is busy running analyses or writing code, what fills your day? Your job is to do whatever it takes to make your team suc‐ cessful. That division of labor means you’re responsible for the pieces that your direct reports can’t or don’t want to do, or perhaps don’t even know about: sales calls, meetings with clients, defining scope with the product team, and so on. In a larger company, that may also mean leveraging your internal network or using your
seniority to overcome or circumvent roadblocks. Your team reports to you, but you work for them.
Thinking on Your Feet
Most of your job will involve making decisions: what to do, whether to do it, when to do it. You will often have to make those decisions based on imperfect information. As an added treat, you’ll have to decide in a timely fashion: People can’t move until you’ve figured out where to go. While you should definitely seek input from your team—they’re doing the hands-on work, so they are closer to the action than you are—the ultimate decision is yours. As is the responsibility for a mistake. Don’t let that scare you, though. Bad decisions are learning experiences. A bad decision beats indecision any day of the week.
Showing the Way
The best part of leading a team is helping people understand and meet their career goals. You can see when someone is hungry for something new and provide them opportunities to learn and grow. On a technical team, that may mean giving people greater exposure to the business side of the house. Ask them to join you in meetings with other company leaders, or take them on sales calls. When your team succeeds, make sure that you credit them—by name!—so that others may recognize their contribution. You can then start to dele‐ gate more of your work to team members who are hungry for more responsibility.
The bonus? This helps you to develop your succession plan. You see, leadership is also temporary. Sooner or later, you’ll have to move on, and you will serve your team and your employer well by planning for your exit early on.
Be the Leader You Would Follow
We’ll close this out with the most important lesson of all: Leadership isn’t a title that you’re given, but a role that you assume and that oth‐ ers recognize. You have to earn your team’s respect by making your best possible decisions and taking responsibility when things go awry. Don’t worry about being lost in the chaos of this new role. Look to great leaders with whom you’ve worked in the past, and their lessons will guide you.
Embracing Failure and Learning from the
Impostor Syndrome
by Alice Zheng
You can read this post on oreilly.com here.
Lately, there has been a slew of media coverage about the impostor syndrome. Many columnists, bloggers, and public speakers have spo‐ ken or written about their own struggles with the impostor syn‐ drome. And original psychological research on the impostor syn‐ drome has found that out of every five successful people, two con‐ sider themselves a fraud.
I’m certainly no stranger to the sinking feeling of being out of place. During college and graduate school, it often seemed like everyone else around me was sailing through to the finish line, while I alone lumbered with the weight of programming projects and mathemati‐ cal proofs. This led to an ongoing self-debate about my choice of a major and profession. One day, I noticed myself reading the same sentence over and over again in a textbook; my eyes were looking at the text, but my mind was saying Why aren’t you getting this yet? It’s so simple. Everybody else gets it. What’s wrong with you?
When I look back on those years, I have two thoughts: first, That was hard, and second, What a waste of perfectly good brain cells! I could have done so many cool things if I had not spent all that time doubting myself.
But one can’t simply snap out of the impostor syndrome. It has a variety of causes, and it’s sticky. I was brought up with the idea of holding myself to a high standard, to measure my own progress against others’ achievements. Falling short of expectations is sup‐ posed to be a great motivator for action…or is it?
In practice, measuring one’s own worth against someone else’s ach‐ ievements can hinder progress more than it helps. It is a flawed method. I have a mathematical analogy for this: When we compare our position against others, we are comparing the static value of functions. But what determines the global optimum of a function are its derivatives. The first derivative measures the speed of change, the second derivative measures how much the speed picks up over time, and so on. How much we can achieve tomorrow is not just determined by where we are today, but how fast we are learning,
changing, and adapting. The rate of change is much more important than a static snapshot of the current position. And yet, we fall into the trap of letting the static snapshots define us.
Computer science is a discipline where the rate of change is particu‐ larly important. For one thing, it’s a fast-moving and relatively young field. New things are always being invented. Everyone in the field is continually learning new skills in order to keep up. What’s important today may become obsolete tomorrow. Those who stop learning, stop being relevant.
Even more fundamentally, software programming is about tinker‐ ing, and tinkering involves failures. This is why the hacker mentality is so prevalent. We learn by doing, and failing, and re-doing. We learn about good designs by iterating over initial bad designs. We work on pet projects where we have no idea what we are doing, but that teach us new skills. Eventually, we take on bigger, real projects. Perhaps this is the crux of my position: I’ve noticed a cautiousness and an aversion to failure in myself and many others. I find myself wanting to wrap my mind around a project and perfectly under‐ stand its ins and outs before I feel comfortable diving in. I want to get it right the first time. Few things make me feel more powerless and incompetent than a screen full of cryptic build errors and stack traces, and part of me wants to avoid it as much as I can.
The thing is, everything about computers is imperfect, from soft‐ ware to hardware, from design to implementation. Everything up and down the stack breaks. The ecosystem is complicated. Compo‐ nents interact with each other in weird ways. When something breaks, fixing it sometimes requires knowing how different compo‐ nents interact with each other; other times it requires superior Goo‐ gling skills. The only way to learn the system is to break it and fix it. It is impossible to wrap your mind around the stack in one day: application, compiler, network, operating system, client, server, hardware, and so on. And one certainly can’t grok it by standing on the outside as an observer.
Further, many computer science programs try to teach their stu‐ dents computing concepts on the first go: recursion, references, data structures, semaphores, locks, and so on. These are beautiful, impor‐ tant concepts. But they are also very abstract and inaccessible by themselves. They also don’t instruct students on how to succeed in real software engineering projects. In the courses I took, program‐
ming projects constituted a large part, but they were included as a way of illustrating abstract concepts. You still needed to parse through the concepts to pass the course. In my view, the ordering should be reversed, especially for beginners. Hands-on practice with programming projects should be the primary mode of teach‐ ing; concepts and theory should play a secondary, supporting role. It should be made clear to students that mastering all the concepts is not a prerequisite for writing a kick-ass program.
In some ways, all of us in this field are impostors. No one knows everything. The only way to progress is to dive in and start doing. Let us not measure ourselves against others, or focus on how much we don’t yet know. Let us measure ourselves by how much we’ve learned since last week, and how far we’ve come. Let us learn through playing and failing. The impostor syndrome can be a great teacher. It teaches us to love our failures and keep going.
O’Reilly’s 2015 Edition of Women in Data reveals inspiring success sto‐ ries from four women working in data across the European Union, and features interviews with 19 women who are central to data businesses.
The Key to Agile Data Science:
Experimentation
by Jerry OvertonYou can read this post on oreilly.com here.
I lead a research team of data scientists responsible for discovering insights that generate market and competitive intelligence for our company, Computer Sciences Corporation (CSC). We are a busy group. We get questions from all different areas of the company and it’s important to be agile.
The nature of data science is experimental. You don’t know the answer to the question asked of you—or even if an answer exists. You don’t know how long it will take to produce a result or how much data you need. The easiest approach is to just come up with an idea and work on it until you have something. But for those of us with deadlines and expectations, that approach doesn’t fly. Compa‐ nies that issue you regular paychecks usually want insight into your progress.
This is where being agile matters. An agile data scientist works in small iterations, pivots based on results, and learns along the way. Being agile doesn’t guarantee that an idea will succeed, but it does decrease the amount of time it takes to spot a dead end. Agile data science lets you deliver results on a regular basis and it keeps stake‐ holders engaged.
The key to agile data science is delivering data products in defined time boxes—say, two- to three-week sprints. Short delivery cycles force us to be creative and break our research into small chunks that can be tested using minimum viable experiments. We deliver some‐ thing tangible after almost every sprint for our stakeholders to review and give us feedback. Our stakeholders get better visibility into our work, and we learn early on if we are on track.
This approach might sound obvious, but it isn’t always natural for the team. We have to get used to working on just enough to meet stakeholders’ needs and resist the urge to make solutions perfect before moving on. After we make something work in one sprint, we make it better in the next only if we can find a really good reason to do so.
An Example Using the Stack Overflow Data Explorer
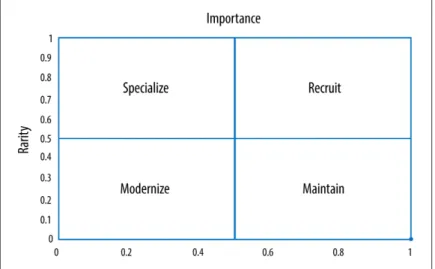
Being an agile data scientist sounds good, but it’s not always obvious how to put the theory into everyday practice. In business, we are used to thinking about things in terms of tasks, but the agile data scientist has to be able to convert a task-oriented approach into an experiment-oriented approach. Here’s a recent example from my personal experience.Our CTO is responsible for making sure the company has the next-generation skills we need to stay competitive—that takes data. We have to know what skills are hot and how difficult they are to attract and retain. Our team was given the task of categorizing key skills by how important they are, and by how rare they are (see Figure 1-1).
Figure 1-1. Skill categorization (image courtesy of Jerry Overton) We already developed the ability to categorize key skills as important or not. By mining years of CIO survey results, social media sites, job boards, and internal HR records, we could produce a list of the skills most needed to support any of CSC’s IT priorities. For example, the following is a list of programming language skills with the highest utility across all areas of the company:
Programming language Importance (0–1 scale)
Java 1 SQL 0.4 Python 0.3 C# 0.2 C++ 0.1 Perl 0.1
Note that this is a composite score for all the different technology domains we considered. The importance of Python, for exam‐ ple, varies a lot depending on whether or not you are hiring for a data scientist or a mainframe specialist.
For our top skills, we had the “importance” dimension, but we still needed the “abundance” dimension. We considered purchasing IT survey data that could tell us how many IT professionals had a
particular skill, but we couldn’t find a source with enough breadth and detail. We considered conducting a survey of our own, but that would be expensive and time consuming. Instead, we decided to take a step back and perform an agile experiment.
Our goal was to find the relative number of technical professionals with a certain skill. Perhaps we could estimate that number based on activity within a technical community. It seemed reasonable to assume that the more people who have a skill, the more you will see helpful posts in communities like Stack Overflow. For example, if there are twice as many Java programmers as Python programmers, you should see about twice as many helpful Java programmer posts as Python programmer posts. Which led us to a hypothesis:
You can predict the relative number of technical professionals with a certain IT skill based on the relative number of helpful contributors in a technical community.
We looked for the fastest, cheapest way to test the hypothesis. We took a handful of important programming skills and counted the number of unique contributors with posts rated above a certain threshold. We ran this query in the Stack Overflow Data Explorer:
1 SELECT
2 Count(DISTINCT Users.Id), 3 Tags.TagName as Tag_Name 4 FROM
5 Users, Posts, PostTags, Tags 6 WHERE
7 Posts.OwnerUserId = Users.Id AND 8 PostTags.PostId = Posts.Id AND 9 Tags.Id = PostTags.TagId AND 10 Posts.Score > 15 AND
11 Posts.CreationDate BETWEEN '1/1/2012' AND '1/1/2015' AND 12 Tags.TagName IN ('python', 'r', 'java', 'perl', 'sql', 'c#', 'c++')
13 GROUP BY 14 Tags.TagName
Which gave us these results:
Programming language Unique contributors Scaled value (0–1)
Java 2,276 1.00 C# 1,868 0.82 C++ 1,529 0.67 Python 1,380 0.61 SQL 314 0.14 Perl 70 0.03
We converted the scores according to a linear scale with the top score mapped to 1 and the lowest score being 0. Considering a skill to be “plentiful” is a relative thing. We decided to use the skill with the highest population score as the standard. At first glance, these results seemed to match our intuition, but we needed a simple, objective way of cross-validating the results. We considered looking for a targeted IT professional survey, but decided to perform a sim‐ ple LinkedIn people search instead. We went into LinkedIn, typed a programming language into the search box, and recorded the num‐ ber of people with that skill:
Programming language LinkedIn population (M) Scaled value (0–1)
Java 5.2 1.00 C# 4.6 0.88 C++ 3 0.58 Python 1.7 0.33 SQL 1 0.19 Perl 0.5 0.10
Some of the experiment’s results matched the cross-validation, but some were way off. The Java and C++ population scores predicted by the experiment matched pretty closely with the validation. But the experiment predicted that SQL would be one of the rarest skills, while the LinkedIn search told us that it is the most plentiful. This discrepancy makes sense. Foundational skills, such as SQL, that have been around a while will have a lot of practitioners, but are unlikely to be a hot topic of discussion. By the way, adjusting the allowable post creation dates made little difference to the relative outcome.
We couldn’t confirm the hypothesis, but we learned something val‐ uable. Why not just use the number of people that show up in the LinkedIn search as the measure of our population with the particu‐ lar skill? We have to build the population list by hand, but that kind of grunt work is the cost of doing business in data science. Combin‐ ing the results of LinkedIn searches with our previous analysis of skills importance, we can categorize programming language skills for the company, as shown in Figure 1-2.
Figure 1-2. Programming language skill categorization (image courtesy of Jerry Overton)
Lessons Learned from a Minimum Viable Experiment
The entire experiment, from hypothesis to conclusion, took just three hours to complete. Along the way, there were concerns about which Stack Overflow contributors to include, how to define a help‐ ful post, and the allowable sizes of technical communities—the list of possible pitfalls went on and on. But we were able to slice through the noise and stay focused on what mattered by sticking to a basic hypothesis and a minimum viable experiment.Using simple tests and minimum viable experiments, we learned enough to deliver real value to our stakeholders in a very short amount of time. No one is getting hired or fired based on these results, but we can now recommend to our stakeholders strategies for getting the most out of our skills. We can recommend targets for recruiting and strategies for prioritizing talent development efforts.
Best of all, I think, we can tell our stakeholders how these priorities should change depending on the technology domain.
CHAPTER 2
Data Science
The term “data science” connotes opportunity and excitement. Organizations across the globe are rushing to build data science teams. The 2015 version of the Data Science Salary Survey reveals that usage of Spark and Scala has skyrocketed since 2014, and their users tend to earn more. Similarly, organizations are investing heav‐ ily in a variety of tools for their data science toolkit, including Hadoop, Spark, Kafka, Cassandra, D3, and Tableau—and the list keeps growing. Machine learning is also an area of tremendous innovation in data science—see Alice Zheng’s report “Evaluating Machine Learning Models,” which outlines the basics of model eval‐ uation, and also dives into evaluation metrics and A/B testing. So, where are we going? In a keynote talk at Strata + Hadoop World San Jose, US Chief Data Scientist DJ Patil provides a unique perspec‐ tive of the future of data science in terms of the federal government’s three areas of immediate focus: using medical and genomic data to accelerate discovery and improve treatments, building “game chang‐ ing” data products on top of thousands of open data sets, and work‐ ing in an ethical manner to ensure data science protects privacy. This chapter’s collection of blog posts reflects some hot topics related to the present and the future of data science. First, Jerry Overton takes a look at what it means to be a professional data sci‐ ence programmer, and explores best practices and commonly used tools. Russell Jurney then surveys a series of networks, including LinkedIn InMaps, and discusses what can be inferred when visualiz‐ ing data in networks. Finally, Ben Lorica observes the reasons why
tensors are generating interest—speed, accuracy, scalability—and details recent improvements in parallel and distributed computing systems.
What It Means to “Go Pro” in Data Science
by Jerry OvertonYou can read this post on oreilly.com here.
My experience of being a data scientist is not at all like what I’ve read in books and blogs. I’ve read about data scientists working for digital superstar companies. They sound like heroes writing auto‐ mated (near sentient) algorithms constantly churning out insights. I’ve read about MacGyver-like data scientist hackers who save the day by cobbling together data products from whatever raw material they have around.
The data products my team creates are not important enough to jus‐ tify huge enterprise-wide infrastructures. It’s just not worth it to invest in hyper-efficient automation and production control. On the other hand, our data products influence important decisions in the enterprise, and it’s important that our efforts scale. We can’t afford to do things manually all the time, and we need efficient ways of shar‐ ing results with tens of thousands of people.
There are a lot of us out there—the “regular” data scientists; we’re more organized than hackers but with no need for a superhero-style data science lair. A group of us met and held a speed ideation event, where we brainstormed on the best practices we need to write solid code. This article is a summary of the conversation and an attempt to collect our knowledge, distill it, and present it in one place.
Going Pro
Data scientists need software engineering skills—just not all the skills a professional software engineer needs. I call data scientists with essential data product engineering skills “professional” data sci‐ ence programmers. Professionalism isn’t a possession like a certifi‐ cation or hours of experience; I’m talking about professionalism as an approach. Professional data science programmers are self-correcting in their creation of data products. They have general strategies for recognizing where their work sucks and correcting the problem.
The professional data science programmer has to turn a hypothesis into software capable of testing that hypothesis. Data science pro‐ gramming is unique in software engineering because of the types of problems data scientists tackle. The big challenge is that the nature of data science is experimental. The challenges are often difficult, and the data is messy. For many of these problems, there is no known solution strategy, the path toward a solution is not known ahead of time, and possible solutions are best explored in small steps. In what follows, I describe general strategies for a disciplined, productive trial and error: breaking problems into small steps, try‐ ing solutions, and making corrections along the way.
Think Like a Pro
To be a professional data science programmer, you have to know more than how the systems are structured. You have to know how to design a solution, you have to be able to recognize when you have a solution, and you have to be able to recognize when you don’t fully understand your solution. That last point is essential to being self-correcting. When you recognize the conceptual gaps in your approach, you can fill them in yourself. To design a data science sol‐ ution in a way that you can be self-correcting, I’ve found it useful to follow the basic process of look, see, imagine, and show:
Step 1: Look
Start by scanning the environment. Do background research and become aware of all the pieces that might be related to the problem you are trying to solve. Look at your problem in as much breadth as you can. Get visibility to as much of your sit‐ uation as you can and collect disparate pieces of information. Step 2: See
Take the disparate pieces you discovered and chunk them into abstractions that correspond to elements of the blackboard pat‐ tern. At this stage, you are casting elements of the problem into meaningful, technical concepts. Seeing the problem is a critical step for laying the groundwork for creating a viable design. Step 3: Imagine
Given the technical concepts you see, imagine some implemen‐ tation that moves you from the present to your target state. If you can’t imagine an implementation, then you probably missed something when you looked at the problem.
Step 4: Show
Explain your solution first to yourself, then to a peer, then to your boss, and finally to a target user. Each of these explanations need only be just formal enough to get your point across: a water-cooler conversation, an email, a 15-minute walk-through. This is the most important regular practice in becoming a self-correcting professional data science programmer. If there are any holes in your approach, they’ll most likely come to light when you try to explain it. Take the time to fill in the gaps and make sure you can properly explain the problem and its solu‐ tion.
Design Like a Pro
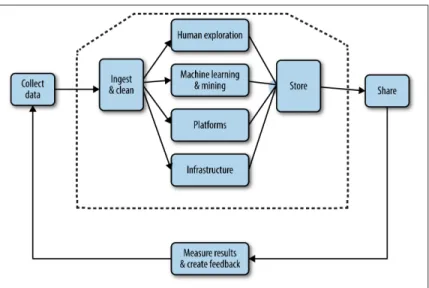
The activities of creating and releasing a data product are varied and complex, but, typically, what you do will fall somewhere in what Alistair Croll describes as the big data supply chain(see Figure 2-1).
Figure 2-1. The big data supply chain (image courtesy of Jerry Over‐ ton)
Because data products execute according to a paradigm (real time, batch mode, or some hybrid of the two), you will likely find yourself participating in a combination of data supply chain activity and a data-product paradigm: ingesting and cleaning batch-updated data, building an algorithm to analyze real-time data, sharing the results
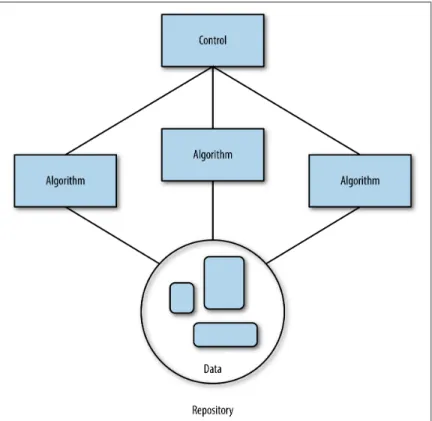
of a batch process, and so on. Fortunately, the blackboard architec‐ tural pattern gives us a basic blueprint for good software engineer‐ ing in any of these scenarios (see Figure 2-2).
Figure 2-2. The blackboard architectural pattern (image courtesy of Jerry Overton)
The blackboard pattern tells us to solve problems by dividing the overall task of finding a solution into a set of smaller, self-contained subtasks. Each subtask transforms your hypothesis into one that’s easier to solve or a hypothesis whose solution is already known. Each task gradually improves the solution and leads, hopefully, to a viable resolution.
Data science is awash in tools, each with its own unique virtues. Productivity is a big deal, and I like letting my team choose whatever tools they are most familiar with. Using the blackboard pattern makes it OK to build data products from a collection of different technologies. Cooperation between algorithms happens through a shared repository. Each algorithm can access data, process it as
input, and deliver the results back to the repository for some other algorithm to use as input.
Last, the algorithms are all coordinated using a single control com‐ ponent that represents the heuristic used to solve the problem. The control is the implementation of the strategy you’ve chosen to solve the problem. This is the highest level of abstraction and understand‐ ing of the problem, and it’s implemented by a technology that can interface with and determine the order of all the other algorithms. The control can be something automated (e.g., a cron job, script), or it can be manual (e.g., a person that executes the different steps in the proper order). But overall, it’s the total strategy for solving the problem. It’s the one place you can go to see the solution to the problem from start to finish.
This basic approach has proven useful in constructing software sys‐ tems that have to solve uncertain, hypothetical problems using incomplete data. The best part is that it lets us make progress to an uncertain problem using certain, deterministic pieces. Unfortu‐ nately, there is no guarantee that your efforts will actually solve the problem. It’s better to know sooner rather than later if you are going down a path that won’t work. You do this using the order in which you implement the system.
Build Like a Pro
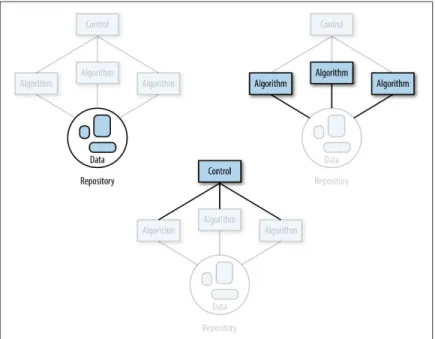
You don’t have to build the elements of a data product in a set order (i.e., build the repository first, then the algorithms, then the control‐ ler; see Figure 2-3). The professional approach is to build in the order of highest technical risk. Start with the riskiest element first, and go from there. An element can be technically risky for a lot of reasons. The riskiest part may be the one that has the highest work‐ load or the part you understand the least.
You can build out components in any order by focusing on a single element and stubbing out the rest (see Figure 2-4). If you decide, for example, to start by building an algorithm, dummy up the input data and define a temporary spot to write the algorithm’s output.
Figure 2-3. Sample 1 approach to building a data product (image cour‐ tesy of Jerry Overton)
Figure 2-4. Sample 2 approach to building a data product (image cour‐ tesy of Jerry Overton)
Then, implement a data product in the order of technical risk, putting the riskiest elements first. Focus on a particular element, stub out the rest, replace the stubs later.
The key is to build and run in small pieces: write algorithms in small steps that you understand, build the repository one data source at a time, and build your control one algorithm execution step at a time. The goal is to have a working data product at all times—it just won’t be fully functioning until the end.
Tools of the Pro
Every pro needs quality tools. There are a lot of choices available. These are some of the most commonly used tools, organized by topic:
Visualization
D3.js
D3.js (or just D3, for data-driven documents) is a JavaScript library for producing dynamic, interactive data visualiza‐ tions in web browsers. It makes use of the widely imple‐ mented SVG, HTML5, and CSS standards.
Version control
GitHub
GitHub is a web-based Git repository hosting service that offers all of the distributed revision control and source code management (SCM) functionality of Git as well as adding its own features. GitHub provides a web-based graphical interface and desktop as well as mobile integration.
Programming languages
R
R is a programming language and software environment for statistical computing and graphics. The R language is widely used among statisticians and data miners for devel‐ oping statistical software and data analysis.
Python
Python is a widely used general-purpose, high-level pro‐ gramming language. Its design philosophy emphasizes code readability, and its syntax allows programmers to express
concepts in fewer lines of code than would be possible in languages such as C++ or Java.
Scala
Scala is an object-functional programming language for general software applications. Scala has full support for functional programming and a very strong static type sys‐ tem. This allows programs written in Scala to be very con‐ cise and thus smaller in size than other general-purpose programming languages.
Java
Java is a general-purpose computer programming language that is concurrent, class-based, object-oriented, and specifi‐ cally designed to have as few implementation dependencies as possible. It is intended to let application developers “write once, run anywhere” (WORA).
The Hadoop ecosystem
Hadoop
Hadoop is an open source software framework written in Java for distributed storage and distributed processing of very large data sets on computer clusters built from com‐ modity hardware.
Pig
Pig is a high-level platform for creating MapReduce pro‐ grams used with Hadoop.
Hive
Hive is a data warehouse infrastructure built on top of Hadoop for providing data summarization, query, and anal‐ ysis.
Spark
Spark’s in-memory primitives provide performance up to 100 times faster for certain applications.
Epilogue: How This Article Came About
This article started out as a discussion of occasional productivity problems we were having on my team. We eventually traced the issues back to the technical platform and our software engineering knowledge. We needed to plug holes in our software engineering
practices, but every available course was either too abstract or too detailed (meant for professional software developers). I’m a big fan of the outside-in approach to data science and decided to hold an open CrowdChat discussion on the matter.
We got great participation: 179 posts in 30 minutes; 600 views, and 28K+ reached. I took the discussion and summarized the findings based on the most influential answers, then I took the summary and used it as the basis for this article. I want to thank all those who par‐ ticipated in the process and take the time to acknowledge their con‐ tributions.
The O’Reilly Data Show Podcast
Topic Models: Past, Present, and Future
An interview with David Blei
“My understanding when I speak to people at different startup companies and other more established companies is that a lot of technology companies are using topic modeling to generate this representation of documents in terms of the discovered topics, and then using that representation in other algorithms for things like classification or other things.”
—David Blei, Columbia Uni‐ versity
Listen to the full interview with David Blei here.
Graphs in the World: Modeling Systems as
Networks
by Russell Jurney
You can read this post on oreilly.com here.
Networks of all kinds drive the modern world. You can build a net‐ work from nearly any kind of data set, which is probably why net‐ work structures characterize some aspects of most phenomena. And yet, many people can’t see the networks underlying different sys‐ tems. In this post, we’re going to survey a series of networks that model different systems in order to understand various ways net‐ works help us understand the world around us.
We’ll explore how to see, extract, and create value with networks. We’ll look at four examples where I used networks to model differ‐ ent phenomena, starting with startup ecosystems and ending in network-driven marketing.
Networks and Markets
Commerce is one person or company selling to another, which is inherently a network phenomenon. Analyzing networks in markets can help us understand how market economies operate.
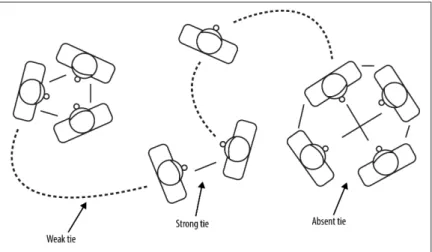
Strength of weak ties
Mark Granovetter famously researched job hunting and discovered the strength of weak ties, illustrated in Figure 2-5.
Figure 2-5. The strength of weak ties (image via Wikimedia Com‐ mons)
Granovetter’s paper is one of the most influential in social network analysis, and it says something counterintuitive: Loosely connected professionals (weak ties) tend to be the best sources of job tips because they have access to more novel and different information than closer connections (strong ties). The weak tie hypothesis has been applied to understanding numerous areas.
In Granovetter’s day, social network analysis was limited in that data collection usually involved a clipboard and good walking shoes. The modern Web contains numerous social networking websites and apps, and the Web itself can be understood as a large graph of web
pages with links between them. In light of this, a backlog of techni‐ ques from social network analysis are available to us to understand networks that we collect and analyze with software, rather than pen and paper. Social network analysis is driving innovation on the social web.
Networks of success
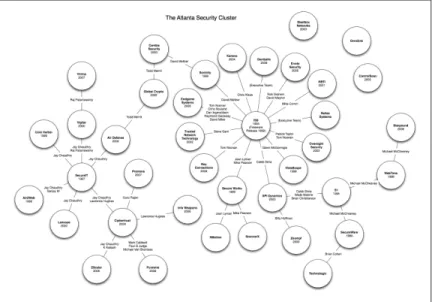
There are other ways to use networks to understand markets. Figure 2-6 shows a map of the security sector of the startup ecosystem in Atlanta as of 2010.
Figure 2-6. The Atlanta security startup map (image courtesy of Rus‐ sell Jurney, used with permission); click here for larger version
I created this map with the help of the startup community in Atlanta, and LinkedIn and Google. Each node (circle) is a company. Each link between nodes represents a founder who worked at the originating company and went on to found the destination com‐ pany. Look carefully and you will see that Internet Security Systems (ISS) and SecureIT (which sold the Internet Scanner by ISS) spawned most of the other companies in the cluster.
This simple chart illustrates the network-centric process underlying the emergence of startup ecosystems. Groups of companies emerge together via “networks of success”—groups of individuals who work together and develop an abundance of skills, social capital, and cash.
This network is similar to others that are better known, like the Pay‐ Pal Mafia or the Fairchildren.
This was my first venture into social network research—a domain typically limited to social scientists and Ph.D. candidates. And when I say social network, I don’t mean Facebook; I mean social network as in social network analysis.
The Atlanta security startup map shows the importance of appren‐ ticeship in building startups and ecosystems. Participating in a solid IPO is equivalent to seed funding for every early employee. This is what is missing from startup ecosystems in provincial places: Col‐ lectively, there isn’t enough success and capital for the employees of successful companies to have enough skills and capital to start their own ventures.
Once that tipping point occurs, though, where startups beget start‐ ups, startup ecosystems self-sustain—they grow on their own. Older generations of entrepreneurs invest in and mentor younger entre‐ preneurs, with each cohort becoming increasingly wealthy and well connected. Atlanta has a cycle of wealth occurring in the security sector, making it a great place to start a security company.
My hope with this map was to affect policy—to encourage the state of Georgia to redirect stimulus money toward economic clusters that work as this one does. The return on this investment would dwarf others the state makes because the market wants Atlanta to be a security startup mecca. This remains a hope.
In any case, that’s a lot to learn from a simple map, but that’s the kind of insight you can obtain from collecting and analyzing social networks.
LinkedIn InMaps
Ali Imam invented LinkedIn’s InMaps as a side project. InMaps were a hit: People went crazy for them. Ali was backlogged using a step-by-step, manual process to create the maps. I was called in to turn the one-off process into a product. The product was cool, but more than that, we wanted to prove that anyone at LinkedIn could come up with a good idea and we could take it from an idea to a produc‐ tion application (which we did).
Snowball sampling and 1.5-hop networks
InMaps was a great example of the utility of snowball samples and 1.5-hop networks. A snowball sample is a sample that starts with one or more persons, and grows like a snowball as we recruit their friends, and then their friend’s friends, until we get a large enough sample to make inferences. 1.5-hop networks are local neighbor‐ hoods centered on one entity or ego. They let us look at a limited section of larger graphs, making even massive graphs browsable. With InMaps, we started with one person, and then added their connections, and finally added the connections between them. This is a “1.5-hop network.” If we only looked at a person and their friends, we would have a “1-hop network.” If we included the per‐ son, their friends, as well as all connections of the friends, as opposed to just connections between friends, we would have a “2-hop network.”
Viral visualization
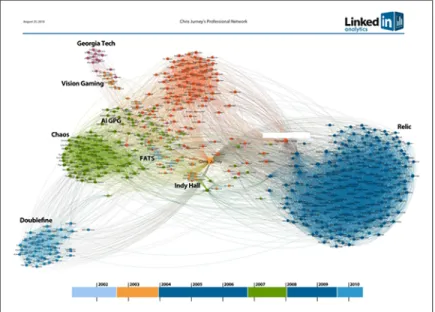
My favorite thing about InMaps is a bug that became a feature. We hadn’t completed the part of the project where we would determine the name of each cluster of LinkedIn users. At the same time, we weren’t able to get placement for the application on the site. So how would users learn about InMaps?
We had several large-scale printers, so I printed my brother’s InMap as a test case. We met so I could give him his map, and we ended up labeling the clusters by hand right there in the coffee shop. He was excited by his map, but once he labeled it, he was ecstatic. It was “his” art, and it represented his entire career. He had to have it. Ali created my brother’s InMap, shown in Figure 2-7, and I hand labeled it in Photoshop.
So, we’d found our distribution: virality. Users would create their own InMaps, label the clusters, and then share their personalized InMap via social media. Others would see the InMap, and want one of their own—creating a viral loop that would get the app in front of users.
Figure 2-7. Chris Jurney’s InMap (photo courtesy of Ali Imam and Russell Jurney, used with permission)
Inbox Networks
After I left LinkedIn, I missed its data. I needed a new data set to play with, and Chris Diehl told me about his work on the Enron data set.
About half a gigabyte of emails that surfaced during the investiga‐ tion into the collapse of Enron have become a standard data set against which researchers discover and develop a variety of statisti‐ cal software and systems.
After playing with the Enron data set, I wanted something more personal. I wrote a script that downloads your Gmail inbox into Avro format. After all, if it’s your data, then you can really gauge insight.
Taking a cue from InMaps, I rendered maps of my inbox and labeled the clusters (see Figure 2-8).
Figure 2-8. Map of Russell Jurney’s Gmail inbox showing labeled clus‐ ters (image courtesy of Russell Jurney, used with permission)
Inbox ego networks
These maps showed the different groups I belonged to, mailing lists, etc. From there, it was possible to create an ego network of senders of emails, and to map users to groups and organizations. Inbox ego networks are a big deal: This is the technology behind RelateIQ, which was acquired in 2014 for $392 million. RelateIQ’s killer fea‐ ture is that it reduces the amount of data entry required, as it auto‐ matically identifies companies you’re emailing by their domain and creates customer relationship management (CRM) entries for each email you send or receive.
Agile data science
I founded Kontexa to create a collaborative, semantic inbox. I used graph visualization to inspect the results of my data processing and created my own simple graph database on top of Voldemort to allow the combination of different inboxes at a semantic level. Figure 2-9
Figure 2-9. Graphical representation of inbox combining Russell Jurney and Chris Jurney’s data (image courtesy of Russell Jurney, used with permission)
This work became the foundation for my first book, Agile Data Sci‐ ence. In the book, users download their own inboxes and then we analyze these Avro records in Apache Pig and Python.
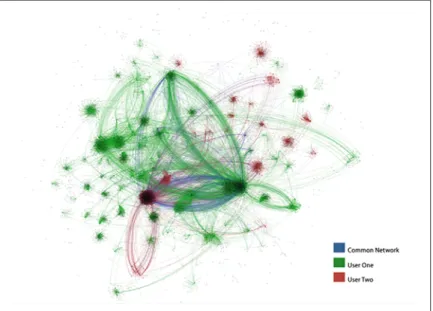
Customer Relationship Management Analytics
During a nine-month stint as data scientist in residence at The Hive, I helped launch the startup E8 Security, acting as the first engineer on the team (E8 went on to raise a $10 million series A). As my time at E8 came to a close, I once again found myself needing a new data set to analyze.
Former Hiver Karl Rumelhart introduced me to CRM data. CRM databases can be worth many millions of dollars, so it’s a great type of data to work with. Karl posed a challenge: Could I cluster CRM databases into groups that we could then use to target different sec‐ tors in marketing automation?
We wanted to know if segmenting markets was possible before we asked any prospective customers for their CRM databases. So, as a test case, we decided to look at the big data market. Specifically, we
focused on the four major Hadoop vendors: Cloudera, Horton‐ works, MapR, and Pivotal.
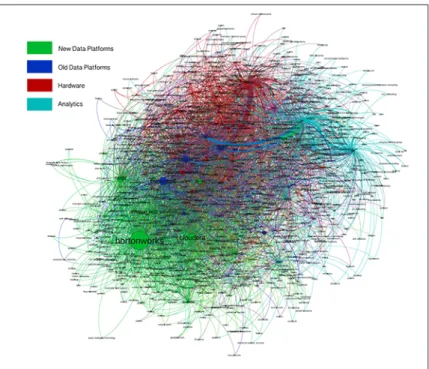
In the absence of a CRM database, how would I link one company to another? The answer: partnership pages. Most companies in the big data space have partnership pages, which list other companies a given company works with in providing its products or services. I created a hybrid machine/turk system that gathered the partnerships of the four Hadoop vendors. Then I gathered the partnerships of these partners to create a “second degree network” of partnerships. Once clustered, the initial data looked like Figure 2-10.
Figure 2-10. Graphical representation of corporate partnerships among four Hadoop vendors (image courtesy of Russell Jurney, used with per‐ mission)
Taking a cue from InMaps once again, I hand labeled the clusters. We were pleased to find that they corresponded roughly with sectors in the big data market—new/old data platforms, and hardware and analytic software companies. An idea we’ve been playing with is to create these clusters, then classify new leads into its cluster, and use
this cluster field in marketing automation. This would allow better targeting with cluster-specific content.
Market reports
At this point, I really thought I was onto something. Something worth exploring fully. What if we mapped entire markets, indeed the entire economy, in terms of relationships between companies? What could we do with this data? I believe that with a scope into how the economy works, we could make markets more efficient.
Early in 2015, I founded Relato with this goal in mind: improve sales, marketing, and strategy by mapping the economy. Working on the company full time since January, we’ve partnered with O’Reilly to extend the initial work on the big data space to create an in-depth report: “Mapping Big Data: A Data-Driven Market Report.” The report includes an analysis of data we’ve collected about companies in the big data space, along with expert commentary. This is a new kind of market report that you’ll be seeing more of in the future.
Conclusion
We’ve shown how networks are the structure behind many different phenomena. When you next encounter a new data set, you should ask yourself: Is this a network? What would understanding this data as a network allow me to do?
Let’s Build Open Source Tensor Libraries for
Data Science
by Ben Lorica
You can read this post on oreilly.com here.
Data scientists frequently find themselves dealing with high-dimensional feature spaces. As an example, text mining usually involves vocabularies comprised of 10,000+ different words. Many analytic problems involve linear algebra, particularly 2D matrix fac‐ torization techniques, for which several open source implementa‐ tions are available. Anyone working on implementing machine learning algorithms ends up needing a good library for matrix anal‐ ysis and operations.
But why stop at 2D representations? In a Strata + Hadoop World San Jose presentation, UC Irvine professor Anima Anandku‐ mar described how techniques developed for higher-dimensional arrays can be applied to machine learning. Tensors are generaliza‐ tions of matrices that let you look beyond pairwise relationships to higher-dimensional models (a matrix is a second-order tensor). For instance, one can examine patterns between any three (or more) dimensions in data sets. In a text mining application, this leads to models that incorporate the co-occurrence of three or more words, and in social networks, you can use tensors to encode arbitrary degrees of influence (e.g., “friend of friend of friend” of a user). Being able to capture higher-order relationships proves to be quite useful. In her talk, Anandkumar described applications to latent variable models, including text mining (topic models), information science (social network analysis), recommender systems, and deep neural networks. A natural entry point for applications is to look at generalizations of matrix (2D) techniques to higher-dimensional arrays. For example, Figure 2-11 illustrates one form of eigen decomposition.
Figure 2-11. Spectral decomposition of tensors (image courtesy of Anima Anandkumar, used with permission)
Tensor Methods Are Accurate and Embarrassingly
Parallel
Latent variable models and deep neural networks can be solved using other methods, including maximum likelihood and local search techniques (gradient descent, variational inference, EM). So, why use tensors at all? Unlike variational inference and EM, tensor methods produce global and not local optima, under reasonable conditions. In her talk, Anandkumar described some recent exam‐ ples—topic models and social network analysis—where tensor methods proved to be faster and more accurate than other methods (see Figure 2-12).
Figure 2-12. Error rates and recovery ratios from recent community detection experiments (running time measured in seconds; image courtesy of Anima Anandkumar, used with permission)
Scalability is another important reason why tensors are generating interest. Tensor decomposition algorithms have been parallelized using GPUs, and more recently using Apache REEF (a dis‐ tributed framework originally developed by Microsoft). To summa‐ rize, early results are promising (in terms of speed and accuracy), and implementations in distributed systems lead to algorithms that scale to extremely large data sets (see Figure 2-13).