Emission estimates for diffuse sources
Netherlands Emission Inventory
Road traffic brake wear
Road traffic brake wear
1 Description of emission sourceThis fact sheet sets out a method for calculating emissions resulting from the wear of brake linings in road traffic. Wear from brake linings and deposition of particulate matter in the environment is primarily a major source of copper.
This emission source is allocated to the governmental target sector “Transport” within the National Emission Inventory.
2 Explanation of calculation method
The emissions are calculated separately for various vehicle categories. Emissions are calculated by multiplying an activity rate (AR), in this case the number of kilometres driven on Dutch roads, by an emission factor (EF), expressed in emission per AR unit.
Es = AR x EF Where:
Es = Emission of particulates (kg)
AR = Traffic performance, distance covered on Dutch road network (km) EF = Emission factor (kg/km).
The copper emission can be calculated as a fraction of the particulates generated: EX = Es x X
Where:
Ex = Emission of component X (kg)
X = Content of component X in brake lining (-/-).
The emission calculated in this way is referred to as the total emission. A specific proportion of this ends up in surface water: this is the net pollution of the surface water.
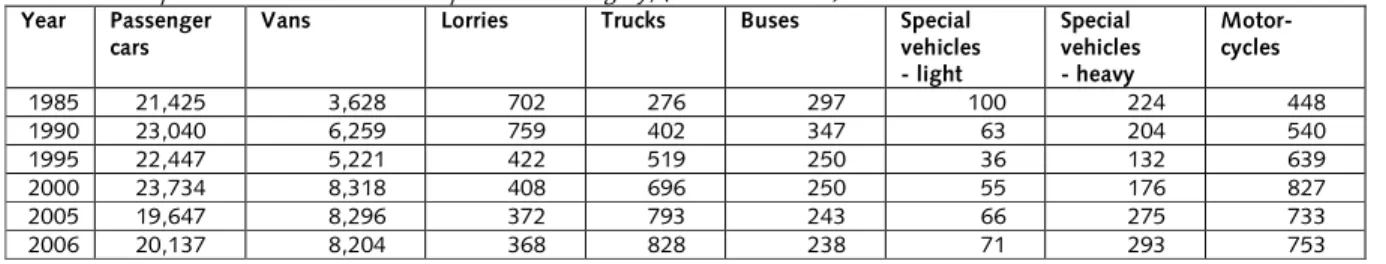
3 Activity rates
The activity rate reflects traffic performance by various vehicle categories. Numbers are supplied by Statistics Netherlands (CBS) to the Task Force Traffic and Transport. The Task Force Traffic and Transport then calculates the division among the various road types (urban driving, rural driving and highway driving).
Table 1: Traffic performance on urban roads per vehicle category, (in millions of km)
Year Passenger cars
Vans Lorries Trucks Buses Special vehicles - light Special vehicles - heavy Motor-cycles 1985 21,425 3,628 702 276 297 100 224 448 1990 23,040 6,259 759 402 347 63 204 540 1995 22,447 5,221 422 519 250 36 132 639 2000 23,734 8,318 408 696 250 55 176 827 2005 19,647 8,296 372 793 243 66 275 733 2006 20,137 8,204 368 828 238 71 293 753
Table 2: Traffic performance on rural roads per vehicle category, (in millions of km)
Year Passenger cars
Vans Lorries Trucks Buses Special vehicles - light Special vehicles - heavy Motor- cycles 1985 26,479 649 1,222 521 184 16 35 171 1990 30,115 805 1,159 504 194 13 41 221 1995 32,239 3,133 1,044 498 163 15 55 418 2000 36,181 4,991 1,011 668 163 23 73 541 2005 34,407 6,222 921 761 159 28 114 733 2006 35,163 6,153 912 794 156 30 122 753
Table 3: Traffic performance on highways, (in millions of km)
Year Passenger cars
Vans Lorries Trucks Buses Special vehicles - light Special vehicles - heavy Motorcycles 1985 20,856 470 1,306 857 113 9 21 83 1990 28,119 716 1,441 1,124 119 8 27 126 1995 34,103 2,089 1,935 1,604 241 9 33 300 2000 37,890 3,327 1,874 2,151 241 14 44 388 2005 42,888 6,222 1,708 2,451 235 17 69 733 2006 43,116 6,153 1,690 2,558 230 18 73 753 4 Emission factors
Particulate Emission factors from brake linings
Emission factors for particulates from brake linings may be calculated as follows: Weight of brake linings (g) * wear before replacement (-/-) / life (km)
Over the last few years, various research groups have performed studies to estimate the total emission factor from brake linings. Some of these emission factors (for example, Pagotto et al. [1] and Luhana et al.[2]), are based on the mass balance as shown in formula above. Other emission factors are obtained by interpretation of measurements. Particularly with respect to emission factors based on measurements, the results diverge widely from 1 to 100 g/km. In this respect it is important to remember that measurements frequently do not produce an emission factor, but the emission factor to one compartment (see also section 7).
A number of results based on mass balance are set out in table 3. As shown in this table, the differences are quite small. Despite this, there are nevertheless differences in accuracy with respect to the methodology applied. The emission factors calculated by Luhana et al. [2] appear to be the most reliable, because they are elaborated by measuring the weight loss of the brake discs of a number of vehicles over a number of kilometres driven that is assessed precisely. Reference will therefore be made to these emission factors for passenger cars. The emission factors calculated by Pagatto et al. [1] are based on measured weight loss and an estimated number of kilometres driven, and seem to be somewhat less accurate. However, these emission factors are the best available for vans and lorries. The emission factors calculated by Klein et al [4] are based on estimated weight loss and number of kilometres driven, and are therefore based on a less robust approach. However, this is the only value available for motorcycles. The result published by van Hyfte [3] is based on a review of available emission factors in literature, giving average values for the published emission factors, including a number of interpreted deposition measurements. These values do not take into consideration the quality of the emission factor published, with the result that the value of the average values loses quality.
Table 4: Calculation of emission factors for particulates from brake linings per vehicle category, (mg/km)
Passenger cars
Vans Lorries Trucks Buses Special vehicles Motor- cycles f1) r1) f r f f Weight of brake lining (g) 540 350 770 490 6,700 13,000 Wear on replacement (%) 75 75 75 75 75 Life (1000 km) 30 75 30 75 200 400 EF Pagotto [1] 13.4 3.5 19.4 4.9 25 25 8.5 12.2 25 EF Luhana [2] 8.8 EF Klein2) [4] 8 10 43 43 31 4 EF Van Hyfte [3] 6.8 10.6 26.5 26.5 17.2 4
1) f: front brakes; r: rear brakes
2) only relates to proportion of fine particulate
The emission factor for lorries is used for trucks and buses. The emission factor for vans is used for special light vehicles and the emission factor for lorries is used for special heavy vehicles. The selected emission factors are again indicated in bold in table 4.
Emission factors for urban driving, rural driving and highway driving.
There is usually more frequent braking within urban areas than outside these areas. It can
therefore be expected that the emission factor per km for urban driving is higher than the emission factor for rural driving and highway driving. Luhana et al. [2] studied the impact of average driving speed on the wear of brake linings in passenger cars. At an average driving speed of 80 kph, the wear per km is still only 40% of the wear per km at 40 kph. Based on these results, if one assumes that the emission factor for rural driving and highway driving is 40% of the emission factor for urban driving, it is then possible to derive the emission factors for urban, rural and highway driving, as shown in table 5, from the number of kilometres driven within urban and rural areas and on highways (table 1 and 2) and the average emission factor in table 4.
Table 5: Emission factors for forming particulates from brake linings in road traffic within and outside urban areas, (mg/km)
Passenge r cars
Vans Lorries Trucks Buses Special vehicles - light Special vehicles - heavy Motor- cycles EF total 8.8 12.2 25 25 25 12.2 25 4 EF within urban area 16.1 17.4 52.7 48.2 39.7 17.4 52.7 5.9 EF within rural area 6.4 7.0 21.1 19.3 16.1 7.0 21.1 2.3 Particulate matter (PM10)
Estimates for the quantity of wear of brake linings emitted as fine particulates (PM10) vary. Van den Brink [5] estimates the quantity of PM10 in the brake particulates formed to be 55%; Garg et al. [6] estimate this fraction to be 35%, based on an analysis of particle size distribution of the particulates formed. Sanders et al. [7] reports that in laboratory tests an average of 63% of brake lining wear is released as fine particulate. Fraunhofer [8] estimates the fraction of fine particulates to be 40% based on measurements of particle size distribution. Based on all this data, van Hyfte [3] estimates the quantity of PM10in the brake particulates formed to be 49%, which is the figure used in this study.
Copper content and content of other metals
The particulates originating from brake linings have a complex composition. It contains residue of brake linings comprising metal fibres (in particular copper, zinc, lead and antimony), inorganic filler material (for example cheap metal oxides such as barium oxide or clay-like material) and friction modifiers (carbon, graphite) bound to each other by means of a wide range of
phenol-formaldehyde resins. The particulates also contain residue of the brake disc (usually iron-nickel-zinc alloys) and brake fluid (specific organic components such as n-alkanoic acids or polyalkene glycol ethers). The organic components may be converted into PAH by heat released during braking.
There is considerable information available in the literature about copper content in brake linings. Compared to many other metals, estimates of this copper content are reasonably consistent, varying from 5% (for example, Harrison [9]) to 15% (for example, Pagotto [1]). Van Hyfte [3] provides a list of available literature and estimates the average copper content to be 10%, based on the available European studies. This 10% is also in line with interpretations of increased concentrations of fine particulates and copper within this fine particulates in the Maas tunnel [10]. The most significant other metal pollutants in terms of scope and toxicity are Cu, Cd, Ni, Pb, Sb and Zn.
A number of studies are available focusing on the brake lining itself (for example, van Brewer [11] and Westerlund [12]). There are also a number of studies assessing the composition of brake particulates based on results of particulates collected in the environment (such as van Luhana et al., [2]; Hildeman, [13]). Reference [14] focuses specifically on lead and calculates this content based on the composition of a typical brake lining and the lead content of the brake lining. Metal contents based on interpretations of composition of particulates deposition by Luhana et al., and Hildeman, deliver results in values that likely are to be considered as too low: approximately 300 times lower compared to the analyses of the actual brake linings. The particulate samples taken by Hildeman and Luhana were probably highly contaminated with particulates from other sources, for which the findings were not sufficiently adjusted. Analyses of the actual brake linings (Brewer [11] and Westerlund [12]) appear to produce better results, but probably underestimate the content of Ni and Zn because these components may also come from the brake disc. In lack of better information, these analyses of brake linings are used as emission factor. The Okopol study [14] appears to provide the best information for lead. The emission factors selected in this fact sheet are entered in the last column of the table below. The emission factors of metals other than copper are very uncertain and only provide an estimate of the order of magnitude of emissions, as indicated by the expression of numbers.
Table 6: Metal content of brake lining particulate, (mg/kg of particulates formed)
Hildeman [13] Brewer [11]1) Westerlund,
[12]1)
Ökopol, [14]1,2) Lulana [2]3 Selected
emission factor copper 370 15,000-140,000 50,000-120,000 200,000 430 100,000 cadmium 3-30 3-8 - 10 nickel 660 200-850 70-180 260 100 lead 50 2,000-4,000 9,000-19,000 7,000 320 10,000 antimony 10,000 100,000 40 10,000 zinc 270 300-22,000 7,000-24,000 4600 10,000
1) Refers to brake lining.
2) Interpretation of Okopol’s specifications: 20% brass fibres, 10% antimony compound and a total of 0.7% lead in the brake lining
3) Lulana reports on metal/copper ratios. 10% copper in the particulates is assumed.
5 Effects of policy measures
No developments are found in the literature consulted with respect to emission factors and copper content of brake linings.
6 Emissions calculated
Tables 7, 8 and 9 below show the primary emissions of brake particulates for various categories of vehicle per year. The emissions are calculated by multiplying the emission factors in table 4 by the activity rates in tables 1 and 2 and 3.
Table 7: Formation of particulates within urban areas, (tonnes)
Year Passenger cars
Vans Lorries Trucks Buses Special vehicles - light Special vehicle - heavy Motorcycles Total 1985 345 89 37 13 12 2 12 3 512 1990 371 109 40 19 14 1 11 3 568 1995 361 91 22 25 10 1 7 4 521 2000 382 145 22 34 10 1 9 5 607 2005 316 144 20 38 10 1 14 4 548 2006 324 143 19 40 9 1 15 4 557
Table 8: Formation of brake lining particulates within rural areas, (tonnes)
Year Passenger cars
Vans Lorries Trucks Buses Special vehicles - light Special vehicle - heavy Motorcycles Total 1985 169 5 26 10 3 0 1 0 215 1990 193 6 24 10 3 0 1 1 237 1995 206 22 22 10 3 0 1 1 265 2000 232 35 21 13 3 0 2 1 306 2005 220 44 19 15 3 0 2 2 305 2006 225 43 19 15 3 0 3 2 310
Table 9: Formation of brake lining particulates on highways, (tonnes)
Year Passenger cars
Vans Lorries Trucks Buses Special vehicles - light Special vehicle - heavy Motorcycles Total 1985 133 3 28 17 2 0 0 0 183 1990 180 5 30 22 2 0 1 0 240 1995 218 15 41 31 4 0 1 1 310 2000 242 23 40 42 4 0 1 1 353 2005 274 44 36 47 4 0 1 1 408 2006 276 43 36 49 4 0 2 2 411
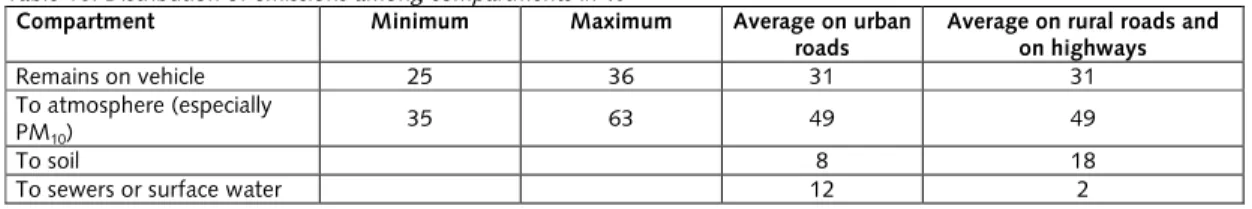
7 Release into environmental compartments
To quantify the distribution among the compartments, the method published by Van Hyfte [3] was used, based on mass balance:
emission to soil and groundwater = formation of brake particulates - share remaining on vehicle - share emitted as fine particulate
The share that stays behind on the vehicle is estimated by Sundberg [15] to be 25%. Based on results of laboratory measurements, Sanders [7] concludes that 22-47% of the brake lining particulates remains on the vehicle. Based on this data, van Hyfte [3] estimates that 31% stays behind on the vehicle, and is partially removed in carwashes, garages and breaker’s yards, so it no longer contributes to emissions to atmosphere, soil or water.
The share emitted as fine particulates is estimated by van Hyfte [3] to be 49% based on data published in the literature. This data is substantiated in section 4. Van Hyfte [3] estimates that 20% of brake particulates (100% - 31% remaining behind on the vehicle - 49% emitted as fine particulate) precipitates to soil and surface water.
The distribution worked out by Klein et al. [4] is taken as the distribution to soil and surface water: Within urban areas, 60% is transported to the surface water via the sewer system. On rural roads and on highways, 90% ends up in the soil and 10% directly in the surface water: i.e. 18% and 2% respectively of the total.
Table 10: Distribution of emissions among compartments in %
Compartment Minimum Maximum Average on urban roads
Average on rural roads and on highways Remains on vehicle 25 36 31 31 To atmosphere (especially PM10) 35 63 49 49 To soil 8 18
The copper pollution can be calculated from the quantity of particulates formed from brake linings as shown in tables 6, 7 and 8, the copper content of brake linings and the share of particulates emitted to the sewer system or surface water.
The resultant calculations of copper pollution to surface water and sewers are shown in tables 11 and 12. The corresponding formulae show how these emissions were calculated.
copper emission on urban roads to sewers =
formation of particulates from brake linings * copper content of the particulates * share emitted to water =
formation of particulates from brake linings in table 7 * 10% * 12%
Table 11: Emission of copper from brake linings on urban roads to sewers, (tonnes)
Year Passenger cars
Vans Lorries Trucks Buses Special vehicles Motor- cycles Total 1985 4.1 1.1 0.44 0.16 0.14 0.17 0.04 6.1 1990 4.4 1.3 0.48 0.23 0.17 0.14 0.04 6.7 1995 4.0 1.2 0.27 0.31 0.12 0.09 0.05 6.0 2000 3.6 1.4 0.26 0.42 0.12 0.13 0.04 6.0 2005 3.8 1.7 0.24 0.46 0.12 0.19 0.05 6.6 2006 3.9 1.7 0.23 0.48 0.11 0.20 0.05 6.7
copper emission on rural roads and on highways to surface water =
formation of particulates from brake linings * copper content of the particulates * share emitted to water =
formation of particulates from brake linings in table 8 * 10% * 2%
Table 12: Emission of copper from brake linings on rural roads, to surface water, (tonnes)
Year Passenger cars
Vans Lorries Trucks Buses Special vehicles Motorcycles Total 1985 0.38 0.01 0.05 0.02 0.01 0.002 0.000 0.43 1990 0.38 0.01 0.05 0.02 0.01 0.002 0.001 0.47 1995 0.38 0.03 0.04 0.02 0.01 0.003 0.002 0.49 2000 0.42 0.07 0.04 0.03 0.01 0.004 0.003 0.57 2005 0.44 0.09 0.04 0.03 0.01 0.005 0.003 0.61 2006 0.45 0.09 0.04 0.03 0.01 0.006 0.003 0.62
Emissions to highways is restricted by the increasing use of very open asphalted concrete (ZOAB) over the years to cover road surfaces. With this type of surface, a large proportion of the released particulates are trapped in the coarse pores on the road surface. To a large extent, this prevents diffusion of the particulates in the environment. Emissions of most metals are reduced by more than 90%, according to a CIW report [16].
This report provides an overview of all measurements performed over the years. The calculations are based on the assumption that where the roads are covered in ZOAB, emissions are reduced by 95%.
Table 13: ZOAB correction factors for metals
Year ZOAB share on highways (in %) ZOAB correction factor
1985 0.5 1.00 1990 10 0.90 1995 31 0.71 2000 53 0.50 2005 68 0.35 2006 71 0.33
Table 14: Emission of copper from brake linings on highways to surface water, (tonnes)
Year Passenger cars
Vans Lorries Trucks Buses Special vehicles - light Motorcycles Total 1985 0.27 0.01 0.06 0.03 0.004 0.000 0.000 0.37 1990 0.32 0.01 0.05 0.04 0.003 0.001 0.001 0.43 1995 0.29 0.02 0.06 0.05 0.006 0.001 0.001 0.42 2000 0.25 0.04 0.04 0.04 0.004 0.001 0.001 0.38 2005 0.19 0.03 0.03 0.03 0.003 0.001 0.001 0.29 2006 0.18 0.03 0.02 0.03 0.002 0.001 0.001 0.27
In the same way, emissions of other metals can be calculated from the formation of particulates from brake linings, as shown in tables 6, 7 and 8 and the metal content in the particulates as shown in table 6 and the share emitted to the sewers or surface water, as shown in table 9. The results are shown in tables 15 and 16.
Table 15: Emissions of other metals from brake linings on urban roads to sewers, (tonnes)
Year Cadmium Nickel Lead Antimony Zinc
1985 0.0006 0.006 0.6 0.6 0.6 1990 0.0007 0.007 0.7 0.7 0.7 1995 0.0006 0.006 0.6 0.6 0.6 2000 0.0006 0.006 0.6 0.6 0.6 2005 0.0007 0.007 0.7 0.7 0.7 2006 0.0007 0.007 0.7 0.7 0.7
Table 16: Emissions of other metals from brake linings on rural roads and on highways to surface water, (tonnes)
Year Cadmium Nickel Lead Antimony Zinc
1985 0.00008 0.0008 0.08 0.08 0.08 1990 0.00009 0.0009 0.09 0.09 0.09 1995 0.00009 0.0009 0.09 0.09 0.09 2000 0.00009 0.0009 0.09 0.09 0.09 2005 0.00009 0.0009 0.09 0.09 0.09 2006 0.00009 0.0009 0.09 0.09 0.09
The emissions of brake particulates emitted as fine particulates to atmosphere are calculated by calculating 49% (table 9) on the total primary emissions as entered in tables 6, 7 and 8.
Table 17: Emissions of fine particulates (PM10) as a result of wear from brake linings to the atmosphere, (tonnes)
Year Urban roads Rural roads Highways Total
1985 251 105 90 446 1990 275 115 117 506 1995 247 119 145 511 2000 243 140 186 569 2005 270 150 199 619 2006 273 152 201 626
The total emissions of metals to atmosphere are calculated by combining the total emissions in table 17 with the metal content values set out in table 6.
Table 18: Emissions of metals as a result of wear from brake linings to the atmosphere, (tonnes)
Year Copper Cadmium Nickel Lead Antimony Zinc
1985 44.6 0.045 0.45 4.5 4.5 4.5 1990 50.6 0.051 0.51 5.1 5.1 5.1 1995 51.1 0.051 0.51 5.1 5.1 5.1 2000 5.69 0.057 0.57 5.7 5.7 5.7 2005 6.19 0.062 0.62 6.2 6.2 6.2 2006 6.26 0.063 0.63 6.3 6.3 6.3
8 Description of emission pathways to water
It is assumed that 60% of emissions to soil and water within urban areas enters the sewers indirectly and 40% goes into the soil. On rural roads and on highways 90% of emissions is assigned to the soil compartment, and 10% of emission is assigned to the surface water directly.
9 Spatial allocation
Emissions on rural roads and on highways are spatially allocated on the basis of data on traffic intensities and emissions on urban roads on the basis of the number of inhabitants, as recorded in the National Emission Inventory database
10 Comments and changes in regard to previous version
Various changes were made in 2006. Previously only fine particulates as a result of brake wear were calculated by the Task Force Traffic and Transport. The currently presented emission factors for emissions to the atmosphere are lower than the emission factors of fine particulates previously applied by the Task Force Traffic and Transport, because only 49% of emissions of brake
particulates is considered to be fine particulate matter, whereas previously this figure was 100%. This report now also calculates emissions to soil and water.
In the methodology report of the Task Force Traffic and Transport, Klein et al. [4], the copper content measured in particulate matter collected outside the vehicle, as measured by Hildeman [13], was used. According to this inventory, the actual content of copper in brake linings is approximately 300 times higher. This prompted the calculation to be revised. In 2003, the calculated emission of copper from brake linings to atmosphere was approximately 66 tons Cu (in 2004, a total of 1350 tons of particulate matter was formed from brake linings. 49% of this amount is fine particulate matter emitted to atmosphere; 10% is copper). Until that time, the estimated amount of copper emissions was 0.5 tons Cu [17].
In 2008, the distribution among compartments within and outside urban areas was adjusted. It is now assumed that 60% of emissions within urban areas enters the sewers and 40% goes into the soil, whereas before it was assumed that all emissions enter the sewers. This is now equated in the same manner as the distribution of emissions due to tyre wear.
11 Accuracy and indicated subjects for improvements
The method used in Emission Inventory publications has been followed as far as possible in classifying the quality of information [18]. It is based on the CORINAIR (CORe emission
INventories AIR) methodology, which applies the following quality classifications: CORINAIR uses the following quality classifications:
A: a value based on a large number of measurements from representative sources; B: a value based on a number of measurements from some of the sources that are
representative of the sector;
C: a value based on a limited number of measurements, together with estimates based on technical knowledge of the process;
D: a value based on a small number of measurements, together with estimates based on assumptions;
E: a value based on a technical calculation on the basis of a number of assumptions. In general, we can conclude that emission factors are based on a number of studies carried out in the Netherlands and internationally. There is reasonable to good consistency in the results of these studies. This means that we can classify the emission factors in category B. The activity rate is updated by the Traffic and Carriage task group regularly, and can be classified under category A. The division of emissions among individual compartments is very uncertain, so category D applies here. In this respect, there is again less uncertainty with emission pathways into water, so they are classed as B. Finally, the spatial allocation of emissions is fairly reliable, so it comes into reliability
Element of
emission calculation
Reliability classification
Activity rates A
Emission factor for copper Emission factors for other metals
B D
Distribution among compartments D
Emission pathways to water B
Spatial allocation B
12 Request for reactions
Any questions or comments on this working document should be addressed to: Richard van Hoorn, Centre for Water Management, +31 (0)320-298491, email [email protected] or Joost van den Roovaart, Deltares, +31 (0)6-57315874, email [email protected].
13 References
[1] Pagotto C., Étude sur l’emission et le transfer dans les eaux et les sols des éléments traces métalliques et des hydrocarbons en domaine routier. Thèse pour obtenir le grade de docteur de l’Úniversité de Poitiers.
[2] Luhana L., Sokhi R., Warner L., Mao H, Boulter P., McCrae I., Wright J and Osborn D., PARTICULATES - Characterisation of Exhaust Particulate Emissions from Road Vehicles, Deliverable 8, Measurement of non-exhaust particulate matter, Version 2.0 – October 2004, University of Hertfordshire, College Lane, Hatfield, Herts AL10 9AB, UK, 2004.
[3] Van Hyfte A., et al., EU Risk Assessment on Copper and Copper Compounds, Assessment of Regional Exposure, final draft, May 2005, Ecolas, Antwerp, Belgium.
[4] Taakgroep Verkeer en Vervoer van het project Emissieregistratie, Methoden voor de
berekening van de emissies door mobiele bronnen in Nederland, CBS, MNP, RIZA, TNO, AVV, November 2006.
http://www.cbs.nl/nl-NL/menu/themas/natuur- milieu/methoden/dataverzameling/overige-dataverzameling/2006-methoden-emissies-mobiele-bronnen-nederland-pub.htm.
[5] Brink R. v.d., Deeltjesemissie door wegverkeer: emissiefactoren, deeltjesgrootteverdeling en chemische samenstelling. RIVM, De Bilt. 1996.
[6] Garg B.D., Cadle S.H., Mulawa P.A., Groblicki P.J., Laroo C., Parr G.A., Brake wear particulate matter emissions, Environ. Sci. Technol., 34, pp. 4463-3369, 2000.
[7] Sanders P.G., Xu N., Dalka T.M. and Maricq M.M., Airborne brake wear debris: Size distributions, composition, and a comparison of dynamometer and vehicle tests. Environ Sci Technol. Vol. 37, pp 4060-4069, 2003.
[8] Fraunhofer Institut, Presentation, referenced in Ecolas 2005: Freisetzung von Schwermetallen aus Materialen in die Umwelt - Teilvorhaben 2: Ermittlung und Reduzierung des Eintrags der Schwermetalle Kupfer, Zink und Blei aus ihre Verwendung als Dacheinbauten, Regenrinnen und Fallrohren, 2003.
[9] Harrison, Copper from brake pads background material. Prepared by Copper Research Information Flow for the Europe Copper Institute, 2003.
[10]Denier v.d. Gon H., van het Bolscher M., Hollander K., Spoelstra H., Particle matter in the size range of 2.5-10 microns in the Dutch environment - an exploratory study, TNO report 2003/181, TNO, Apeldoorn, the Netherlands, 2003.
[11]Brewer P, 1997: MSc. Thesis: Vehicles as a source of heavy metal contamination in the environment (unpublished). University of Reading, Berkshire, UK referenced in Lulana et al. 2004.
[12]Westerlund, Metal emissions from Stockholm traffic – wear of brake linings, Stockholm Environmental Administration, Sweden, 2001.
[13]Hildemann L.M., Markowski G.R. and Cass G.R., Chemical composition of emissions from urban sources of fine organic aerosol. Environmental Science and Technology. Vol. 25 (4), pp 744-759, 1991.
[14]Okopol, Heavy metals in vehicles II, Institute for Ecology and Political Affair, Hamburg, Germany, 2001.
[15]Sundberg R., Composition of brake pads during braking released material, technical report D3262 2003-06-30 Outokumpu Västeras, 2003.
[16]CIW, Afstromend wegwater, Werkgroep 4 Water en Milieu, April 2002
[17]Datawarehouse Emissieregistratie (www.emisieregistratie.nl), values recorded in July 2004 [18]Most, P.F.J. van der et al., Methoden voor de bepaling van emissies naar lucht en water.


![Table 6: Metal content of brake lining particulate, (mg/kg of particulates formed) Hildeman [13] Brewer [11] 1) Westerlund,](https://thumb-us.123doks.com/thumbv2/123dok_us/9320066.2810604/5.918.141.784.563.736/table-metal-content-particulate-particulates-hildeman-brewer-westerlund.webp)