The role of risk aversion in non-conscious decision making
Shuo Wang1, Ian Krajbich2,3, Ralph Adolphs1,2and Naotsugu Tsuchiya2,4,5,6,7* 1Computation and Neural Systems, California Institute of Technology, Pasadena, CA, USA
2
Humanities and Social Sciences, California Institute of Technology, Pasadena, CA, USA
3
Department of Economics, University of Zurich, Zurich, Switzerland
4
Brain Science Institute, RIKEN, Saitama-ken, Japan
5Advanced Telecommunication Research, Kyoto-fu, Japan 6Japan Science and Technology, Tokyo-to, Japan 7
School of Psychology and Psychiatry, Faculty of Medicine, Nursing, and Health Sciences, Monash University, Clayton, VIC, Australia
Edited by:
Eldad Yechiam, Technion – Israel Institute of Technology, Israel Reviewed by:
Christoph T. Weidemann, Swansea University, UK
Stephen M. Fleming, New York University, USA
Eyal Ert, The Hebrew University of Jerusalem, Israel
Navindra Persaud, St Michael’s Hospital, Canada
*Correspondence: Naotsugu Tsuchiya, School of Psychology and Psychiatry, Faculty of Medicine, Nursing, and Health Sciences, Monash University, Building 17, Clayton Campus, Clayton 3800, VIC, Australia.
e-mail: [email protected]
To what extent can people choose advantageously without knowing why they are mak-ing those choices? This hotly debated question has capitalized on the Iowa Gamblmak-ing Task (IGT), in which people often learn to choose advantageously without appearing to know why. However, because the IGT is unconstrained in many respects, this finding remains debated and other interpretations are possible (e.g., risk aversion, ambiguity aversion, lim-its of working memory, or insensitivity to reward/punishment can explain the finding of the IGT). Here we devised an improved variant of the IGT in which the deck-payoff contingency switches after subjects repeatedly choose from a good deck, offering the statistical power of repeated within-subject measures based on learning the reward contingencies associ-ated with each deck. We found that participants exhibited low confidence in their choices, as probed with post-decision wagering, despite high accuracy in selecting advantageous decks in the task, which is putative evidence for non-conscious decision making. However, such a behavioral dissociation could also be explained by risk aversion, a tendency to avoid risky decisions under uncertainty. By explicitly measuring risk aversion for each individual, we predicted subjects’ post-decision wagering using Bayesian modeling. We found that risk aversion indeed does play a role, but that it did not explain the entire effect. More-over, independently measured risk aversion was uncorrelated with risk aversion exhibited during our version of the IGT, raising the possibility that the latter risk aversion may be non-conscious. Our findings support the idea that people can make optimal choices without being fully aware of the basis of their decision. We suggest that non-conscious decision making may be mediated by emotional feelings of risk that are based on mechanisms distinct from those that support cognitive assessment of risk.
Keywords: decision making, consciousness, risk aversion, post-decision wagering, confidence
INTRODUCTION
Decision making refers to a process of forming preferences, select-ing and executselect-ing an action from alternatives, and evaluatselect-ing and predicting rewarding or aversive outcomes. Whether we can make accurate and optimal decisions without full conscious awareness of the basis for the decision remains controversial, while evidence for non-conscious processing itself has been established in the per-ceptual domain [e.g., implicit memory and priming (Kouider and Dehaene, 2007)]. Some evidence suggests that neuropsychological patients with damage to primary visual cortex lack visual phenom-enal awareness, yet can successfully make many visually guided decisions (Stoerig et al., 2002; Persaud et al., 2007). Under cer-tain circumstances, neurologically healthy subjects seem to make advantageous decisions without knowing why, for instance when they face a situation where the number of relevant parameters exceeds the limits of conscious working memory (Dijksterhuis et al., 2006).
Another possible instance of non-conscious decision making is reported in a number of studies using the Iowa Gambling Task
(IGT). In the past decade, the IGT has been extensively used as a probe for decision making in situations that feature uncertainty, reward, and punishment, mimicking aspects of real life ( Dama-sio, 1994;Bechara et al., 1997, 1999, 2000;Anderson et al., 1999;
Fellows, 2004;Oya et al., 2005;Dunn et al., 2006). In the IGT, participants are faced with four decks of cards. In each trial, they choose one deck and draw a card from it. Each card is associ-ated with a variable amount of monetary gain. In some trials, it is followed by a large amount of loss. In the long run, par-ticipants lose money on some decks, but win money on others. Yet the complexity of payoffs in the IGT prevents subjects from calculating the expected value associated with each deck, and sub-jects typically feel as though they are guessing when making their choices, especially early on in the task. Past studies of the IGT have reported an intriguing phenomenon, which motivated our study: subjects start to make advantageous card selections well before they can verbalize why they selected those decks (Bechara et al., 1997;Persaud et al., 2007). Remarkably, their autonomic response, as measured by skin conductance, also distinguishes good and bad
deck selection before the subjects can verbalize the basis of their deck selection (Bechara et al., 1997), supporting the theory that emotional response informs complex decision making (Damasio, 1994;Bechara et al., 2000; but also, seeTomb et al., 2002;Dunn et al., 2006). Though an intriguing finding, the claim that decision making occurs in the absence of awareness in the IGT has been criticized on several grounds. In particular,Maia and McClelland (2004, 2005)have criticized the operational definition of “non-conscious,” arguing that people may be vaguely aware of their strategy even though they do not say so with open-ended ques-tions (Bechara et al., 1997). When subjects were probed every 10 trials by a set of questionnaires, which involves numerical rating of the goodness of each deck, direct estimation of the expected payoff of each deck, expression of the best strategy for the IGT, and so on, it was found that they started to make optimal choices at the same time as they started to show some form of conscious awareness (Maia and McClelland, 2004;Persaud et al., 2007).
However, these detailed questionnaires have themselves been criticized because they force subjects to introspect in an unnatural way during decision making (Koch and Preuschoff, 2007), thus undermining the methods for identifying implicit knowledge by prompting subjects to become aware when they otherwise would not (Bechara et al., 2005). To address this problem,Persaud et al. (2007)proposed an alternative measure of awareness, which is objective in that it does not rely on subjective ratings, and also indirect and less obtrusive compared to the detailed questionnaire used by Maia and McClelland (2004). In Persaud et al.’s post-decision wagering task, subjects indirectly reveal the confidence that they have in their decision by wagering high or low on the expected outcome of their choice. A correct choice followed by a high wager is taken as an index of conscious awareness. When probed with open-ended questions (Bechara et al., 1997), post-decision wagering replicated the original findings: subjects chose advantageously from the decks before they showed any evidence of conscious awareness as revealed by post-decision wagering. How-ever, when probed with a more intrusive questionnaire (Maia and McClelland, 2004), advantageous deck choices and optimal post-decision wagers developed concurrently. These results reconcile the previous findings and underline the fact that detailed inquiry of conscious awareness can alter the very conscious access one intends to measure.
The validity of post-decision wagering as a probe of con-sciousness, however, has yet to be fully demonstrated (Koch and Preuschoff, 2007;Clifford et al., 2008a;Schurger and Sher, 2008;
Dienes and Seth, 2010;Fleming and Dolan, 2010;Sandberg et al., 2010). The ensuing critiques have argued that there is a distinction between true performance without awareness on the one hand, and simply a reluctance, on the other hand, to gamble with weak sensory evidence despite full awareness (Clifford et al., 2008a). This second possibility is “risk aversion” (Koch and Preuschoff, 2007;
Schurger and Sher, 2008), the well-known finding that people will often make a choice that has a lower expected value than some other option, if it also has less variance in its payoffs. This phenom-enon is accounted for by assuming that people maximize utility rather than expected value, where utility is a concave function of value for risk-averse individuals (and convex for risk-seeking individuals) (Kahneman and Tversky, 1979;Rabin, 2000;Holt and
Laury, 2002). Therefore, risk-averse subjects often turn down gam-bles with positive expected value, simply because the variance (or their belief about the variance) in payoffs is sufficiently high that their utility for the gamble is lower than an alternative option. In other words, subjects’ wagering strategies may be a reflection of their attitude toward risk, and so sub-optimal wagering may be perfectly consistent with their preferences (Schurger and Sher, 2008). In fact,Dienes and Seth (2010)found correlation between risk aversion and the degree of non-conscious knowledge inferred from wagering. It is therefore critical to understand the role of risk aversion in post-decision wagering in order to fully dissect the role of non-conscious processes in decision making.
There are additional aspects in the task design of the IGT itself (Fellows, 2004; Dunn et al., 2006; Bossaerts et al., 2008), which preclude an unequivocal interpretation either for or against non-conscious decision making. Notably, the IGT has at most one onset of awareness and is essentially a one-shot experiment, where subjects are not allowed to practice the task and they are not informed of any critical information about the task structure (e.g., the possible payoff structure for each deck, when the task ends, etc.). In such a situation, people are known to exhibit ambi-guity aversion (Ellsberg, 1963;Camerer and Weber, 1992;Rode et al., 1999;Hsu et al., 2005), which may or may not be related to non-conscious decision making. In the economics literature, ambiguity refers to situations where the probabilities of the dif-ferent outcomes are unknown. Ambiguity aversion then refers to the fact that most people tend to avoid choosing options where the probabilities are unknown. It is important to note that risk aversion and ambiguity aversion are separate phenomena. Risk aversion describes an individual’s aversion to variance in pay-offs while ambiguity aversion describes an individual’s aversion to unknown probabilities (lack of information about the likelihood of the outcomes).
In addition, due to the IGT’s one-shot nature, subjects can notice which decks are good at most once during the experiment. This is statistically inefficient, yielding effects that are sometimes unreliable even in healthy normal controls (Dunn et al., 2006). While a previous study (Oya et al., 2005) applied a reinforcement learning algorithm to the IGT to solve some of these difficulties, it remains unclear how to incorporate risk aversion effects into rein-forcement learning under the unconstrained parameters of the original IGT (Bossaerts et al., 2008).
The goal of our study was to test for non-conscious decision making while ruling out other explanations. Toward that aim, we modified the IGT in four important ways. First, we incorporated post-decision wagering to probe subjects’ awareness indirectly in each trial (Persaud et al., 2007). Second, to improve statistical power, we repeatedly reshuffled deck-payoff contingencies once subjects noticed the contingency, resulting in multiple epochs of learning, and choice within each subject. Third, to eliminate ambi-guity and heterogeneous priors about the task structure, we told subjects the structure of the game by detailing the distribution of payoffs from the four decks (but without identifying the location of the decks). This also allowed us to apply a formal Bayesian model to subjects’ choices. Fourth, we measured each subject’s risk aver-sion profile with a similar but explicit task where they were asked to wager on various gambles with different expected values and
levels of risk (shown explicitly). We incorporated this measure of explicit risk aversion into the Bayesian model to predict subjects’ wagering behaviors.
With our modified version of the IGT, we replicated the finding that there is a gap between when subjects start to choose optimally in the IGT and when they start to bet high in the post-decision wagering task (Persaud et al., 2007). Subjects wagered high much less often than predicted from the Bayesian model incorporating their risk aversion profiles. Thus, the discrepancy between good choice behavior yet poor wagering cannot be fully explained by risk aversion alone. We also found that risk aversion in our modified IGT and in the explicit task were uncorrelated. We suggest that risk aversion observed in our version of the IGT may reflect processes that are distinct from those at work when payoff probabilities are explicitly known. Such implicit risk aversion may arise from the feeling of risk (Loewenstein et al., 2001) under complicated real life situations where no explicit probabilities are available and may be an instance of a “somatic marker” that helps us navigate choices and plans in everyday life (Damasio, 1994).
MATERIALS AND METHODS
SUBJECTS AND EXPERIMENTAL PROCEDURE
We carried out two experiments, involving separate subject sam-ples. Each experiment consisted of the two phases described below, but their order was counterbalanced.
Experiment 1
Sixteen students (six females) from the California Institute of Technology (Caltech) gave written informed consent according to a protocol approved by the Caltech IRB. The age of subjects ranged from 18 to 24 (mean=21). Their psychological and eco-nomic background information was collected at the end of the experiment.
All participants first participated in 100 trials of a computer-ized version of the IGT (Bechara et al., 1994) with post-decision wagering (Persaud et al., 2007), followed by two versions of our learning task (Figure 1A) without knowledge of the task structure or the payoffs. Data from these prior tasks are not analyzed or presented in the present study, but it is important to note that they
FIGURE 1 | Task structure. (A)The learning task with post-decision wagering. Four decks were presented to subjects on a computer display. After subjects chose a card, they wagered either $50 or $25. Subjects saw the outcome of the trial immediately after wagering.(B)The explicit risk aversion task. Identical payoff structures were used as in the learning task.
The payoff structure was depicted with pie charts. The probability with which each pie chart would be selected was indicated by a yellow percentage. Subjects wagered either $50 or $25.(C)The payoff structures for four decks in the simple (left) and the complex (right) version of the tasks.
provided all subjects with a substantial and equal amount of prior background experience.
Each subject then underwent two phases of the experiment in the same fixed order:
Phase 1–Two versions of the learning task with post-decision wagering, after being informed of the payoff distributions from the different types of decks, 100 trials each.
Phase 2–Two versions of the explicit risk aversion task (Figure 1B), the first version with 50 trials of the “simple” gamble and the second with 100 trials of the “complex” gamble (Figure 1C, see below for details of different versions of the task).
Subjects were familiarized with the tasks and post-decision wagering through practice trials (∼20 trials). Within each phase, the order of the two versions of the tasks was randomized across subjects. Questionnaires were given after each phase to make sure subjects understood the tasks.
Subjects were paid a fixed amount for their participation ($5), a fixed amount ($3) for the IGT, as well as a variable amount for their performance (mean=$5.34) in the learning and explicit tasks. For the learning task, subjects were paid the amount they earned, which was divided by 2000. For the explicit risk aversion task, subjects were paid at the end of their experiment, based on their earnings from one randomly selected trial.
Experiment 2
We conducted Experiment 2 with 20 naïve Caltech subjects. The tasks in Experiment 2 were identical to those in Experiment 1, with four important differences:
1) Subjects did not receive any prior background tasks (IGT or learning task), as they had in Experiment 1.
2) The two phases were done in a fixed order (Phase 2 first, then Phase 1), counterbalancing the order from Experiment 1. 3) Subjects underwent twoexplicit risk aversion tasks, 100 trials
of the “simple” and 100 trials of the “complex” gamble. Unlike Experiment 1, here we paid subjects for every trial, in order to match the payment scheme with the learning task (see below for details).
4) All subjects were tested simultaneously in a social science experimental laboratory with many cubicles with computer terminals for each individual rather than individually as in Experiment 1.
In this experiment, subjects were paid a fixed amount for their participation ($10) in addition to a variable amount based on their performance in all four tasks (simple and complex versions of the explicit and learning tasks). Prior to each phase, subjects were familiarized with each task through 10 practice trials.
LEARNING TASK WITH POST-DECISION WAGERING
Subjects were given a $2000 loan of play money in the begin-ning and told that their goal was simply to earn as much play money as possible. In each trial, four decks with different col-ored symbols were presented on the display (Figure 1A). Subjects clicked on one of the decks using a mouse. After selecting a card, they wagered either $50 or $25 by clicking on the upper or lower half of the flipped card, respectively. After wagering, the payoff
of the selected card was displayed as a multiplier for the wagered amount (X WAGER). For example, if a subject wagered $50 and got aX(−2) payoff, they would lose $100 in that trial. Note that the final outcome (i.e., loss of $100) was not shown to the subjects. At the time of the payoff, the positive multiplier was associated with a happy icon and a positive laughter sound (070-who2.wav1) while the negative multiplier was associated with a sad icon and an obnoxious sound of shattered glass (truckcollide.wav2).
We randomized the spatial positions of the decks in each trial, thus forcing subjects to learn solely about the association between their appearance and their payoff. To encourage quick decisions relying on gut feelings, we instructed subjects to respond within 1.5 s after the deck presentation. If they did not move the mouse within this time interval, we randomized the deck positions again (<5% of trials). If they moved the mouse to one of the decks but failed to click on it, we regarded the deck under the mouse cur-sor as their choice (<5% of trials). We did not impose any time pressure for wagering responses.
We employed two learning tasks differing in complexity. In the simple version of the task, the payoff was eitherX(+1) orX(−1;
Figure 1Cleft). The expected payoff was positive (+0.6) for one deck and negative (−0.4) for the other three decks. In the com-plex version of the task (Figure 1Cright), the possible payoffs wereX(+2),X(+1),X(−1), andX(−2). The expected payoff was positive (+0.6) for two decks and negative (−0.6) for the other two decks. In the complex version, one positive, and one nega-tive deck had high variance (2.44) and the others had low variance (1.84). We refer to positive (or negative) decks as “good” (or “bad”) decks.
The theoretical expected earnings over 100 trials with random deck choice are $-281.25 for the simple version and $0 for the complex version. In Experiment 1, subjects earned $781±474 (mean±SD) in the simple version and $747±346 in the complex version, and in Experiment 2, subjects earned $345±347 in the simple version and $891±408 in the complex version, confirm-ing that subjects performed well above-chance (p<10−6for both
versions in both experiments, one-tailedt-test).
Subjects were told that the optimal strategy is (1) to initially explore the four decks while wagering $25 and (2) to exploit the good deck while wagering $50 once they notice which deck is most likely to give a positive payoff. 35 out of 36 subjects discovered the good deck and then repeatedly chose from it (Figure 2A)3. After six to eight consecutive choices from a good deck, we showed a text message, “Game Restarted,” on the dis-play to notify the subject that the deck-reward contingencies were reassigned and that the subject should explore again (red bars
inFigure 2A). The number of consecutive choices required for
each reassignment was randomly chosen from six to eight to reduce subjects’ anticipation for the next reassignment and to have sufficient trials to observe the evolution of wagering behavior (Figure 2B).
1http://www.moviewavs.com/ 2http://download848.mediafire.com/
3We observed one subject who purposely chose from a bad deck every few trials. This
subject told us after the experiment that he tried to beat our game by occasionally selecting a bad deck after selecting the good deck a few times in a row.
FIGURE 2 | Results from one subject in the complex learning task. (A)The history of card selection. Initially, the subject sampled from four decks, then discovered the good deck and stuck with this deck until the reshuffle (red vertical bars). Small red arrows indicate the trial where the subject started to choose from the good deck consistently, which we define as “the onset of good deck choice.” The red circles indicate the trials where the subject received a negative payoff.(B)The history of actual wagering (red) and the predicted probability of a high wager based on the explicit task results (blue).(C)The Bayesian probability for an objectively good deck [the good deck in the upper row in(A)] being a good deck. As the evidence accumulates, this probability updates from 0.5 (the Bayesian prior). It increases when this good deck is selected with a positive outcome or when other decks are selected with a negative outcome.(D)The aligned results of nine onsets of consecutive good deck selection from this subject. The probability of good deck selection (black) and wagering high (red) are aligned at the onsets (shown as the red arrow). The green line is the Bayesian probability of the chosen deck being a good deck.
EXPLICIT RISK AVERSION TASK
To measure each subject’s risk aversion, we employed a standard technique from experimental economics. In each trial, we showed two or four pie charts for the simple or the complex version of the risk aversion task, respectively (Figure 1B). These pie charts are identical to the payoff distribution charts from the instructions for the learning task (Figure 1C). The goal was to mimic the infor-mation structure from the learning task as closely as possible in order to maximize the predictive power of the risk aversion model
from one task to the other. During the wagering stage, the learning task can be thought of as being equivalent to the risk aversion task, except that in the learning task the subjects estimate the probabili-ties (indicated explicitly here in yellow inFigure 1B) based on their previous card draws. For example, in the simple version of the risk aversion task, if the good and bad decks have explicitly stated prob-abilities of 70% and 30% respectively, this would correspond to a situation in the learning task, where the subject draws a card from a deck they believe to be good and is (subjectively) 70% sure that the chosen deck is good (a good deck is a deck with positive expected payoff). In reality, its unlikely that subjects assign explicit proba-bilities to the decks in the learning task. But they may behave “as if ” they are tracking the Bayesian probabilities (Hampton et al., 2006). The probabilities assigned to the pie charts in the explicit task ranged from 0.25 to 0.70 for the simple version and from 0.35 to 0.85 for the complex version. There was no time restriction. The order of the simple and complex versions was randomized across subjects. In this explicit task, the subjects’ goal was again to maximize their payoff.
In Experiment 1 and 2, we implemented two ways of payment in this explicit task. In Experiment 1, we randomly picked one of the 150 trials from the explicit tasks (combining simple and complex versions), selected one of the pie charts according to their proba-bilities, then selected one of the possible payoffs from that pie chart according to the probabilities in the chart, and finally multiplied the chosen payoff by the subject’s wager. Subjects were shown this procedure on the display animation and understood this proce-dure during practice sessions for both versions of the explicit task. In Experiment 2, we gave subjects a $2000 loan of play money in the beginning and we told them that the goal was simply to earn as much play money as possible. We gave trial-by-trial feedback (with the same sound and icon as in the learning task), accumulated the total amount of play money and paid subjects the amount they earned which was divided by 2000.
BAYESIAN UPDATING TO ESTIMATE SUBJECTIVE PROBABILITY
We computed the Bayesian probability of the chosen deck being the good deck using a Bayesian model (Figure 2C). Briefly, this model computes the probability of each deck being the good deck, given the distribution of payoffs from each type of deck (good or bad) and the actual history of positive and negative payoffs to the subject. The probabilities for all four decks were updated after each choice. We describe the details of our Bayesian model and assess how well our assumptions are justified in the Appendix.
The Bayesian model of learning that we used was chosen for its simplicity and descriptive power in other learning research (Ghahramani, 2001; Daw et al., 2005; Hampton et al., 2006;
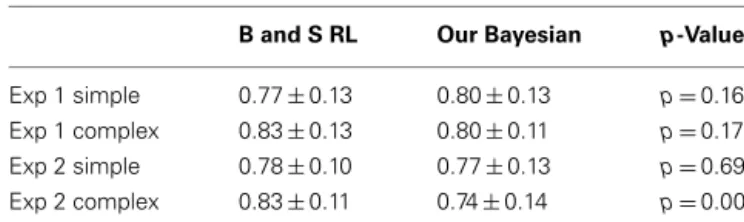
Brodersen et al., 2008). We compared our Bayesian model with the prevailing cognitive models (Busemeyer and Stout, 2002), includ-ing a variant of reinforcement learninclud-ing, and showed that our model is superior in predicting choices and wagers. We describe the details of the model comparison in the Appendix.
PREDICTING WAGERING BEHAVIOR IN THE LEARNING TASK AND DATA FITTING
In the explicit task, the probability of subjects wagering high increases with the probability for the good deck in a sigmoidal
manner (Figures 3C,D,G,H, blue curves). Combining this psycho-metric function in the explicit task with the Bayesian probabilities computed in each trial, we tried to predict the probability of a high wager in the learning trials. If the subjects were learning the probabilities like Bayesians (even roughly) then their choice char-acteristics in the explicit risk aversion task should help predict their wagering behavior in the learning task.
We used local regression to obtain smooth psychometric curves shown inFigures 3C,D,G,Hand4G,H. We used the Locfit pack-age (Loader, 1999) included in the Chronux Toolbox4(Mitra and Bokil, 2008) in MATLAB. We used a Gaussian kernel and a bino-mial local likelihood fitting family. To stabilize the fit, we defined the probability of a high wager as 0 at a good deck probability of 0. For each subject, we optimized the smoothing width using a cross-validation method by (1) randomly dividing the dataset into halves, a training and a test data set, (2) obtaining the best fit to the training set for each of the different smoothing widths, and (3) computing the squared difference between the fitted curve and the actual data from the test set, which was not used during curve fitting. We repeated the above cross-validation procedure 10 times and chose the smoothing width that minimized the overall error for the test set. ForFigures 3C,D,G,H, we averaged the derived smoothed curves across subjects.
RISK AVERSION INDEX AND RISK-SENSITIVITY INDEX
We defined a risk aversion index (RAI) as the point (x-axis in
Figures 3C,D,G,H) where the probability of a high wager (y-axis) reaches 0.5. We derived the RAI from the fitted curve for each sub-ject. We also defined a risk-sensitivity index (RSI) as the steepness of the fitted curve as follows:
RSI=
(Probability of high wager atp=0.75)
−(Probability of high wager atp=0.25) 0.75−0.25
Due to the nature of the task and noise in the learning task, tra-ditional models of risk aversion (Kahneman and Tversky, 1979;
Rabin, 2000; Holt and Laury, 2002) did not fit the data well. Our measures of risk aversion are simple but do a better job of characterizing subjects’ risk aversion, as demonstrated by the high within-subject correlations between the simple and complex ver-sions of the explicit tasks as well as those of the learning tasks (see Results).
RESULTS
LEARNING TASK WITH POST-DECISION WAGERING
In our novel learning task, the deck-payoff contingency switched after subjects repeatedly selected cards from a deck with posi-tive expected value (a “good” deck). In each trial, subjects first selected a card from one of four decks, and then wagered either $50 or $25. Immediately after wagering, subjects saw their pay-off as a multiplier of the wager amount, that is, eitherX(+2),
X(+1),X(−1), orX(−2). The total amount of the payoff (i.e., the wagered amount times the multiplier) was not shown explicitly on the display (Figure 1A).
4http://chronux.org/
We show a typical subject’s behavior for deck selection and wagering inFigures 2A,B. Initially, the subject sampled from sev-eral decks, then settled on the good deck. He stuck with this deck until the reshuffle. As for wagering, he started off wagering low but eventually wagered high after several selections from the good deck (red line). After the reshuffle, he returned to wagering low. Interest-ingly, his actual wagering behavior lagged behind his theoretically predicted wagering behavior (blue line), which incorporated his risk aversion as measured in the explicit task (see below). This lag is consistent with non-conscious optimal choice, and we will return to this point later.
To analyze when subjects started to wager high, inFigures 2D
and3A,B,E,F, we aligned card selection and wagering to the onset of good deck selection.Figure 2Dshows that the exemplar subject never wagered high (the red line) before he found the good deck. On subsequent draws from the good deck, the subject increasingly wagered high, and by the sixth card the subject was always wager-ing high.Figures 3A,B(Experiment 1,n=16) andFigures 3E,F
(Experiment 2, n=20) show similar trends at the group level in both the simple and complex versions of the learning task in both experiments. Subjects wagered high (the red lines) on less than 100% of the trials even after repeatedly choosing from the good deck (up to seven cards after the onset of good deck selection).
This alone does not yet prove that subjects were choosing the advantageous good deck(s) without conscious awareness; it merely suggests that subjects needed to build up to a certain level of confi-dence in their selection before making a high wager. We therefore used a Bayesian model to estimate subjects’ beliefs about which decks were the good ones and then used those beliefs to predict the subjects’ wagering behavior. The model’s prediction was based on the past history of outcomes for the subjects as well as their risk aversion.
EXPLICITLY MEASURING RISK AVERSION
To measure risk aversion, we asked subjects to wager $50 or $25 in a situation where the probability of the chosen deck being good or bad wasexplicitlyavailable (the explicit risk aversion task,
Figure 1B). Note that in the learning task (Figure 1A), subjects might never have had an explicit representation of this probabil-ity, even if they computed it implicitly in order to guide choice and wagering.
The resulting psychometric curves for high wagers in the explicit task are shown by the blue curves inFigures 3C,D,G,H. As an example, for the simple version of the explicit task in Experi-ment1, subjects wagered high more than 90% of the time when the probability of being a good deck exceeded 0.65. They wagered high only 50% of the time when the explicit probability of being a good deck was 0.55, consistent with published risk aversion results from experimental economics (Kahneman and Tversky, 1979;Rabin, 2000;Holt and Laury, 2002).
We then analyzed how often subjects wagered high in the learn-ing task as a function of the Bayesian probability of the chosen deck being the good one (Figures 3C,D,G,H, red curves). When making their wagering decisions in the learning task, subjects’ psychome-tric curves shifted to the right, suggesting that they became more risk-averse. Furthermore, the curves became flatter, suggesting that
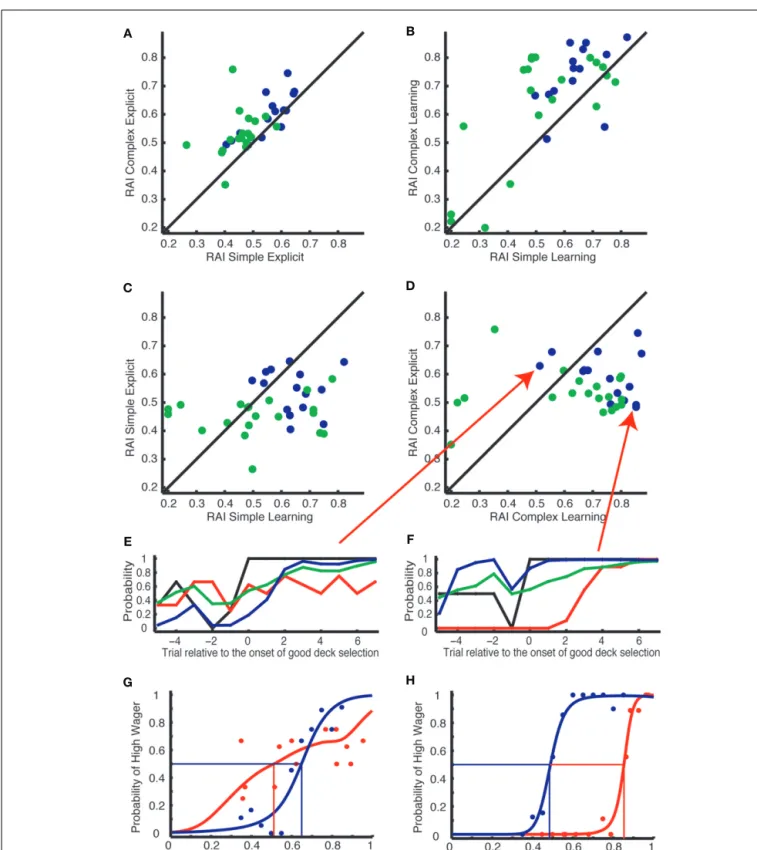
FIGURE 3 | Wagering behavior in the learning task cannot be completely accounted for by the risk aversion measured in the explicit task [(A–D): Experiment 1; (E–H): Experiment 2]. (A,B,E,F)The actual probability of a high wager (red) is aligned across multiple onsets of good deck selection [(A,E)for the simple version and(B,F)for the complex version of the learning task]. The x-axis denotes the trial relative to the onset of good deck selection. The probability of good deck selection (black) as well as the predicted probability of a high wager (based on the explicit task; blue) are also aligned at the onset
of good deck selection. The black vertical bars indicate a significant difference between the predicted and actual probability of a high wager. *, **, and *** indicate significance levels ofp<0.05,p<0.01, andp<0.001, respectively. (C,D,G,H)The probability of a high wager as a function of the explicit probability in the risk aversion task (blue) and as a function of the Bayesian probability in the learning task (red) for the simple(C,G)and for the complex (D,H)versions of the tasks. The curves are obtained by averaging individually fitted curves using local regression. Shading denotes 1 SEM across subjects.
FIGURE 4 | Subject-specific risk aversion indices (RAI) are correlated between the simple and complex versions of the tasks, but not between the explicit and learning tasks.(A,B)RAI was highly correlated between the simple (x-axis) and complex (y-axis) versions within the explicit tasks(A)and within the learning tasks(B).(C,D)RAI was uncorrelated across the learning (x-axis) and the explicit task (y-axis) in either the simple(C)or the complex
(D)versions. Blue dots represent subjects from Experiment 1 and green dots represent subjects from Experiment 2.(E–H)The results from two exemplar subjects indicated by the red arrows in(D). Their behaviors are presented in the same format as inFigures 3A–D.(E,G)A subject who preferred to wager high in the learning but not in the explicit task.(F,H)A subject who showed extreme risk aversion only in the learning task.
subjects were less sensitive to the payoffs during the learning task. To quantify these effects, we computed two indices for each sub-ject: a RAI and a RSI. RAI represents the explicit probability of the deck being “good” at which subjects wagered high in 50% of the trials. RAI approaches 1 if subjects are risk-averse (i.e., those who wager high only when they are sure to win). If subjects are risk-neutral, RAI is 0.45 (due to the negative expected payoffs for the random choice strategy) for the simple and 0.5 for the complex versions of the task. In Experiment 1 (Figures 3C,D), RAI was higher in the learning tasks (RAI=0.633 for the simple and 0.775 for the complex) than in the explicit risk aversion tasks (RAI=0.548 for the simple and 0.576 for the complex, pairedt -test,p=0.007 for the simple, andp=0.002 for the complex). In Experiment 2 (Figures 3G,H), for the complex version, RAI was higher in the learning tasks (RAI=0.702) than in the explicit tasks (RAI=0.520,p=0.045). For the simple version, RAI in the learn-ing task (0.476) was not different from that in the explicit task (RAI=0.467,p=0.15). RSI is the slope of the curve, representing the sensitivity to the change in probability. In Experiment 1, RSI was smaller in the learning tasks (RSI=1.12 for the simple and 0.70 for the complex) than in the explicit tasks (RSI=1.97 for the simple and 1.78 for the complex, pairedt-test,p<10−5for both the simple and the complex versions). In Experiment 2, RSI was also smaller in the learning tasks (RAI=1.06 for the simple and 0.949 for the complex) than in the explicit tasks (RAI=1.87 for the simple and 1.83 for the complex,p<10−4for both the simple and the complex versions).
Overall, the results from Experiment 1 and 2 were consis-tent although there was some difference in the simple version of the task. RAI in both the learning and explicit task was signifi-cantly lower in Experiment 2 than Experiment 1 (unpairedt-test, p=0.016 for the learning andp<0.001 for the explicit task; see Discussion). The RSI was not significantly different between the two experiments.
Looking atFigure 3Cmore closely, in the explicit task sub-jects wagered high in 100% of the trials where the probability of choosing from the good deck was 70%. However, in the learning task they wagered high in less than 65% of the trials where the Bayesian probability was at the same level. Our analysis reveals that this phenomenon is a combined effect of lower RSI (i.e., flat-ter psychometric curves) indicating an insensitivity to the payoffs, and higher RAI (i.e., rightward shift of the curves) indicating that subjects were more risk-averse during the learning task than the explicit task.
THE DELAYED ONSET OF AWARENESS COMPARED TO THE ONSET OF GOOD CARD CHOICE
We predicted the probability of a high wager for each trial in the learning task based on the actual payoff history in the learn-ing task and the risk aversion profile in the explicit task (as in
Figures 3C,D,G,H). First, we computed the Bayesian probability
for each trial based on the history of payoffs (Figure 2C). Then, we derived the probability of a high wager by drawing a vertical line from the Bayesian probability (on thex-axis) in the risk aversion sigmoidal curve and finding the correspondingy-value. This was repeated for each trial (Figure 2B, blue curve). If there is a period of non-conscious decision making, we should see a gap between
the actual and the predicted probability of high wagers even after taking into account each subject’s risk aversion.
InFigures 3A,B,E,F, the blue curves show the proportion of tri-als in which subjects would have wagered high if they had explicitly been shown the Bayesian probability that they were choosing from the good deck. We see that subjects wagered high much less fre-quently in the actual gambling task (red) than predicted based on risk aversion and the Bayesian probabilities (blue). In both experi-ments, the gaps between the two curves were significantly different at most points: in Experiment 1 for the simple version,p<0.05 for points from+1 to+5,p=0.055 for+6, andp=0.088 for+7; for the complex,p<0.05 for all the points after 0, and in Exper-iment 2 for the simple,p<0.05 for points from+1 to+7 except
+5 (p=0.069); for the complex,p<0.05 for all the points from 0 to+6, andp=0.062 for+7; two-tailed pairedt-test, corrected for multiple comparisons for trial 0 to trial+7 with false discovery rate (FDR) of 0.05 (Benjamini and Hochberg, 1995).
Thus, even when we take into account the effects of risk aversion, we still find that subjects did not wager optimally. We conclude that we cannot fully explain the gap between choosing optimally and wagering high (Bechara et al., 1997;Persaud et al., 2007) based solely on risk aversion (Clifford et al., 2008a;Schurger and Sher, 2008;Dienes and Seth, 2010).
RISK AVERSION IN THE LEARNING TASK IS UNCORRELATED WITH THAT MEASURED IN THE EXPLICIT TASK
Even if risk aversion does not completely account for behavior in the learning task, we would expect to see a correlation between risk aversion measures in the two tasks, since it is generally assumed that risk aversion is an individual personality trait that should be fairly stable across tasks, especially over short periods of time (Harrison et al., 2005;Koch and Preuschoff, 2007). To check this assumption, we ran a correlation analysis on the risk aversion measures.
Within-subject RAIs were highly correlated between two lev-els of payoff complexity within the explicit tasks for Experi-ment 1 (Figure 4A, blue dots, Spearman correlation test:ρ=0.81, p=0.00022) and for Experiment 2 (green dots, ρ=0.58, p=0.01). This was also true within the learning tasks for Exper-iment 1 (Figure 4B, blue dots,ρ=0.6, p=0.024) and Experi-ment 2 (green dots,ρ=0.5,p=0.026). When we combined data from both Experiment 1 and 2, we found strong correlations within the explicit (ρ=0.72, p=1.2×10⁻⁶) and the learning tasks (ρ=0.5,p=0.0028). This reliable correlation is consistent with the assumption that risk aversion is a fixed factor specific to each subject. However, within-subject RAIs across the learning and the explicit tasks were uncorrelated in both levels of task complex-ity. Within the simple version, the correlation coefficient (ρ) was
−0.24 (p=0.39) in Experiment 1, 0.021 (p=0.93) in Experiment 2 and 0.19 (p=0.28) when we combined the data from Experi-ment 1 and 2 to increase statistical power (seeFigure 4C). Within the complex version, we again found no correlation between the tasks (ρ= −0.28, p=0.31 for Experiment 1; ρ= −0.074, p=0.76 for Experiment 2; ρ= −0.15, p=0.39 for combined;
seeFigure 4D). We show exemplar subjects who showed
strik-ing inconsistency between the learnstrik-ing and the explicit tasks in
MEAN CHOICE-WAGER GAP IN THE LEARNING TASK IS UNCORRELATED WITH RAI MEASURED IN THE EXPLICIT TASK
To verify that risk aversion is uncorrelated between tasks, we further analyzed the correlation between RAI estimated from the explicit task (50% crossing points of the blue curves in
Figures 3C,D,G,H) and mean choice-wager gap from the learning
task (i.e., the mean difference between black and red curves from 0 to+7 inFigure 2D). RAI from the explicit task did not correlate with the mean choice-wager gap in the simple (ρ=0.021,p=0.94) or complex version (ρ= −0.13,p=0.65) of Experiment 1 nor in the simple (ρ=0.18,p=0.45) or complex version (ρ=0.23, p=0.34) of Experiment 2.
We also analyzed the correlation between RAI and mean choice-wager gap both estimated from the learning task. Within the learning task, RAI was correlated with the mean choice-wager gap in the simple (ρ=0.55, p=0.034) and the complex ver-sion (ρ=0.83, p=0.00012) of Experiment 1 as well as in the simple (ρ=0.54,p=0.014) and the complex version (ρ=0.48, p=0.033) of Experiment 2.
Taken together, the gap between actual choice and wagering behavior in the learning task was not correlated with risk aversion estimated from the explicit task, while it was correlated with the risk aversion estimated from the learning task. This is consistent with the results presented inFigure 4.
COMPARISON BETWEEN THE SIMPLE AND COMPLEX VERSION OF THE TASK
We used a simple and a complex version of the task to allow easy or more difficult conscious access to the contingencies between decks and their expected outcomes (seeFigure 1Cand Materials and Methods for details). We expected to observe an increased period of non-conscious decision making in the complex version as the complexity of the payoff histories exceeds the capacity of con-scious working memory (Bechara et al., 1997;Dijksterhuis et al., 2006). When we aligned all the variables at the onset of good deck selection (Figures 3A,B,E,F), the difference between the predicted and the actual probability of high wagers (i.e., the gap between the blue and red curves from trial 0 to+7) was larger in the complex version than in the simple version (p=0.0075 for Experiment 1 andp=0.0013 for Experiment 2). This is consistent with the idea that non-conscious decision making is likely to be induced when the task is more complex.
DISCUSSION
The original IGT has been cited as evidence for non-conscious decision making. However, due to its unconstrained nature, there may be alternative explanations other than non-conscious decision making. Here we reported evidence that casts doubt on several of those alternative explanations. To exclude explanations due to risk aversion and ambiguity aversion (Fellows, 2004; Dunn et al., 2006;Koch and Preuschoff, 2007;Clifford et al., 2008a,b;
Schurger and Sher, 2008; Dienes and Seth, 2010; Fleming and Dolan, 2010; Sandberg et al., 2010), we modified the original IGT in several respects. In particular, we showed that risk aver-sion could not explain the entire effect of non-conscious deciaver-sion making in our task. Furthermore, we found that risk aversion observed during the learning task was not correlated with risk
aversion elicited during a similar gambling task with explicit probabilities. We suggest that these two types of risk aversion may map onto an emotional feeling of risk on the one hand, and an explicitly accessible representation of risk on the other hand.
In our learning tasks, subjects were able to discover the good decks and stick with them. However, as inPersaud et al. (2007), we found that it generally took several choice–outcome experi-ences from a good deck before subjects were willing to place high wagers on the outcomes. Interestingly, some subjects con-tinued to wager low even after selecting from the good deck six to eight trials in a row. The reason for this reluctance to wager high could be that subjects were unaware of the deck-reward contin-gencies and selected cards using non-conscious decision making (Bechara et al., 1997;Persaud et al., 2007). Alternatively, subjects may have been risk-averse and not willing to wager high until they were confident enough that they were choosing from the good deck (Clifford et al., 2008a;Schurger and Sher, 2008). What we found partially supports both explanations: subjects showed strong risk aversion in our modified version of the IGT, that is, they showed RAI values significantly larger than risk-neutral in all the learning tasks except the simple version in Experiment 2. However, this did not account for all of the temporal gap between the onsets of optimal choice and advantageous wagering in the experiments. We conclude that people can choose advanta-geously without full awareness of why they do so, at least to some extent.
By carrying out two independent experiments on two pools of naïve subjects (n=16 and 20), we replicated most of the findings. With two different experiments, we ruled out some of the potential artifacts, including the effects of (1) the extent of prior practice, (2) the order of the learning and explicit risk aver-sion task, (3) the presence of trial-by-trial feedback and payment, and (4) the testing environment (one-to-one experiment typical of psychophysics experiments and group experiments typical of experimental economics).
While most effects between the two experiments were sim-ilar, we observed two differences in the simple version of the task. First, in both the learning and the explicit task, the RAI was lower for Experiment 2 than Experiment 1. The lower lev-els of risk aversion in Experiment 2 would be expected when paying subjects for many trials rather than one, but we can-not rule out the possibility that the other experimental changes played a role as well. Second, the RAI was not different between the explicit and learning tasks in the simple version in Experi-ment 2 (Figure 3G). This could be because the simple version of the task itself may not be optimal to induce the effects that we were looking for. This interpretation is consistent with past studies (Bechara et al., 1997;Dijksterhuis et al., 2006), suggesting that evidence for non-conscious decision making is more evident in complex tasks where subjects rely less on conscious working memory.
NON-CONSCIOUS DECISION MAKING AND POST-DECISION WAGERING
In this study, we applied post-decision wagering to assess if advan-tageous decision making can occur non-consciously. While our wagering procedure asked subjects to simply bet high or low,
we do not believe that subjects’ confidence level is all or noth-ing, as is sometimes assumed in perceptual consciousness. In fact, we believe that confidence is graded and more or less continu-ous on a trial-by-trial basis, which is the basis of our Bayesian model.
Over the last decades, convincing evidence for non-conscious processing has been established in at least two ways. First, while showing complete lack of detectability/discriminability (e.g., chance performance or d=0) of stimuli with a direct task that assesses awareness of the stimuli, robust non-conscious processing has been shown with indirect measures, such as behavioral priming effects and neurophysiological signals (for a review, seeHannula et al., 2005;Kouider and Dehaene, 2007). Second, above-chance behavioral performance can be considered to be non-consciously mediated if the level of conscious confidence, reported in a forced manner, is completely uncorrelated with performance (Kolb and Braun, 1995;Kunimoto et al., 2001;Persaud et al., 2007). Non-conscious processing in our task has been established via the second method with conscious confidence indirectly assessed with post-decision wagering.
Recently, the nature of post-decision wagering as a way to assess conscious confidence has been intensely debated (Koch and Preuschoff, 2007;Clifford et al., 2008a;Schurger and Sher, 2008;
Dienes and Seth, 2010;Fleming and Dolan, 2010;Sandberg et al., 2010). Some emphasize the advantage of post-decision wagering (Koch and Preuschoff, 2007;Persaud et al., 2007). It is highly intu-itive and easy to administer, even for children (Ruffman et al., 2001) or animals (Kornell et al., 2007;Kiani and Shadlen, 2009), compared to confidence ratings. As post-decision wagering indi-rectly assesses conscious confidence, it is less likely to alter task performance than direct confidence ratings, which might affect performance because it forces subjects to introspect in an unnat-ural way (Koch and Preuschoff, 2007). Furthermore, the monetary incentives ensure that subjects are motivated to reveal all the infor-mation they have for their advantageous decisions (Persaud et al., 2007).
Others have pointed out disadvantages with post-decision wagering (Clifford et al., 2008a;Schurger and Sher, 2008;Dienes and Seth, 2010;Fleming and Dolan, 2010;Sandberg et al., 2010). Post-decision wagering may be subject to economic context, which might influence conscious confidence. For example, risk aversion may lead to different wagering behavior even when the underlying conscious confidence is the same. In fact, using backward masking in sensory psychophysics,Fleming and Dolan (2010)showed that risk aversion discouraged high wagers. Furthermore, Sandberg et al. (2010)have suggested that other meta-cognitive measures such as a perceptual awareness scale could improve our ability to detect weak conscious confidence.
In our study, we chose post-decision wagering for the assess-ment of conscious confidence because we can use the same wager-ing task durwager-ing both learnwager-ing and explicit risk aversion tasks and we can directly examine the role of risk aversion on an individ-ual basis across two very similar tasks. Future work is needed to see whether non-conscious, advantageous decision making can be confirmed with other methods, such as allowing subjects to bet on a continuous scale rather than just high or low.
ADVANTAGES OF OUR MODIFIED VERSION OF THE IGT
It has been argued that the task design of the IGT confounds several factors known to play an important role in decision making (Fellows, 2004; Sanfey and Cohen, 2004; Dunn et al., 2006), which undermined previous attempts to demonstrate non-conscious decision making. We sought to avoid these confounds by modifying the original IGT in several important ways. First, we incorporated post-decision wagering to indirectly measure sub-jects’ conscious awareness of the deck-payoff contingency in every trial (Persaud et al., 2007). Second, we introduced a reshuffling procedure to observe multiple episodes of learning and choice within a single subject, resulting in greater statistical power. Such a feature is desirable not only for behavioral studies like ours, but also for neurophysiological experiments (Fukui et al., 2005;
Oya et al., 2005). In fact, despite its wide application in behav-ioral studies, the IGT, which can induce at most a single onset of awareness, has been used only in a few imaging studies in good part due to this statistical limitation. Third, we addressed the concern about heterogeneous priors on the task structure by explicitly telling the subjects the distributions of payoffs from the four decks and letting them practice the task. This also helped to eliminate the effects of ambiguity aversion, which have been shown to cause subjects to avoid gambles with unknown prob-abilities (Ellsberg, 1963;Camerer and Weber, 1992; Rode et al., 1999; Hsu et al., 2005). This improvement was also critical for our Bayesian modeling analysis. If subjects did not know anything about the task structure we could still have used a reinforcement learning algorithm (Oya et al., 2005), but it is unclear how to com-bine such a model with risk aversion (Bossaerts et al., 2008). In fact, the model comparison (see Appendix) suggests that our Bayesian model with knowledge of the task structure performs better in predicting subjects’ behavior than the one without this knowledge and other related reinforcement learning models (Busemeyer and Stout, 2002).
In fairness to alternative explanations, our experiment did not explicitly measure subjects’ beliefs about the different deck prob-abilities, and so we cannot rule out the possibility that subjects’ beliefs were non-Bayesian. Although our novel gambling task elim-inated ambiguity about the task structure, subjects still had to learn and estimate the probabilities of selecting from a good deck and were thus facing compound lotteries with potentially inaccurate probabilities. In the learning task, there is the potential for indi-vidual differences in learning rates, in differential memory for positive versus negative payoffs, in ability to keep the payoff distri-butions described in the instructions in working memory, and in the discounting of past outcomes, etc. These individual differences would have only affected the learning task but not the explicit task, which could account for the divergence in risk aversion between the tasks. We did observe that the psychometric curves relating the probability of a high wager to the probability of being a good deck (Figures 3C,D,G,H) were flatter in the learning than in the explicit tasks. Though we described it as evidence that subjects become less risk sensitive, alternative accounts are also possible. In the learning task, inaccurate estimation of the probabilities could result in an observed insensitivity to risk. Further experiments will be needed to address these issues.
MULTIPLE MECHANISMS FOR DECISION MAKING UNDER RISK
The behavioral and neural correlates of decision making under risk have been extensively investigated and it has been shown that components of risk, such as variance of probability and reward, influence the activity of midbrain dopamine neurons as well as the activation of ventral prefrontal, insular, and cin-gulate cortices (Bechara et al., 1999; Critchley et al., 2001;
Smith et al., 2002; Fiorillo et al., 2003; Tobler et al., 2007;
Christopoulos et al., 2009). Interestingly, Huettel et al. (2006)
have argued that decision making under risk and under ambi-guity are supported by distinct mechanisms, with risk preference encoded in the posterior parietal cortex and ambiguity pref-erence encoded in the lateral prefrontal cortex. In our study, we did not observe significant correlation between risk aver-sion in the learning and explicit tasks. It is even more intriguing because the tasks were so similar and they were done in the same session, with very similar stimuli and identical payoffs. Impor-tantly, the high correlations of risk aversion between the simple and complex versions of the task within each of the learning and the explicit task ruled out that the non-significant corre-lations were due to subjects’ confusion, or a lack of statistical power.
Inconsistency between risk aversion in the learning and the explicit tasks (Figure 4) suggests the possibility of two separable psychological processes for the computation of risk: one process may depend on an explicit and verbally accessible representation of risk (since this is how the risk information was provided in the first place), while the other process may depend on an emo-tional feeling of risk based on experienced outcomes that need not be accessible to explicit verbal report (Loewenstein et al., 2001). Our findings suggest a description–experience gap between risk in explicit and implicit tasks. Recently, some studies have demon-strated this description–experience gap.FitzGerald et al. (2010)
showed that the risk of learned options is correlated with activity in the anterior cingulate cortex while the risk of described options is correlated with activity in the bilateral anterior insula cortices.
Erev et al. (2010)found that decisions from description were pre-dicted best by different models than those that prepre-dicted decisions from experience.
Distinctive processes for risk computation have been suggested in recent studies in normal subjects (Hertwig and Erev, 2009), as well as with lesion patients and psychiatric populations. When normal subjects learn probabilities from experience, they can show a reversed risk preference compared to when they are notified of the risk through description of the probabilities (Hertwig and Erev, 2009). Patients with damage to the ventromedial prefrontal
cortex can cognitively assess appropriate behaviors but cannot act accordingly in real life, a dissociation which is in part repli-cated in the IGT (Anderson et al., 1999; Krajbich et al., 2009). Pathological gamblers are obsessed by risky gambles (Holden, 2001; Potenza et al., 2001). With some drug treatments, their risk aversion can be enhanced to a level higher than in healthy controls (Brañas-Garza et al., 2007), however, their pathologi-cal behaviors are prone to relapse in real life (Holden, 2001). Interestingly, these clinical populations are capable of comput-ing risks cognitively. However, they fail to choose appropriately in everyday life, possibly because of an inability to implement risk mechanisms based on emotional feelings (Loewenstein et al., 2001).
WhileDienes and Seth (2010)found correlation between risk aversion and the degree of non-conscious knowledge inferred from wagering, we did not get an analogous result. We believe that our two separate risk models described above could explain this dis-cordance. For tasks that do not involve learning and emotional feeling of risks, such as those employed by Dienes and Seth, the explicit risk mechanism is likely at work. Obviously, further studies are needed to test these ideas.
Taken together with these other results, the present findings suggest that these two processes for risk computation may be subserved by distinctive neuronal mechanisms within the pre-frontal cortex (Tobler et al., 2007; Christopoulos et al., 2009), posterior cingulate cortex (McCoy and Platt, 2005), and insula or components of the basal ganglia (Preuschoff et al., 2006). Whether emotional experiences (Damasio, 1994; Bechara et al., 1997, 2000) guide subjects in our learning task in a non-conscious manner is an important open question for future studies.
AUTHOR CONTRIBUTIONS
Shuo Wang, Ian Krajbich, Ralph Adolphs, and Naotsugu Tsuchiya designed research; Shuo Wang performed research; Shuo Wang, Ian Krajbich and Naotsugu Tsuchiya analyzed data; and Shuo Wang, Ian Krajbich, Ralph Adolphs, and Naotsugu Tsuchiya wrote the paper.
ACKNOWLEDGMENTS
We thank C. Camerer and four reviewers for valuable comments. This work has been supported by grants from the Gordon and Betty Moore Foundation and the National Science Foundation to Ralph Adolphs. Naotsugu Tsuchiya thanks the Japan Society for the Promotion of Science and Japan Science and Technology Agency for their support.
REFERENCES
Anderson, S. W., Bechara, A., sio, H., Tranel, D., and Dama-sio, A. R. (1999). Impairment of social and moral behaviour related to early damage in human pre-frontal cortex. Nat. Neurosci. 2, 1032–1037.
Bechara, A., Damasio, A. R., Dama-sio, H., and Anderso, S. W. (1994).
Insensitivity to future consequences following damage to human pre-frontal cortex.Cognition50, 7–15. Bechara, A., Damasio, H., and
Dama-sio, A. R. (2000). Emotion, decision making and the orbitofrontal cortex.
Cereb. Cortex10, 295–307. Bechara, A., Damasio, H., Damasio, A.
R., and Lee, G. P. (1999). Different contributions of the human
amygdala and ventromedial pre-frontal cortex to decision-making.J. Neurosci.19, 5473–5481.
Bechara, A., Damasio, H., Tranel, D., and Damasio, A. R. (1997). Deciding advantageously before knowing the advantageous strategy.Science275, 1293–1295.
Bechara, A., Damasio, H., Tranel, D., and Damasio, A. R. (2005). The
Iowa Gambling Task and the somatic marker hypothesis: some questions and answers. Trends Cogn. Sci. (Regul. Ed.)9, 159–162.
Benjamini, Y., and Hochberg, Y. (1995). Controlling the false discovery rate: a practical and powerful approach to multiple testing. J. R. Stat. Soc. Series B Stat. Methodol. 57, 289–300.
Bossaerts, P., Preuschoff, K., and Hsu, M. (2008). “The neurobiological foundations of valuation in human decision making under uncertainty,” inNeuroeconomics: Decision Making and the Brain,eds P. W. Glimcher, E. Fehr, A. Rangel, C. Camerer, and R. A. Poldrack (New York: Elsevier), 351–364.
Brañas-Garza, P., Georgantzís, N., and Guillen, P. (2007). Direct and indi-rect effects of pathological gambling on risk attitudes.Judgm. Decis. Mak.
2, 126–136.
Brodersen, K. H., Penny, W. D., Har-rison, L. M., Daunizeau, J., Ruff, C. C., Duzel, E., Friston, K. J., and Stephan, K. E. (2008). Inte-grated Bayesian models of learning and decision making for saccadic eye movements. Neural Netw. 21, 1247–1260.
Busemeyer, J. R., and Stout, J. C. (2002). A contribution of cog-nitive decision models to clini-cal assessment: decomposing per-formance on the bechara gam-bling task. Psychol. Assess. 14, 253–262.
Camerer, C., and Weber, M. (1992). Recent developments in model-ing preferences: uncertainty and ambiguity. J. Risk Uncertain 5, 325–370.
Christopoulos, G. I., Tobler, P. N., Bossaerts, P., Dolan, R. J., and Schultz, W. (2009). Neural corre-lates of value, risk, and risk aver-sion contributing to deciaver-sion mak-ing under risk. J. Neurosci. 29, 12574–12583.
Clifford, C. W. G., Arabzadeh, E., and Harris, J. A. (2008a). Get-ting technical about awareness.
Trends Cogn. Sci. (Regul. Ed.)12, 54–58.
Clifford, C. W. G., Arabzadeh, E., and Harris, J. A. (2008b). A good bet to measure awareness?
Trends Cogn. Sci. (Regul. Ed.)12, 210–210.
Critchley, H. D., Mathias, C. J., and Dolan, R. J. (2001). Neural activ-ity in the human brain relat-ing to uncertainty and arousal during anticipation. Neuron 29, 537–545.
Damasio, A. R. (1994).Descartes’ Error: Emotion, Reason, and the Human Brain. New York: Grosset/Putnam. Daw, N. D., Niv, Y., and Dayan, P.
(2005). Uncertainty-based compe-tition between prefrontal and dor-solateral striatal systems for behav-ioral control. Nat. Neurosci. 8, 1704–1711.
Dienes, Z. N., and Seth, A. (2010). Gambling on the unconscious: a
comparison of wagering and confi-dence ratings as measures of aware-ness in an artificial grammar task.
Conscious. Cogn.19, 674–681. Dijksterhuis, A., Bos, M. W.,
Nord-gren, L. F., and van Baaren, R. B. (2006). On making the right choice: the deliberation-without-attention effect.Science311, 1005–1007. Dunn, B. D., Dalgleish, T., and
Lawrence, A. D. (2006). The somatic marker hypothesis: a critical eval-uation.Neurosci. Biobehav. Rev.30, 239–271.
Ellsberg, D. (1963). Risk, ambiguity, and the savage axioms: reply.Q. J. Econ.
77, 336–342.
Erev, I., Ert, E., Roth, A. E., Haruvy, E., Herzog, S. M., Hau, R., Her-twig, R., Stewart, T., West, R., and Lebiere, C. (2010). A choice prediction competition: choices from experience and from descrip-tion. J. Behav. Dec. Mak. 23, 15–47.
Fellows, L. K. (2004). The cognitive neu-roscience of human decision mak-ing: a review and conceptual frame-work.Behav. Cogn. Neurosci. Rev.3, 159–172.
Fiorillo, C. D., Tobler, P. N., and Schultz, W. (2003). Discrete coding of reward probability and uncer-tainty by dopamine neurons.Science
299, 1898–1902.
FitzGerald, T. H. B., Seymour, B., Bach, D. R., and Dolan, R. J. (2010). Differentiable neural sub-strates for learned and described value and risk. Curr. Biol. 20, 1823–1829.
Fleming, S. M., and Dolan, R. J. (2010). Effects of loss aversion on post-decision wagering: implications for measures of awareness.Conscious. Cogn.19, 352–363.
Fukui, H., Murai, T., Fukuyama, H., Hayashi, T., and Hanakawa, T. (2005). Functional activity related to risk anticipation dur-ing performance of the Iowa Gambling Task. Neuroimage 24, 253–259.
Ghahramani, Z. (2001). An introduc-tion to hidden Markov models and Bayesian networks.Intern. J. Pattern Recognit. Artif. Intell.15, 9–42. Hampton, A. N., Bossaerts, P., and
O’Doherty, J. P. (2006) The role of the ventromedial prefrontal cor-tex in abstract state-based inference during decision making in humans.
J. Neurosci.26, 8360–8367. Hannula, D. E., Simons, D. J., and
Cohen, N. J. (2005). Imaging implicit perception: promise and pitfalls. Nat. Rev. Neurosci. 6, 247–255.
Harrison, G. W., Johnson, E., McInnes, M. M., and Rutström, E. E. (2005). Temporal stability of estimates of risk aversion. Appl. Financ. Econ. Lett.1, 31–35.
Hertwig, R., and Erev, I. (2009). The description experience gap in risky choice.Trends Cogn. Sci.13, 517–523.
Holden, C. (2001). Addiction: ‘behav-ioral’ addictions: do they exist? Sci-ence294, 980–982.
Holt, C. A., and Laury, S. K. (2002). Risk aversion and incentive effects.Am. Econ. Rev.92, 1644–1655. Hsu, M., Bhatt, M., Adolphs, R., Tranel,
D., and Camerer, C. F. (2005). Neural systems responding to degrees of uncertainty in human decision-making.Science310, 1680–1683. Huettel, S. A., Stowe, C. J., Gordon,
E. M., Warner, B. T., and Platt, M. L. (2006). Neural signatures of eco-nomic preferences for risk and ambi-guity.Neuron49, 765–775. Kahneman, D., and Tversky, A. (1979).
Prospect theory: an analysis of decision under risk. Econometrica
263–291.
Kiani, R., and Shadlen, M. N. (2009). Representation of confidence asso-ciated with a decision by neurons in the parietal cortex.Science 324, 759–764.
Koch, C., and Preuschoff, K. (2007). Betting the house on consciousness.
Nat. Neurosci.10, 140–141. Kolb, F. C., and Braun, J. (1995).
Blind-sight in normal observers. Nature
377, 336–338.
Kornell, N., Son, L. K., and Terrace, H. S. (2007). Transfer of metacognitive skills and hint seeking in monkeys.
Psychol. Sci.18, 64–71.
Kouider, S., and Dehaene, S. (2007). Levels of processing during non-conscious perception: a critical review of visual masking. Philos. Trans. R. Soc. Lond B Biol. Sci.362, 857–875.
Krajbich, I., Adolphs, R., Tranel, D., Denburg, N. L., and Camerer, C. F. (2009). Economic games quantify diminished sense of guilt in patients with damage to the prefrontal cor-tex.J. Neurosci.29, 2188–2192. Kunimoto, C., Miller, J., and Pashler,
H. (2001). Confidence and accu-racy of near-threshold discrimina-tion responses.Conscious. Cogn.10, 294–340.
Loader, C. (1999).Local Regression and Likelihood. New York: Springer. Loewenstein, G. F., Weber, E. U., Hsee,
C. K., and Welch, N. (2001). Risk as feelings.Psychol. Bull.127, 267–286. Maia, T. V., and McClelland, J. L. (2004). A reexamination of the evidence for
the somatic marker hypothesis: what participants really know in the Iowa Gambling task.Proc. Natl. Acad. Sci. U.S.A.101, 16075–16080. Maia, T. V., and McClelland, J. L.
(2005). The somatic marker hypoth-esis: still many questions but no answers: response to Bechara et al.
Trends Cogn. Sci. (Regul. Ed.) 9, 162–164.
McCoy, A. N., and Platt, M. L. (2005). Risk-sensitive neurons in macaque posterior cingulate cortex.Nat. Neu-rosci.8, 1220–1227.
Mitra, P., and Bokil, H. (2008).Observed Brain Dynamics. New York: Oxford University Press.
Oya, H., Adolphs, R., Kawasaki, H., Bechara, A., Damasio, A., and Howard, M. A. III. (2005). Elec-trophysiological correlates of reward prediction error recorded in the human prefrontal cortex.Proc. Natl. Acad. Sci. U.S.A.102, 8351–8356. Persaud, N., McLeod, P., and Cowey,
A. (2007). Post-decision wagering objectively measures awareness.Nat. Neurosci.10, 257–261.
Potenza, M. N., Kosten, T. R., and Roun-saville, B. J. (2001). Pathological gambling.JAMA286, 141–144. Preuschoff, K., Bossaerts, P., and Quartz,
S. R. (2006). Neural differentia-tion of expected reward and risk in human subcortical structures. Neu-ron51, 381–390.
Rabin, M. (2000). Risk aversion and expected-utility theory: a calibra-tion theorem. Econometrica 68, 1281–1292.
Rode, C., Cosmides, L., Hell, W., and Tooby, J. (1999). When and why do people avoid unknown probabil-ities in decisions under uncertainty? Testing some predictions from opti-mal foraging theory.Cognition 72, 269–304.
Ruffman, T., Garnham, W., Import, A., and Connolly, D. (2001). Does eye gaze indicate implicit knowledge of false belief? charting transitions in knowledge.J. Exp. Child. Psychol.80, 201–224.
Sandberg, K., Timmermans, B., Over-gaard, M., and Cleeremans, A. (2010). Measuring conscious-ness: is one measure better than the other? Conscious. Cogn. 19, 1069–1078.
Sanfey, A. G., and Cohen, J. D. (2004). Is knowing always feeling?Proc. Natl. Acad. Sci. U.S.A.101, 16709–16710. Schurger, A., and Sher, S. (2008).
Aware-ness, loss aversion, and post-decision wagering.Trends Cogn. Sci. (Regul. Ed.)12, 209–210.
Smith, K., Dickhaut, J., McCabe, K., and Pardo, J. V. (2002). Neuronal
substrates for choice under ambigu-ity, risk, gains, and losses.Manage. Sci.48, 711–718.
Stoerig, P., Zontanou, A., and Cowey, A. (2002). Aware or unaware: assess-ment of cortical blindness in four men and a monkey.Cereb. Cortex12, 565–574.
Tobler, P. N., O’Doherty, J. P., Dolan, R. J., and Schultz, W. (2007). Reward value coding distinct from risk attitude-related uncertainty coding
in human reward systems.J. Neuro-physiol.97, 1621–1632.
Tomb, I., Hauser, M., Deldin, P., and Caramazza, A. (2002). Do somatic markers mediate decisions on the gambling task? Nat. Neurosci. 5, 1103–1104.
Conflict of Interest Statement:The
authors declare that the research was conducted in the absence of any
commercial or financial relationships that could be construed as a potential conflict of interest.
Received: 13 October 2011; accepted: 09 February 2012; published online: 27 Feb-ruary 2012.
Citation: Wang S, Krajbich I, Adolphs R and Tsuchiya N (2012) The role of risk aversion in non-conscious deci-sion making. Front. Psychology3:50. doi: 10.3389/fpsyg.2012.00050
This article was submitted to Frontiers in Cognitive Science, a specialty of Frontiers in Psychology.
Copyright © 2012 Wang , Krajbich, Adolphs and Tsuchiya. This is an open-access article distributed under the terms of the Creative Commons Attribution Non Commercial License, which per-mits non-commercial use, distribution, and reproduction in other forums, pro-vided the original authors and source are credited.