econ
stor
www.econstor.eu
Der Open-Access-Publikationsserver der ZBW – Leibniz-Informationszentrum Wirtschaft
The Open Access Publication Server of the ZBW – Leibniz Information Centre for Economics
Nutzungsbedingungen:
Die ZBW räumt Ihnen als Nutzerin/Nutzer das unentgeltliche, räumlich unbeschränkte und zeitlich auf die Dauer des Schutzrechts beschränkte einfache Recht ein, das ausgewählte Werk im Rahmen der unter
→ http://www.econstor.eu/dspace/Nutzungsbedingungen nachzulesenden vollständigen Nutzungsbedingungen zu vervielfältigen, mit denen die Nutzerin/der Nutzer sich durch die erste Nutzung einverstanden erklärt.
Terms of use:
The ZBW grants you, the user, the non-exclusive right to use the selected work free of charge, territorially unrestricted and within the time limit of the term of the property rights according to the terms specified at
→ http://www.econstor.eu/dspace/Nutzungsbedingungen By the first use of the selected work the user agrees and declares to comply with these terms of use.
zbw
Gebel, Meike; Sibbertsen, Philipp
Working Paper
Recognizing mathematical talent : an
approach using discriminant analysis
Technical Report / Universität Dortmund, SFB 475 Komplexitätsreduktion in Multivariaten Datenstrukturen, No. 2004,45Provided in cooperation with:
Technische Universität Dortmund
Suggested citation: Gebel, Meike; Sibbertsen, Philipp (2004) : Recognizing mathematical talent : an approach using discriminant analysis, Technical Report / Universität Dortmund, SFB 475 Komplexitätsreduktion in Multivariaten Datenstrukturen, No. 2004,45, http:// hdl.handle.net/10419/22558
RECOGNIZING MATHEMATICAL TALENT
– AN APPROACH USING DISCRIMINANT ANALYSIS 1 –
by
Meike Gebel and Philipp Sibbertsen2
Fachbereich Statistik, Universit¨at Dortmund, D-44221 Dortmund, Germany
Abstract
The aim of this paper is to extract mathematically talented students out of a group of arbitrary high school students. We do this by applying a step-wise discriminant analysis modified for ordinal data to the results of German high school students at the international mathematics competition ”Kanga-roo of Mathematics”. It turns out that three of the thirty given problems are enough to discriminate between laureates, which we assume to be mathemati-cally talented, and non-laureates. The three chosen problems are from different mathematical fields.
KEY WORDS: Discriminant analysis for ordinal data, discrete kernel estima-tion, testing mathematical talent, multiple choice competition
1
Introduction
Several international comparisons of high school students such as the test PISA proved that German high school students cannot compete with students from 1We are grateful to M. Noack for placing the prepared data to our disposal. Research
supported by Robert Bosch foundation and Deutsche Forschungsgemeinschaft under SFB 475.
We are also grateful to S. Halverscheid and the participants of SMABS 2004 for many valuable comments and discussions.
2Corresponding author,
most of the other countries in the study and show at best an average perfor-mance. Especially their performance in Mathematics started an intensive and still ongoing discussion about the educational system in Germany. It turned out that the focus should not be only on students having problems in the sub-ject but that there should also be support for gifted students. However, from this point the question arises when a high school student should be called gifted.
Former studies consider this question mainly from a didactic point of view. They develop a catalogue of problems which they use for testing the students. Depending on the students approach to solve the problem the student is said to be either gifted or not (see for example K¨apnick, 1998). Such an appraisal depends strongly on the subjective opinion of the tester. Therefore, we want to give objective criteria which enables to test mathematical talent. We are also concerned with high school students being in the last three years. This is due to the lack of students interested in studying mathematics and other sciences at universities. From an universities point of view it is important to develop an interest in mathematics in this age.
In this paper we analyze the performance of German high school students at the competition ”Kangaroo of Mathematics”. In contrast to other competitions of mathematics this competition has the advantage that whole classes participate. Thus, we have data from less gifted students as well as from students which proved their talent by an exceptional good performance. In this study we say that a student is talented when he is awarded a prize. This is around 5% of the participants. Further details concerning the data are given in section 2. The aim of this paper is to classify types of problems which discriminate lau-reates from the other participants. This is done by means of discriminant analysis. The problem when applying discriminant analysis is that our data is ordinal due to the multiple choice character of the problems. Hence, we can distinguish only between a correctly solved problem, a wrong solution and no solution which is an answer, too. We therefore apply a generalization of discriminant analysis to our data.
The rest of the paper is organized as follows. In section 2 the data and the competition ”Kangaroo” are explained in more detail. Section 3 gives an de-scriptive analysis of the data. Section 4.1 introduces discriminant analysis for ordinal data and section 4.2 gives our results. In section 5 some conclusions are given.
2
Description of the data
In this article we analyze data of the mathematics competition ”Kangaroo of mathematics”. This competition is carried out once a year in many european countries for all students from the third year on. One advantage for our pur-poses is that at many schools whole classes participate at this competition. Thus, the whole range from highly talented to less gifted students participate at the competition. We consider in this paper students in the years 11 to 13 which are the last three years in the German high school system. These stu-dents build one group in the competition having the same problems to solve. Therefore, our data set contains 5854 students.
The competition contains 30 problems in a multiple choice system. This means that for each problem five possible answers are given. One of these is the correct answer and the others are wrong. It was also possible to give no answer at all. The students had 75 minutes time for solving the problems. Every student started with 30 points on his account. For the first ten problems the student got three points added on his account for a correct answer and got 0.75 points off for a wrong answer. For the problems 11 to 20 the student could gain either four points for a correct answer or one point off for a wrong answer and for the problems 21 to 30 the student obtained five or minus 1.25 points. Not solving a problem was marked with zero points and was hence the better solution than giving a wrong answer. Therefore, the students could reach between 0 and 150 points. Students which gained more than 82.5 points were awarded a prize. The problems were chosen from fields of mathematics which have mostly been covered in school up to year eleven. This includes subjects such as analysis,
geometry and logic. The question of interest is whether some of these fields enable to discriminate between winners of a prize and other students.
3
Descriptive analysis of the data
In order to obtain an impression of the achievement of the 5854 high school students in the years 11 to 13, at first a brief descriptive analysis of the data is given. The students reached between 0 and 128.75 points, meaning that the best student was more than 20 points below the optimal 150-point-score. The average score was about 48 points, so less than a third of the highest possible account. Also the graph (see fig. 1) of the distribution points out, that the results are highly concentrated within the region of 30 to 60 points. 13% of the students could not even hold the starting credit and just under 1% took the 100-points-hurdle. Thus, the laureates – which are those 261 students, who achieved more than 82.5 points – represent only a fraction of 4.5% of the 5854 participants.
It is of interest whether there can be found other characteristics beside the final scores which help to differ between this two groups – the laureates and
final score
relative frequency (in %)
0 30 60 90 120 150 0 5 10 15 20 25 82.5-points
the non-laureates. Thus, at first the distribution of the answers is considered in more detail. The question under consideration is whether there exist any differences between the structures of the answers of the laureates and of the other students.
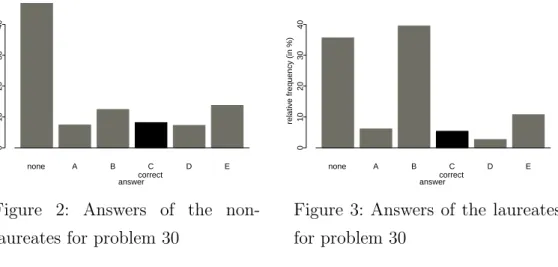
The group of the laureates does not only differ in that way from the non-laureates, that they solved most of the answers correctly, but also that they answered in a more structured form. In contrast to the non-laureates, which mostly spread their attempts of solutions nearly uniformly to the five given possible answers, the prize winners rather favoured one specific answer. This way of answering is typical for most of the problems and shown exemplarily for one noticeable problem in figures 2 and 3. But as that special problem also demonstrates the preferred answer of the laureates could be the wrong one.
none A B C correct D E 0 10 20 30 40 answer
relative frequency (in %)
Figure 2: Answers of the non-laureates for problem 30
none A B C correct D E 0 10 20 30 40 answer
relative frequency (in %)
Figure 3: Answers of the laureates for problem 30
4
Discriminant analysis for discrete data
The support of the mathematical comprehension of young persons causes the problem to search out their potentials as soon and precisely as possible and to advice them with suitable methods. The laureates are said to have particular mathematical abilities. Therefore, what we aim at is to use the given answers to identify the talented in the whole group of students.
The utilized stepwise discriminant analysis tackles a further problem at the same time. Its aim is to develop a rule which reassigns any student singled out back to his own group. That is done by finding step by step those problems out of the 30 given with which it is possible to construct such a rule. Thus, a reliable classification is guaranteed using only a few exercises. This is useful in two ways: The first advantage is that these few problems can be presented to other groups of students to rate their mathematical skills. The second one is to deduce from the chosen set of problems certain topics which allow to identify the students with high mathematical potential.
4.1
Theoretical approach
The point of departure is the same as in the case of the classical discriminant
analysis: We consider the population Ω which is divided ingmutually exclusive
classes Ω1, . . . ,Ωg. The aim is to find a decision rule which assigns an object
ω ∈ Ω with vector of observationsy = (y1, . . . , yp)′, in which p is the number
of variables observed, to one of the g classes. This is done by means of the
discriminant functiondk(y) = p(k)f(y|k), k = 1, . . . , g, wherep(k) denotes the
a priori probability thatω comes from the setk and f(y|k) is the distribution
of y in Ωk. The function allocates ω with observation y exactly to that class
k∗ for which
dk∗(y) = max
k (dk(y)) for all k ∈ {1, . . . , g}
holds.
In practice the problem arises that the included functions p(k) and f(y|k)
are unknown. For estimating these functions a training set is used. Therefore, those objects are chosen of which the class they belong to is known.
The prior probability p(k) often is estimated directly by using the training
set. However, a problem will arise if this training set is a stratified sample and thus, the proportion of the members belonging to the different groups will be no longer representative for the whole set. Groß (1988) and McLachlan (1992) discuss what can be done in that case.
Furthermore,f(y|k) has to be estimated. Because of the ordinal scaling of the data with only a few categories the problem arises that the classical type of density estimation – based on the assumption of normal distribution – cannot be used. Thus, a discrete kernel is taken in order to estimate the density. In case of continuous variables these are discussed since the middle of the 20th century. The idea is to use a kernel function, which has the same characteristics as a density function, to transform the observations of the sample pointwisely. That produces a smoothing of the frequency distribution observed, and thus, an imitation of the density function. Based on that fact Aitchison and Aitken (1976) give a first impulse to transfer the theory to categorical data.
Suppose thatS(k)={x(k)
1 , . . . ,x (k)
Nk}is the training set of sizeNk,k = 1, . . . , g,
withp-dimensional vectors of observations of objects belonging to class k. The
training set is summarized in a matrix of observations for the k-th group:
X(k) = x11(k) x12(k) . . . x(1kp) x21(k) x22(k) . . . x(2kp) ... ... . .. ... x(Nkk)1 xN(kk)2 . . . x(Nkk)p = X1(k·) X2(k·) ... XN(kk)· .
The aim is to use this matrix of observations to estimate the value of the density for a ”new” object, which does not come from the training set. Assume that y= (y1, . . . , yp)′ is the vector of observations belonging to the considered
object. Then the density at this point can be estimated by ˆ p(y|X(k),λ(k)) = 1 Nk Nk X i=1 p Y j=1 Kj(yj|x( k) ij , λ (k) j ). (1)
The vector λ(k) = (λ1(k), . . . , λ(pk))′ consists of the smoothing parameters
con-cerning thepcharacters of classk.Kj(yj|x(ijk), λ
(k)
j ) is a kernel function
belong-ing to the j-th character. The individual shape of the kernel conforms to the
structure and number of parameters which are considered.
For ordinal scaled data a kernel is chosen which uses and processes the
infor-mation of ranking. If we consider the value yj of an object which has to be
yj to the parameter value xij of the object just observed. Thus, the kernel is
defined as decreasing, if for a greater distance the weighting of the probability is lower. Thereby, special modes of distance attributes can be considered as discussed in Tutz (1990).
Based on this condition Aitchison and Aitken (1976) suggest a kernel for the
ordinal three parameter values which are supposed to be the set of T =Tj =
{0,1,2} for all j (without loss of generality). The kernel for λ(jk) =λ is given
by Kj(yj|x (k) ij , λ (k) j =λ) xij = 0 xij = 1 xij = 2 yj = 0 λ2 12(1−λ2) (1−λ)2 yj = 1 2λ(1−λ) λ2 2λ(1−λ) yj = 2 (1−λ)2 12(1−λ2) λ2
The kernel has the assumed decreasing attribute for λ∈[2
3,1].
After defining the kernel function the smoothing parameter has to be
opti-mized. Aitchison and Aitken (1976) specify for the choice of λ(jk) as above the
maximization of the jackknife likelihood W(λ(jk)|X(k)). ¿From all λ(k)
j in [23,1]
that value is taken which maximizes
W(λ(jk)|X(k)) = Nk Y i=1 ˆ p(x(ijk)|X·(jk)\ {x(ijk)}, λ(jk)),
whereas X·(jk)\ {xij(k)} is the j-th column of X(k) in which the i-th observation
is left out. As soon as an optimal λ for each of the characteristics j = 1, . . . , p
is found in this way, the final estimator (1) can be determined with the
set of these. For the chosen parameter λopt pˆ(y|X(k),λ(k)
opt) is a
consis-tent estimator for f(y|k) (Aitchison and Aitken, 1976). Hall (2001) gives a
review of generalization of this ordinal estimator to more than three categories.
By means of this estimator we can find an estimated discriminant rule of the following form:
Allocate the object with vector of observations y to classk∗, if
p(k∗)ˆp(y|X(k∗)
In the special case of two classes that means for example: Allocate the object
with vector of observations y to class 1, if
p(1)ˆp(y|X(1),λ(1))≥p(2)ˆp(y|X(2),λ(2)),
and to class 2 otherwise.
The quality of this decision rule can be characterized by its error rate which can be estimated by the leaving-one-out method. By counting the number of misclassifications separately for each class, the estimated expected error rate is given by ˆ ε= ˆE(ε(X, f)) = g X k=1 p(k)nk Nk . (2)
nk (k = 1, . . . , g) is the number of misallocated objects which are originally
from class k. Of course, the error rate has to be minimized. However, if one
considers a great number of variables, it is common that with successive inclu-sion of variables for constructing the allocation rule the estimated (expected) error rate at first decreases continuously, but at a certain number of variables it increases (see Seber, 1984). Hence, we use in this paper a selective method that chooses the relevant variables. We concentrate on stepwise forward selection, for which the estimated error rate serves as criterion. The procedure starts with an empty subset of variables. At each step that variable is added which, in combination with the subset considered in the preceding step, minimizes the estimated error rate. As soon as the rate increases for the first time one further step is carried out as a trial. If the rate is continuously increasing, the pro-cedure stops and those variables are taken which have produced the minimal error rate. If the rate starts decreasing again, the procedure is continued.
4.2
Empirical results
In this section the discriminant analysis for discrete data described in section 4.1 is applied to the ”Kangaroo”-data. Before constructing the decision rule the data has to be divided into two subsets: one training set for estimation and one testing set for proving the quality of our decision rule afterwards. To
raise the 4.5% rate of the laureates in the set of students we take a stratified sample, separately for both groups. The training set is of size 1700 composed
of N1 = 200 laureates and N2 = 1500 other students.
Past experience has shown that the rate of laureates for the group of students of that age do not differ strongly from one year to another. Thus, the a priori probabilities needed for the decision rule are calculated by the results of the
competitions of three years. Let p(1) = 0.051 be the a priori probability for
being a laureate, then p(2) = 0.949 is the probability for not being a member
of this group of bests. With that basic components the discriminant analysis can be carried out to find the relevant problems step by step.
However, in the first step the problem arises that the estimated error rate
is ˆε = 0.051 for every single problem, so that the criteria of selecting that
problem out of the 30 given which produces the smallest rate does not work at all. Hence, without choosing one starting variable the procedure has to continue with the second step in a modified way. All 435 pairs of problems are compared in order to obtain a starting pair. After finding an initial pair, in every following step this first subset can be combined with one more variable as described in section 4.1.
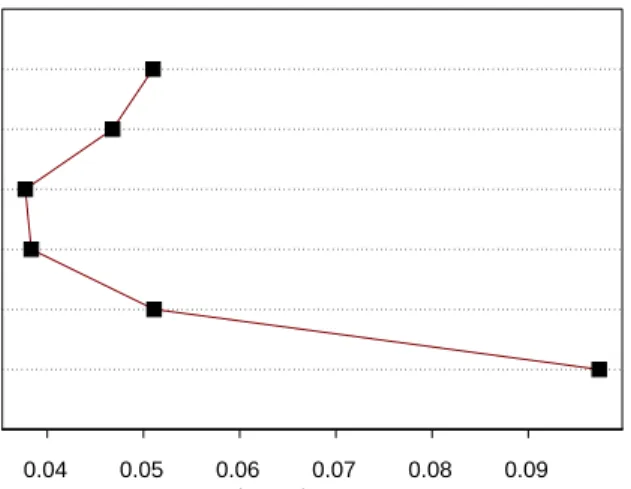
0.04 0.05 0.06 0.07 0.08 0.09
estimated error rate 1 problem 2 problems 3 problems 4 problems 5 problems 6 problems
The progression of selection is shown in figure 4. ¿From the fourth step on the minimal estimated error rate begins increasing step by step. Also the range, in which the values are located, gets higher stepwise. While the error rates corresponding to step 3 vary in a range of about 1%, in the sixth step the range is increased to a value of nearly 4%.
Thus, the procedure creates a decision rule based on three problems (numbers 23, 25 and 20 as shown in the appendix). The allocation rule characterizes those students as laureates who answered all three questions correctly.
Number 23 clearly is a combinatoric problem. Students can solve it with clev-erness and a good basic knowledge in this mathematical context. But it is possible as well to tackle the problem with logical comprehension and to find the right solution intuitively.
For solving problem number 25 it is sufficient to apply basic tools from analysis as long as those were discussed at school. Have in mind that also students from class 11 participate where analysis has not to be discussed necessarily in Germany. For instance, the function asked for can be found by exclusion. At first sight problem number 20 seems to be of geometric nature, but it also has to be solved in an analytical way. The important thing is not the spatial imagination like in many other of the geometric problems asked in the competition.
Thus, the three problems 20, 23 and 25 suffice to get a reliable rule. That is only a part of 10% of the questions has to be asked in order to obtain a rule which enables us to find the mathematically talented students. Thus, some of the mathematical fields considered in the competition are not included in the chosen set of problems as for example the spatial imagination or the theoretical arithmetic. These seem to be not that relevant for the identification of the laureates.
Subsequently, it has to be checked whether students are assigned to the two groups correctly in general by our rule. For this purpose the classification rule obtained by the training set is applied to the 61 laureates and the 4093 other students of the testing set. The rule considers a student as laureate if he or she
answered all three problems correctly. In the case of non-laureates these are 41, that is about 1%. 41 of the 61 laureates are allocated to the group of non-laureates. The weighting with the prior probabilities gives the estimated error rate of 0.0437, which is satisfactory. By these three problems from the topics combinatoric, analysis and geometry in combination with finding the solution in an analytical way the laureates can be identified in a sufficient reliable way. As seen in the case of the testing sample, although the chosen decision rule produces a small estimated error rate, it allocates a great number of the lau-reates incorrectly. Thus, our set of students, who are identified as ”laulau-reates”, consists only of a very small number of non-laureates. But the problem is that many of the real laureates are not member of our created group. Hence, our rule identifies the non-laureates precisely, but the laureates not as good as it would be desirable. So a student who fails the test cannot automatically be considered as not talented. However, it should never be the objective of a de-cision rule to classify a student as bad by the means of three problems. Still, future works should take up this problem and develop a decision rule which prevents this misclassification.
5
Summary
We considered the results of German high school students being in their last three years at the international mathematics competition ”Kangaroo of math-ematics”. The aim of the paper was to find a decision rule to decide which of the students can be seen as highly gifted in mathematics. The advantage of the data was that whole classes participated at the competition rather than single students which are at least mathematically interested anyway. Therefore, we had access to the performance of highly talented students as well as to the performance of less gifted students. We said that a student is highly talented when he was awarded a prize. About 5% of the participants were laureates. The competition was organized in a multiple choice character by giving five possible answers of which one was the correct one for each problem. Not solving the problem was marked better than giving a wrong solution. Therefore, we
had three categories for each problem. The whole competition was consisting of thirty problems from almost all fields of mathematics which have mostly been discussed in high school up to year eleven.
In order to obtain a decision rule we applied a stepwise discriminant analysis modified for ordinal data to the results from the competition. It turned out that three out of the thirty problems are enough to discriminate between laureates and non-laureates by obtaining a satisfying error rate. The three problems are from different mathematical fields showing that a broad knowledge of mathe-matical ideas is an important criterion for mathemathe-matical talent.
Our decision rule gave better results by assigning the non-laureates to the right group. This shows that a student assigned to be talented by our decision rule is really highly gifted with a high probability whereas we cannot discriminate a student who fails this test as being not talented. However, as it should never be the idea of such a decision rule to grade a student as definitely bad our decision rule can still be seen as a good indicator for extracting highly gifted students.
References
Aitchison, J. und Aitken, C. G. G. (1976): ”Multivariate binary
dis-crimination by kernel method,” Biometrika 63, 413-20.
Groß, Herbert (1988): Parametrische und nonparametrische Verfahren der Diskriminanzanalyse mit Variablen verschiedenen Skalenniveaus, PhD thesis, Regensburg (in German).
Hall, P. (2001): ”Biometrika centenary: nonparametrics,” Biometrika 88, 143-165.
K¨apnick, F. (1998):Mathematisch begabte Kinder, Frankfurt (Peter Lang, Europ¨aischer Verlag der Wissenschaften) (in German).
McLachlan (1992): Discriminant analysis and statistical pattern
recogni-tion, New York (Wiley).
Tutz, G. (1990): Modelle f¨ur kategoriale Daten mit ordinalem Skalen-niveau: parametrische und nonparametrische Ans¨atze, G¨ottingen (Van-denhoeck & Ruprecht) (in German).
Appendix
The three chosen problems
Problem number 23
At a horse race horses A, B, C, D and E take part. While discussing the possible coming-ins the experts realize that they know the horses so poorly that nearly every coming-in seems to be possible. The only restriction is that B never reaches the finishing line before A does it. How many possible coming-ins will exist under this restriction, if it is assumed that all horses pass the finish at different times?
(A) 110 (B) 105 (C) 72 (D) 64 (E) 60
Problem number 25
Which of the following functions has got the characteristics (1) to (3):
(1) f(x) is defined for all x≥0.
(2) It is valid, that f(x)≥ −2 for all x≥0.
(3) There exists one real figure x,x≥0, with f(x) = −2.
(A) f(x) = |x−2| (B) f(x) =x2 −2x−1 (C) f(x) = 1−3x
x
(D) f(x) = x2−x−2 (E)f(x) =|x+ 2| −2
Problem number 20
The hypotenuse of a right-angled triangle should be 0.9 cm long, the legs of the
triangle should be of length a cm resp. b cm. Which of the following numbers
is the smallest?