Automatically Finding Performance Problems with Feedback-Directed Learning
Software Testing
Mark Grechanik
Accenture Technology Lab and U. of Illinois, Chicago Chicago, IL 60601
Chen Fu, Qing Xie Accenture Technology Lab
Chicago, IL 60601
{chen.fu, qing.xie}@accenture.com
Abstract—A goal of performance testing is to find situations when applications unexpectedly exhibit worsened characteris-tics for certain combinations of input values. A fundamental question of performance testing is how to select a manageable subset of the input data faster to find performance problems in applications automatically.
We offer a novel solution for finding performance problems in applications automatically using black-box software testing. Our solution is an adaptive, feedback-directed learning testing system that learns rules from execution traces of applications and then uses these rules to select test input data automatically for these applications to find more performance problems when compared with exploratory random testing. We have implemented our solution and applied it to a medium-size ap-plication at a major insurance company and to an open-source application. Performance problems were found automatically and confirmed by experienced testers and developers.
I. INTRODUCTION
A goal of performance testing is to find performance prob-lems, when an application under test (AUT) unexpectedly exhibits worsened characteristics for a specific workload [1], [2]. For example, effective test cases for load testing, which is a variant of performance testing, find situations where an AUT suffers from unexpectedly high response time or low throughput [3], [4]. Test engineers construct performance test cases, and these cases include actions (e.g., interacting with GUI objects or invoking methods of exposed interfaces) as well as input test data for the parameters of these methods or GUI objects [5]. It is difficult to construct effective performance test cases that can find performance problems in a short period of time, since it requires test engineers to test many combinations of actions and data for nontrivial applications.
Depending on input values, an application can exhibit different behaviors with respect to resource consumption. Some of these behaviors involve intensive computations that are characteristic of performance problems [6]. Naturally, testers want to summarize the behavior of an AUT concisely in terms of its inputs, so that they can select input data that will lead to significantly increased resource consump-tion thereby revealing performance problems. Unfortunately, finding proper rules that collectively describe properties of
such input data is a highly creative process that involves deep understanding of input domains [7, page 152].
Descriptive rules for selecting test input data play a significant role in software testing [8], where these rules approximate the functionality of an AUT. For example, a rule for an insurance application is that some customers will pose a high insurance risk if these customers have one or more prior insurance fraud convictions and deadbolt locks are not installed on their premises. Computing insurance premium may consume more resources for a customer with a high-risk insurance record that matches this rule versus a customer with an impeccable record, since processing this high-risk customer record involves executing multiple computationally expensive transactions against a database. Of course, we use this example of an oversimplified rule to illustrate the idea. Even though real-world systems exhibit much more complex behavior, useful descriptive rules often enable testers to build effective performance fault revealing test cases.
We offer a novel solution for Feedback-ORiEnted Per-fOrmance Software Testing (FOREPOST)for finding perfor-mance problems automatically by learning and using rules that describe classes of input data that lead to intensive computations. FOREPOST is an adaptive, feedback-directed learning testing system that learns rules from AUT execution traces and uses these learned rules to select test input data automatically to find more performance problems in applications when compared to exploratory random perfor-mance testing [9], [10]. FOREPOST uses runtime monitor-ing for a short duration of testmonitor-ing together with machine learning techniques and automated test scripts to reduce large amounts of performance-related information collected during AUT runs to a small number of descriptive rules that provide insights into properties of test input data that lead to increased computational loads of applications.
This paper makes the following contributions.
• FOREPOST collects and utilizes execution traces of the AUT to learn rules that describe the computational intensity of the workload in terms of the properties of input data. These rules are used by the adaptive automated test script automatically, in a feedback loop to steer the execution of the AUT by selecting input
data using these learned rules. We know of no testing approach that uses this idea to find performance prob-lems in real-world applications.
• We give a novel algorithm that identifies methods that lead to performancebottlenecks (or hot spots), which are phenomena where the performance of the AUT is limited by one or few components [11], [12].
• We have implemented FOREPOST and applied it to an application at a major insurance company. Performance problems were found automatically in the insurance application and confirmed by experienced testers and developers who work at this company. After imple-menting a fix, the performance of this application was improved by approximately seven percent.
• We also applied FOREPOST to an open-source applica-tion benchmark, JPetStore. FOREPOST automatically found rules that steer the executions of JPetStore to-wards input data that increases the average execution time by the order of magnitude when compared with exploratory random testing [9], [10].
II. BACKGROUND AND THEPROBLEM
In this section we describe the state of the art and practice in performance testing, show a motivating example, and formulate the problem statement.
A. State of the Art and Practice
Performance testing of enterprise applications is manual, laborious, costly, and not particulary effective. Currently, a prevalent method for performance testing isintuitive testing, which is a method for testers to exercise the AUT based on their intuition and experience, surmising probable errors [13]. Intuitive testing was first introduced in 1970s as an ap-proach to use experience of test engineers to focus on error-prone and relevant system functions without writing time-consuming test specifications thus lowering pre-investment and procedural overhead costs [13]. When running many dif-ferent test cases and observing application’s behavior, testers intuitively sense that there are certain properties of test cases that are likely to reveal performance bugs. Distilling these properties automatically into rules that describe how these properties affect performance of the application is a subgoal of our approach.
B. A Motivating Example
ConsiderRenters Insurance Program(or simplyRenters) designed and built by a major insurance company. A goal of this program is to compute quotes for insurance premiums for rental condominiums. Renters is written in Java and it contains close to 8,500 methods that are invoked more than three million times over the course of a single end-to-end pass through the application. Its database contains approxi-mately 78Mil customer profiles, which are used as test input data for Renters. Inputs that cause heavy computations are
sparse, and random test selection often does not perform a good job of locating these inputs. A fundamental question of performance testing is how to select a manageable subset of the input data for performance test cases with which performance problems can be found faster and automatically. Rules for selecting test input data that quickly lead to finding performance problems are notoriously difficult to capture, since these rules are buried in the source code and thus they are hard to locate manually. Test engineers must intimately know the functionality of the subject ap-plication under test, understand how programmers designed and implemented the application, and hypothesize on how application behavior matches requirements for this appli-cation. Without having useful rules that summarize these requirements, it is difficult to define objectives that lead to selecting good test cases [14].
Currently, the state-of-the-practice of finding useful rules is to use experience and intuition of performance test engi-neers who spend time observing the behavior of AUTs when running manually constructed test cases. There is little au-tomated support for discovering problems with performance testing, where a recent work by Hassan et. al. is the first that can automatically detect performance problems in the load testing results by analyzing performance logs [3], however, test inputs are not located that cause performance problems. Experience and intuition are main tools that performance test engineers use to surmise probable errors [15] [13]. C. Automated Performance Test Scripting Approaches
Typically, performance testing is accomplished usingtest scripts, which are programs that test engineers write to automate testing. These test scripts performs actions (i.e., invoking methods of exposed interfaces or mimicking user actions on GUI objects of the AUT) to feed input data into AUT and trigger computation. Test engineers write code in test scripts that guide selection of test inputs; typically, it is done using randomly selected input values or by using algorithms of combinatorial design interactions [16]. It is impossible to performance test applications without test scripts, since it is not feasible to engage hundreds of thousands of testers who simulate multiple users who call multiple methods with high frequency manually [17] [18] [19] [1].
Test scripts are written with either of two different frame-works: a GUI testing framework (e.g., QuickTestPro from HP Corp) or a backend server-directed performance tool such as JMeter, an open source software that is widely used to load test functional behavior and measure performance of applications. These frameworks are the basis on which per-formance testing is mostly done in industry. Perper-formance test scripts imitate large numbers of users to create a significant load on the AUT. JMeter provides programming constructs that enable testers to automatically generate a large number of virtual users who send HTTP requests directly to web
servers of AUTs thereby creating significant workloads. Natural measures of performance include throughput, that is the number of executed requests per second and the average response time it takes to execute a request. A goal of performance testing is to determine what combinations of requests lead to higher response times and lower throughput, which are helpful to reveal performance bugs in AUTs. D. The Problem Statement
Our goal is to automate finding performance problems by executing the AUT on a small set of randomly chosen test input data, and then inferring rules with a high precision for selecting test input data automatically to find more performance problems in the AUT. Specifically, these are if-then rules that describe properties of input data that result in good performance test cases that lead to increased computational workload on applications when compared to bad performance test cases when computational workload is much smaller. For example, a rule may say “if inputs convictedFraudistrueanddeadboltInstalled isfalsethen the test case is good.” In this work, we supply automatically learned rules using a feedback mechanism to test scripts, and these scripts parse these rules and use them to guide test input data selection automatically to steer execution of the AUT towards code that has exposes performance problems.
In this paper, we accept a performance testing definition of what constitutes agood test case. In general, a main goal of performance testing is to select a small subset of “good” test cases with which different testing objectives can be achieved [14], specifically, more performance problems can be found in a shorter period of time. One of the goals of performance testing is to find test cases that worsen response time or throughput of the AUT or its latency. It can be achieved by adding more users to the AUT thereby leading to intensive computations and increased computational workloads and by finding input data that make the AUT take more resources and time to compute results. Conversely,bad test casesare those that utilize very few resources and take much less time to execute compared to good test cases. A main goal is to automatically produce rules that describe good and bad test cases and then use these rules, also automatically to select input data for further testing.
The system should also correct itself by applying learned rules on test input data that are selected using these rules and verifying that these test data lead to predicted performance results, thereby increasing the probability that the learned rules express genuine causation between input values and performance-related workloads rather than simply correlat-ing them.
Finally, no performance testing is complete without pro-viding sufficient clues to performance engineers where in the AUT problems can lurk. A main objective of performance analysis is to find bottlenecks – a single method that drags
down the performance of the entire application is easy to detect using profilers; however, it is a difficult problem to find bottlenecks when there are hundreds of methods whose elapsed execution times are approximately the same, which often is the case in large-scale applications [11], [12]. A problem that we solve in this paper is that once the input space is clustered into good and bad performance test cases using learned rules, we want to find methods that are specific to good performance test cases and that are most likely to contribute to bottlenecks.
III. THEFOREPOST APPROACH
In this section we explain the key ideas behind our approach, give an overview ofFeedback-ORiEnted PerfOr-mance Software Testing (FOREPOST), describe its architec-ture, and show two types of test scripts that are used to automate performance testing.
A. An Overview of FOREPOST
In this section, we describe two keys ideas on which FOREPOST is built: 1) extracting rules from execution traces that describe relations between properties of input data and workloads of performance tests that are executed with this data and2)identifying bottleneck methods using these rules.
1) Obtaining Rules: As part of the first key idea, the instrumented AUT is initially run using a small number of randomly selected test input data, and its execution profiles are collected and clustered using machine learning (ML) techniques automatically into different groups that collectively describe different performance results of the AUT. For example, there can be as few as two groups that correspond to good and bad performance test cases.
The set of values for AUT inputs for good and bad test cases is the input to an ML classification algorithm. This in-put is described as implications of the formVI1, . . . ,VIk→T,
whereVIm is the value of the inputImandT∈ {G,B},Gand
B standing for good and bad test case correspondingly. In fact, T is the summarized score for an execution trace that describes summarily whether this execution has evidence of performance problems. The ML classification algorithm learns the model and outputs rules that have the form Ip⊙VIp•Iq⊙VIq•. . .•Ik⊙VIk→T, where ⊙is one of the
relational operators and•stands for logical connectorsand andor. These rules are instrumental in guiding selection of the input test data in test scripts.
A feedback loop is formed by supplying these learned rules that are obtained using the ML classification algorithm are supplied back into the test script to automatically guide selection of test input data. Using newly learned rules, test input data is partitioned and the cycle repeats. The test script selects inputs from different partitions, the AUT is executed again, and new rules arerelearned from collected execution traces. If no new rules are learned after some time of testing,
it means that the partition of test inputs is stable with a high degree of probability. At this point instrumentation can be removed and testing can continue, and test input data is selected using the learned rules.
2) Identifying Bottlenecks: Our goal is to help test en-gineers to identify bottlenecks automatically as method calls whose execution seriously affects the performance of the whole AUT. For example, consider a method that is periodically executed by a thread to check to see if the content of some file is modified. While this method may be one of the bottlenecks, it is invoked in both good and bad test cases, thus its contribution to resource consumption as the necessary part of the application logic does not lead to any insight that may resolve a performance problem. Our second key idea is to consider the most significant methods that occur in good test cases and that are not invoked or have little to no significance in bad test cases, where the significance of a method is a function of the resource consumption that its execution triggers.
B. Blind Source Separation
Large applications implement multiple requirements, each of these requirements is implemented using different meth-ods. Each AUT run involves thousands of its methods that are invoked millions of times. The resulting execution trace is a mixture of different method invocations, each of which address a part of some requirement. These traces are very large. In otder to identify most significant methods, we need an approach with which we can compress information in these traces and break these traces automatically into components that match high-level requirements and then we identify methods with most significant contributions to these components. Unfortunately, using transactional boundaries to separate information in traces is not always possible, for example, when dealing with file operations or GUI frame-works. We reduce the complexity of collected execution traces by categorizing them into components that roughly correspond to different requirements.
We draw an analogy between separating method invo-cations in execution traces into components that represent high-level requirements and a well-known problem of sepa-rating signals that represent different sources from a signal that is a mixture of these separate signals. This problem is known asblind source separation (BSS)[20, pages 13-18]. The idea of BSS is illustrated using a model where two people speak at the same time in a room with two microphonesM1andM2. Their speech signals are designated as source 1andsource 2. Each microphone captures the mixture of the signals source 1 and source 2 that is the corresponding signal mixtures from M1 and M2 respectively. The original signalssource 1andsource 2are separated from the mixtures using a technique called independent component analysis (ICA) [21], [22], which we describe in Section III-C. ICA is based on the
as-sumption that different signals from different physical pro-cesses are statistically independent. For example, different requirements are often considered independent since they implemented in applications as separate concerns [23], [24]. When physical processes are realized (e.g., different people speak at the same time or stocks are traded or an application is run and its implementations of different requirements are executed in methods), these different signals are mixed and these signal mixtures are recorded by some sensors. Using ICA, independent signals can be extracted from these mixtures with a high degree of precision.
In this paper we adjust the BSS model for breaking execu-tion traces automatically into components that approximately match high-level requirements, and then identifying methods with most significant contributions to these components. Nontrivial applications implement quite a few high-level re-quirements in different methods that are executed in different threads, often concurrently. We view each requirement as a source of a signal that consists of method calls. When an application is executed, multiple requirements are realized, and method invocations are mixed together in a mixed signal that is represented by the execution profile. Microphones are represented by instrumenters that capture program execution traces; multiple executions of the application with different input data is equivalent to different speakers talking at the same time – as a result multiple signal mixtures (i.e., execution traces for different input data with mixed realized requirements) are produced. With ICA, not only it is possi-ble to separate these signal mixtures into components, but also to define most significant constituents of these signals (i.e., method calls). We choose ICA because it works with non-Gaussian distributions of data, which is the case with FOREPOST.
C. Independent Component Analysis
A schematics of ICA matrix decomposition is shown in Figure 1. The equation kxk=kAk · ksk described the process, wherekxkis the matrix that contains the observed signal mixtures and kAk is the transformation or mixing matrix that is applied to the signal matrixksk. In our case, the matrixkxk is shown in Figure 1 on the left hand side of the equal sign, and its rows correspond to application execution traces from different input data with its columns corresponding to method invocations that are observed for each trace.
Each element of the matrix kxk is calculated as xij=
λN·Nj
i +λT·Tij+λA·Aij+λD·Dij+λM·Mij, where N j i is the number of times that the method j is invoked in the trace i, Tij is the total elapsed time of these invocations minus the elapsed time of all methods that are invoked from this method in this trace,Aij is the number of attributes that this method accesses in the databases, Dij is the amount of data that this method transfers between the AUT and
x
!"#$#%#
%&'()*+#
',-.
&+#
/#
####
A
!"#$#0#
,&1+#
',-.
&+#
$#
s
!0#$#%#
%&'()*+#
,&1
+#
Figure 1. Schematics of the ICA matrix decomposition.
the databases, Mij is the number of methods that are in-voked from this method, and finally, λ are normalization
coefficients computed for the entire matrix kxk to ensure 0≤xij≤1. Naturally, xij=0 means that the method i is not invoked in the trace j, while xij =1 means that the given method makes the most significant contribution to the computation in the given trace.
Using ICA, the matrixkxk is decomposed into a trans-formation and a signal matrices that are shown on the right hand side of the equal sign in Figure 1. The input to ICA is the matrixkxkand the number of source signals, that in our case is the number of requirements (reqs in the Figure 1) implemented in the application. Elements of the matrix kAk, Aqp specify weights that each profile p contributes to executing code that implements the requirement q, and elements of the matrix ksk, skq specify weights that each methodkcontributes to executing code that implements the requirement q. Methods that have the highest weights for given requirements are thought to be the most significant and interesting for troubleshooting performance problems. This is a hypothesis that we evaluate and describe results in Section V.
D. FOREPOST Architecture and Workflow
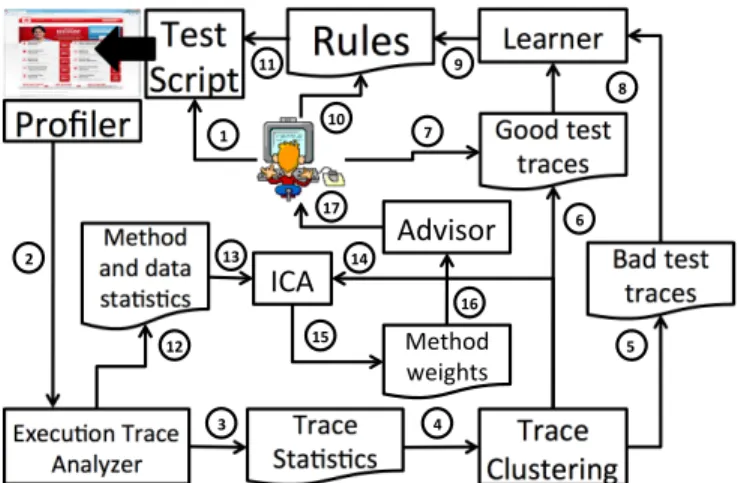
The architecture of FOREPOST is shown in Figure 2. Solid arrows show command and data flows between com-ponents, and numbers in circles indicate the sequence of operations in the workflow. The beginning of the workflow is shown with the fat arrow that indicates that the Test Script executes the application by simulating users and invoking methods of the AUT interfaces. The Test Script is written (1) by the test engineer as part of automating application testing as we described in Section II-C.
Once the test script starts executing the application, its execution traces are collected (2) by the Profiler, and these traces are forwarded to the Execution Trace Analyzer, which produces(3)the Trace Statistics. We implemented the Profiler using the TPTP framework1. This statistics contains information on each trace such as the number of invoked methods, the elapsed time it takes to complete the end-to-end application run, the number of threads, and the number of unique methods that were invoked in this trace. The trace statistics is supplied (4) to the module
1http://eclipse.org/tptp, last checked Sept 21, 2011
!"#$%%
&'()*$%
+(,-."(%
/0"'12,3%!(4'"% 534.67"(%!(4'"%
8.1#$"()39%
:1."#%
!(4'"% &$42#2'#% ;,,<%$"#$% $(4'"#% =4<%$"#$% $(4'"#%>"4(3"(%
?"$@,<%% 43<%<4$4% #$42#2'#%A85%
!" ?"$@,<% B")9@$#%5<C)#,(%
#" $" %" &" '" (" )" *" )+" ))" )!" )#" )%" )&" )(" )$"Figure 2. The architecture and workflow of FOREPOST.
Trace Clustering, which uses an ML algorithm, JRip [25] to perform unsupervised clustering of these traces into two groups that correspond to (6) Good and (5) Bad test traces. The user can review the results of clustering and(7) reassign clustered traces if a need exists. These clustered traces are supplied (8) to the Learner that uses them to learn the classification model and (9)output rules that we described in Section III-A. The user can review(10)these rules and mark some of them as erroneous if the user has sufficient evidence to do so. Then the rules are supplied (11) to the Test Script. Once the Test Script receives a new set of rules, it partitions the input space into blocks according to these rules and starts forming test inputs by selecting one input from each block. The profiler collect traces of these new test runs, and thus the cycle repeats, with new rules that can be learned at each several passes and the input space is repartitioned adaptively to accommodate these rules. We implemented the ML part of FOREPOST using Weka [26].
The input test data comes from existing repositories or databases; it is a common practice in industry, we confirmed it with different performance testing professionals. Recall that the application Renters has a database that contains approximately 78Mil customer profiles, which are used as the test input data for different applications including Renters itself. We repeatedly run the experiment with the randomly selected initial seeds from the input space, which are different each time. New values are selected from the input space either randomly, if rules are not available, or based on learned rules.
Finally, recall from Section II-D that once the input space is partitioned into clusters that lead to good and bad test cases, we want to find methods that are specific to good performance test cases and that are most likely to contribute to bottlenecks. This task is accomplished in parallel to computing rules, and it starts when the Trace Analyzer
produces (12) the method and data statistics that is used to construct(13)two matriceskxBkandkxGkfor(14) bad and good test cases correspondingly. Constructing these matrices is done as we described in Section III-C. Once these matrices are constructed, ICA decomposes them(15)into the matricesksBk and ksGk for bad and good test cases correspondingly. Recall that our key idea is to consider the most significant methods that occur in good test cases and that are not invoked or have little to no significance in bad test cases. Crossreferencing the matrices ksBk and ksGk which specifies method weights for different requirements, the Advisor(16)determines top methods that performance testers should look at(17)to debug possible performance problems. This step completes the workflow of FOREPOST.
Algorithm 1 The algorithm for identifying bottlenecks.
1: ForePost( Execution TracesT, Signal ThresholdU )
2: B←0/,Cgood←0/,Cbad←0/{Initialize values for the set
of bottlenecks, the set of clusters that contain execution traces that are matched to good and bad test cases.} 3: ClusterTraces(T)7→(Cgood7→ {tg},Cbad7→ {tb}),tg,tb∈
T,tb∩tb=0/ 4: CreateSignalMixtureMatrix(Cgood)7→ kxgk 5: CreateSignalMixtureMatrix(Cbad)7→ kxbk 6: ICA(kxgk) 7→((kAgk,ksgk)7→(Lg7→({<Mg,Rg,Sg> }))) 7: ICA(kxbk) 7→((kAbk,ksbk)7→(Lb7→({<Mb,Rb,Sb> }))) 8: for all eg7→ {<Mgi,R j g,Si jg >} ∈Lg do 9: for all eb7→ {<Mbk,Rlb,Sklb >} ∈Lbdo 10: if Mgi =Mbk∧Rgj=Rlb∧Sgi j≥U∧Sklb <U then 11: B←B∪eg 12: end if 13: end for 14: end for 15: return B
IV. THEALGORITHM FORIDENTIFYINGBOTTLENECKS In this section we describe our algorithm for identifying bottlenecks using FOREPOST. The algorithmForePostis shown in Algorithm 1. This algorithm takes as its input the set of captured execution traces,T, and the signal threshold, U, that is used to select methods whose signals indicate their significant contribution in execution traces. The set of methods that are potential bottlenecks, B is computed and returned in line 15of the algorithm.
In step 2 the algorithm initializes to the empty set the values for the set of bottlenecks, the set of clusters that contain execution traces that are matched to good and bad test cases. In step 3 the procedure ClusterTraces is called that automatically clusters execution traces from the set, T into good and bad test case clusters, Cgood and
Cbad respectively. Next, in steps 4 and 5 the procedure CreateSignalMixtureMatrixis called on clusters of traces that correspond to good and bad test cases respectively to to construct two matrices kxbk and kxgk for bad and good test cases correspondingly as we described in Sec-tion III-D. In step5and6, the procedureICAdecomposes these matrices into the matrices ksbk and ksgk for bad and good test cases correspondingly as we described in step (15) in Section III-D.
This algorithm runs the double nested loop between steps 8–14, which terminates after enumerating all methods for all requirement components in the decomposed matrices. That is, for each method whose signal is greater than the threshold U in the transformation and signal matrices that correspond to good cases, we compare if this method in the same component, R does not occur in the counterpart matrices for bad test case decompositions, or if the same method for the same component occurs, then its signal in the bad test case matrices should be less than the threshold, U. If this condition is evaluated to true in the step 10, this method is added to the set Bthat is returned to line15 as the algorithm terminates.
V. EVALUATION
In this section, we state our research questions (RQs) and we describe how we evaluated FOREPOST on two appli-cations: commercial application Renters that we described as our motivating example in Section II-B and open-source application JPetStore that is frequently used as an industry benchmark.
A. Research Questions
In this paper, we make one meta-claim – FOREPOST is “better” than exploratory random performance testing [9], [10], which is a popular industry approach. We define “better” in two ways: finding inputs that lead to significantly higher computational workloads and finding performance bottlenecks. We seek to answer the following research questions.
RQ1: How effective is FOREPOST in finding input test data that steer applications towards more compu-tationally intensive executions?
RQ2: How effective is FOREPOST in identifying bottle-necks with a high degree of automation?
B. Subject AUTs
We evaluate FOREPOST on two subject applications: Renters and JPetStore. The former is a commercial medium-size application that is built and deployed by a major insur-ance company. Renters serves over 50,000 daily customers in the U.S. and it has been deployed for over seven years. The latter is an open-source application that is often used as an industry benchmark, since it is highly representative of enterprise-level three-tier database-centric applications.
Table I
CHARACTERISTICS OF THE INSURANCE APPLICATIONRENTERS. SIZE=
LINES OF CODE(LOC), NOC =NUMBER OF CLASSES, NOM =NUMBER OF METHODS, NOA =NUMBER OF ATTRIBUTES, MCC = AVERAGE
MCCABE CYCLOMATICCOMPLEXITY, NOP =NUMBER OF PACKAGES.
Renters Size NOC NOM NOA MCC NOP Component [LOC] Authorization 742 3 26 1 4.65 1 Utils 15,283 16 1,623 1,170 1.52 9 Libs 85,892 284 6,390 5,752 1.68 26 Eventing 267 3 11 1 4.27 1 AppWeb 8,318 116 448 351 1.92 11 Total 110,502 422 8,498 7,275 - 48
Renters insurance application is a J2EE application that calculates the insurance premiums for rental condominium. Its software metrics are shown in Table I. The backend database is DB2 running on the IBM Mainframe, its schema contains over 700 tables that include close to 15,000 at-tributes that contain data on over 78Mil customers. The application accepts input values using 89 GUI objects. The total number of combinations of input data is approximately 1065, making it infeasible to comprehensively test Renter. We used Renters in our motivating example in Section II-B. JPetstore is a Java implementation of the PetStore bench-mark, where users can browse, purchase pets and rate their purchases. This sample application is typical in using the capabilities of the underlying component infrastructures that enable robust, scalable, portable, and maintainable e-business commercial applications. It comes with full source code and documentation, so we used it to experiment with FOREPOST and demonstrate that we can build scalable security mechanisms into enterprise solutions. We used iBatis JPetStore 4.0.52. JPetstore has 2,139 lines of code, 382 methods, 36 classes in 8 packages, with the average cyclomatic complexity of 1.224; it is deployed using the web server Tomcat 6 and it uses Derby as its backend database. C. Inputs
We measure inputs as transactional units, where one transactional unit for JPetStore is a combination of different URLs that map to different functional units of the appli-cation. These URLs are selected into a transactional unit randomly at first, but as rules are learned that describe limits on specific URLs, some URLs will be given more preference for inclusion in transactions. For Renters, a transactional unit is end-to-end run of the application with an input that is a customer profile that comes from the application database. D. Methodology
Our goal is to determine with which approach good performance test cases can be found faster. Given the complexity of subject applications, it is not clear with what
2http://sourceforge.net/projects/ibatisjpetstore
input data performance can be worsened significantly for these applications, and given a large space of input data, it is not feasible to run these applications on all inputs to obtain the most worsened performance execution profiles. These limitations dictate the methodology of our experimental design, specifically for choosing competitive approaches to FOREPOST. Specifically, we select random exploratory performance testing as the main competitive approach to FOREPOST, since it is widely used in industry and it is reported as consistently outperforming different systematic testing approaches.
Random testing approach, as the name suggests, involves random selection of test input data for input parameter val-ues, and in that it showed remarkably effective and efficient for exploratory testing and bug finding [27]. A seemingly “stupid” idea of random testing proved often more effective than systematic sophisticated testing approaches [28]. To prove our claims in this paper, our goal is to show under what conditions FOREPOST outperforms random testing with strong statistical significance.
Most nontrivial applications have enormous spaces of test input data objects that are constructed by combining values of different input parameters. Even though it is infeasible to select a large subset of customer profiles for testing Renters, it is possible to create combinations of values of customer records that will result in a smaller number of customer profiles. To do that, testing practitioners frequently use combinatorial design algorithms [29]. Most prominent are algorithms fort–wisecombinatorial interaction testing (CIT), which requires every possible allowed combination of values oft parameters be included in some test case in the test suite [30]. Of course, these combinations of values should match to valid customer records. Pairwise testing is whent=2, and every unique pair of values for each pair of input parameters is included in at least one test case in the test suite. We assemble customer profiles for our experiments with Renters using pairwise testing from the range of input data that was given to us by the insurance company that owns Renters.
In designing the methodology for this experiment we aligned with the guidelines for statistical tests to assess randomized algorithms in software engineering [31]. Our goal is to collect highly representative samples of data when applying different approaches, perform statistical tests on these samples, and draw conclusions from these tests. Since our experiments involve random selection of input data, it is important to conduct the experiments multiple times to pick the average to avoid skewed results. For each subject application, we run each experiment at least 50 times with each approach on the same AUT to consider collected data a good representative sample.
JPetStore is based on the client-server architecture, where its GUI front end is web-based and it communicates with the J2EE-based backend that accepts HTTP requests in the form
(a) Renters application.
!"###$$$$$$$$$$$$"####$$$$$$$$$$$$%"###$$$$$$$$$$&#####$$$$$$$$$$&!"###$
'()*+(,-$
)./0(1$
(b) JPetStore application.
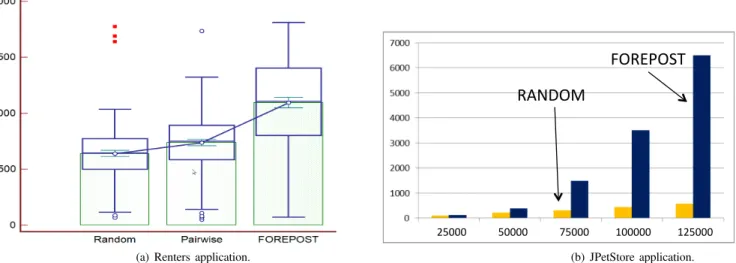
Figure 3. The summary of the results of the experiments with subject applications.The box and whisker plot for Renters is shown in Figure 3(a), where the time for end-to-end runs is measured in seconds. The central box represents the values from the lower to upper quartile (25 to 75 percentile). The middle line represents the median. The thicker vertical line extends from the minimum to the maximum value. The filled-out box represents the values from the minimum to the mean, and the thinner vertical line extends from the quarter below the mean to the quarter above the mean. An outside value is defined as a value that is smaller than the lower quartile minus 1.5 times the interquartile range, or larger than the upper quartile plus 1.5 times the interquartile range (inner fences). The bar graph for JPetStore is shown in Figure 3(b), where the bars represent average times per transaction in milliseconds for Random and FOREPOST approaches for different numbers of concurrent transactions ranging from 25,000 to 125,000.
of URLs containing address to different components and parameters for those components. For example, a URL can contain the address to the component that performs checkout and its parameters contain the session ID. We define a set of URL requests that comes from a single user as atransaction. JPetStore backend can serve multiple URL requests from multiple users concurrently. Depending on types of URL requests in these transactions and their frequencies, some transactions may cause the backend server of JPetStore to take longer time to execute.
To obtain URL requests that exercise different compo-nents of JPetStore, we used the spider tool in JMeter to traverse the web interface of JPetStore, and recorded URLs that are sent to the backend during this process. In random testing, multiple URLs are randomly selected to form a transaction. In FOREPOST, URL selection process is guided by learned rules. Various constraints must be observed when forming transactions. For example, the user action “checkout” is permitted only when the user already logged into the system and the shopping chart is not empty. Thus, if a URL representing “checkout” action is selected into a transaction, then two other URLs representing “user logged in” and “add to shopping cart” must also be added into the same transaction.
We limit the number of URLs in each transaction to 100, this number was chosen experimentally based on our observations of JPetStore users who explored approximately 100 URLs before switching to other activities. Increasing the number of certain URL requests in transactions at the
expense of not including other URL requests may leads to increased workloads, and the goal of our experimental evalu-ation is to show that FOREPOST eventually selects test input data (i.e., customer profiles for Renters or combinations of URLs for JPetStore) that lead to increased workloads when compared to the competitive approaches.
When testing JPetStore, URLs in a transaction are issued to the backend consecutively to simulate a single user. Multiple transactions are randomly selected and issued in parallel to simulate concurrent users. During the testing we use different numbers of concurrent transactions, and measure the average time it takes JPetStore backend to execute a transaction. A goal of its performance testing is to find combinations of different URLs in transactions for different concurrent users that lead to significant increase in the average time per transaction, which is often correlated with the presence of performance faults.
Experiments for Renters were carried out at the premises of the insurance company using Dell Precision T7500 with Six Core Intel Xeon Processor X5675, 3.06GHz,12M L3, 6.4GT/s, 24GB, DDR3 RDIMM RAM, 1333MHz. Experi-ments for JPetStore were carried out using one Dell XPS 15 laptop with Intel Core i7-2820QM processor 2.30 GHz with Turbo Boost 2.0 up to 3.40 GHz, 6GB Shared Dual Channel DDR3 RAM.
E. Variables
The main independent variable is the subject AUTs and approaches with which we experiment (i.e., random,
pair-wise random, and FOREPOST). Dependent variables are the throughput or the average number of transactions or runs that the subject AUTs can sustain under the load, the average time that it takes to execute a transaction or run the AUT end to end. Thus, if an approach achieves a lower throughput or higher average time per transaction with some approach, it means that this particular approach finds test input data which are more likely to expose performance. The effects of other variables (the structure of AUT and the types and semantics of input parameters) are minimized by the design of this experiment.
F. Threat to Validity
The main threat for our experimental design is that we experiment only with two subject AUTs. The results may vary for AUTs that have different logic or different source code structures. This threat makes it difficult for us to gen-eralize the result that we obtained through experimentation. However, since both applications are highly representative of enterprise-level applications that they come from different domains, we suggest that our result is generalizable for a larger population of applications.
G. Results
In this section, we describe and analyze the results that we obtained from our experiments with Renters and JPetStore. 1) Finding Test Inputs for Increased Workloads: The results for Renters are shown in the box-and-whisker plot in Figure 3(a) that summarize execution times for end-to-end single application runs with different test input data. To test the null hypothesis that there is no difference between execution times for random, pairwise, and FOREPOST approaches we applied two t-tests for two paired sample means. The results of this test allow us to reject the null hypotheses and we accept the alternative hypothesis with strong statistical significance (p<0.0001) that states that FOREPOST is more effective in finding input test data that steer applications towards more computationally in-tensive executions than random exploratory performance testing and random exploratory performance testing
with pairwise selection of input datathus addressing RQ1.
This conclusion is confirmed by the results for JPetStore that are shown in Figure 3(b) for average execution times for five runs. While performing random testing, it takes an average 576.7 seconds to execute 125,000 transactions. With FOREPOST, executing 125,000 transactions takes an aver-age 6,494.8 seconds. This implies that FOREPOST outper-forms random testing by more than the order of magnitude. Random testing is evaluated with the instrumented JPetStore, so that the cost of instrumentation is evenly factored into experimental results. FOREPOST has large overhead, close to 80% of the baseline execution time, however, once rules are learned and stabilized, they can be used to partition the input space without using instrumentation.
2) Identifying Bottlenecks: When applying the algorithm to Renters for identifying bottlenecks that we give in Section IV, we obtain a list of top 30 methods that the algorithm identified as potential performance bottlenecks out of approximately 8,500 methods. To evaluate how effective this algorithm is, we ask the insurance company to allocate the most experienced developer and tester for Renters to review this list and provide feedback on it. According to the management of the insurance company, it was the first time when a developer and a tester were in the same room together to review results of testing.
Reviewing started with the top bottleneck method, checkWildFireArea. The developer immediately said that FOREPOST did not work since this method could not be a bottleneck for a simple reason – this method computes insurance quotes only for U.S. states that have wildfires, and FOREPOST selected input test data for north-ern states like Minnesota that never have wildfires. We ex-plained that FOREPOST automatically selected the method checkWildFireAreaas important because its weight is significant in execution traces for good test cases, and it was absent in traces for bad test cases. It meant that this method was invoked many times for the state of Minnesota and other northern states, even though its contribution in computing insurance quotes was zero for these states. Invoking this method consumes more resources and time in addition to significantly increasing number of interactions with backend databases. After hearing our arguments, the developer and the tester told us that they would review the architecture documents and the source code and get back to us.
A day later they got back with a message that this and few other methods that FOREPOST identified as bottle-necks were true bottlebottle-necks. It turned out that the im-plementation of the Visitor pattern in Renters had a bug, which resulted in incorrect invocations of the method checkWildFireArea. Even though it did not contribute anything to computing insurance quote, it consumed signifi-cant resources. After implementing a fix based on the feed-back from FOREPOST, the performance of Renters went up by approximately seven per cent, thus addressing RQ2 that
FOREPOST is effective in identifying bottlenecks.
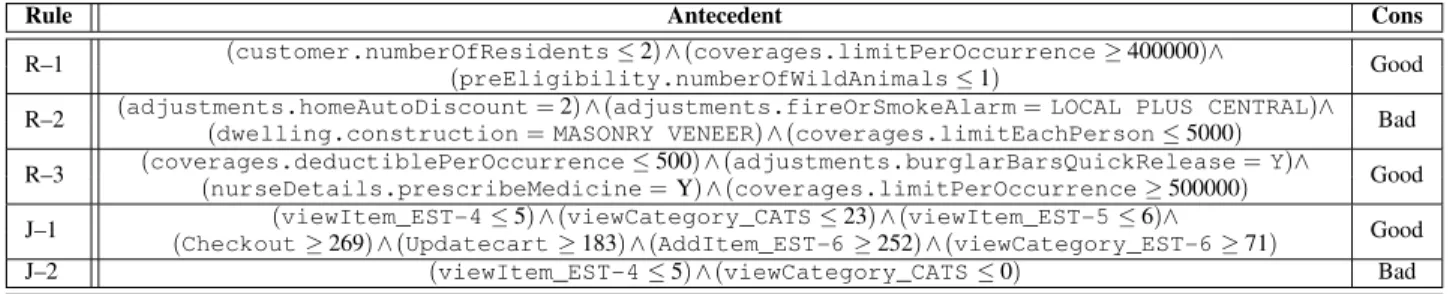
3) Learned Rules: Examples of learned rules are shown in Table II. When professionals from the insurance company looked at these and other rules in more depth, they identified certain patterns that indicated that these rules were logical and matches some requirements. For example, the rulesR-1 and R-3 point out to strange and inconsistent insurance quote inputs, where low deductible goes together with very high coverage limit, and it is combined with the owner of the condo taking prescribed medications, and with the condo having fewer than two residents. All these inputs point to situation that are considered higher risk insurance policies. These classes of input values trigger more computations that lead to significantly higher workloads.
Table II
SELECTED RULES THAT ARE LEARNED FORRENTERS ANDJPETSTORE,WHERE THE FIRST LETTERS OF THE NAMES OF THEAUTS ARE USED IN THE NAMES OF RULES TO DESIGNATE TO WHICHAUTS THESE RULES BELONG. THE LAST COLUMN, CONS DESIGNATES THE CONSEQUENT OF THE RULE
THAT CORRESPONDS TO GOOD AND BAD TEST CASES THAT THESE RULES DESCRIBE.
Rule Antecedent Cons
R–1 (customer.numberOfResidents≤2)∧(coverages.limitPerOccurrence≥400000)∧ Good
(preEligibility.numberOfWildAnimals≤1)
R–2 (adjustments.homeAutoDiscount=2)∧(adjustments.fireOrSmokeAlarm=LOCAL PLUS CENTRAL)∧ Bad
(dwelling.construction=MASONRY VENEER)∧(coverages.limitEachPerson≤5000)
R–3 (coverages.deductiblePerOccurrence≤500)∧(adjustments.burglarBarsQuickRelease=Y)∧ Good
(nurseDetails.prescribeMedicine=Y)∧(coverages.limitPerOccurrence≥500000)
J–1 (viewItem_EST-4≤5)∧(viewCategory_CATS≤23)∧(viewItem_EST-5≤6)∧ Good
(Checkout≥269)∧(Updatecart≥183)∧(AddItem_EST-6≥252)∧(viewCategory_EST-6≥71)
J–2 (viewItem_EST-4≤5)∧(viewCategory_CATS≤0) Bad
For JPetSore, rules J-1and J-2describe inputs as the number of occurrences of URLs in transactions, where URLs are shown using descriptive names (e.g., Checkout for the URL that enables customers to check out their shopping carts). It is important that rules for both applications are input-specific. While we do not expect that rules learned for one system to apply to a completely different system, training a new set of rules using the same algorithm should deliver similar benefits.
VI. RELATEDWORK
Partition testing is a set of strategies that divides the program’s input domain into subdomains (subsets) from which test cases can be derived to cover each subset at least once [7, pages 150-152]. Closely related is the work by Dickinson et al [33], which use clustering analysis execution profiles to find failures among the executions induced by a set of potential test cases. Although we both used clustering techniques, our work differs in that we cluster the execution profiles based on the length of the execution time and number of methods have been invoked, and we target the performance bugs instead of functional errors.
Finally, learning rules helps stakeholders to reconfig-ure distributed systems online to optimize for dynamically changing workloads [34]. It is similar to FOREPOST in using the learning methodology to to learn rules, from only low-level system statistics, which of a set of possible hard-ware configurations will lead to better performance under the current unknown workload. In contrast, FOREPOST uses feedback-directed adaptive performance test scripts to locate most computationally intensive execution profiles and bottlenecks.
Related to FOREPOST is a technique for automatically classifying execution data, collected in the field, as coming from either passing or failing program runs [35]. This tech-nique attempts to learn a classification model to predict if an application run failed using execution data. FOREPOST, on the other hand, learns rules that it uses to select input test data that steer applications towards computationally intensive runs to expose performance problems.
In their recent work, Zhang, Elbaum, and Dwyer generate performance test cases using dynamic symbolic execution [6]. Similar to FOREPOST, they use heuristics that guide generation of test cases by determining paths of executions that can introduce higher workloads. Unlike FOREPOST, white-box testing approach is used thus requiring access to source code while FOREPOST is a black-box approach. It is also unclear how this approach will scale to industrial applications with over 100KLOC. We view these approaches as complementary, where a hybrid approach may combine the benefits of both approach in a gray-box performance testing. Doing it is a subject of future work.
VII. CONCLUSION
We offer a novel solution for finding performance prob-lems in applications automatically using black-box soft-ware testing. Our solution is an adaptive, feedback-directed learning testing system that learns rules from execution traces of applications and uses these rules to select test input data for these applications automatically to find more performance problems when compared with random testing. We have implemented our solution and applied it to a nontrivial application at a major insurance company and to an open-source application. Performance problems were found automatically in both applications and confirmed by experienced testers and developers.
ACKNOWLEDGMENTS
We warmly thank Aswathy Nair, a graduate student from the University of Illinois at Chicago who contributed to FOREPOST as part of her work towards the completion of her Master of Science in Computer Science degree. We are grateful to the anonymous ICSE’12 reviewers for their relevant and useful comments and suggestions, which helped us to significantly improve an earlier version of this paper. This work is supported by NSF 0916139, CCF-1017633, a major insurance company, and Accenture.
REFERENCES
[1] I. Molyneaux, The Art of Application Performance Testing: Help for Programmers and Quality Assurance. O’Reilly Media, Inc., 2009.
[2] E. J. Weyuker and F. I. Vokolos, “Experience with perfor-mance testing of software systems: Issues, an approach, and case study,” IEEE Trans. Softw. Eng., vol. 26, no. 12, pp. 1147–1156, 2000.
[3] Z. M. Jiang, A. E. Hassan, G. Hamann, and P. Flora, “Au-tomated performance analysis of load tests,” inICSM, 2009, pp. 125–134.
[4] A. Avritzer and E. J. Weyuker, “Generating test suites for software load testing,” inISSTA. New York, NY, USA: ACM, 1994, pp. 44–57.
[5] IEEE,IEEE Standard Computer Dictionary: A Compilation of IEEE Standard Computer Glossaries. Institute of Electrical and Electronics Engineers, January 1991.
[6] P. Zhang, S. G. Elbaum, and M. B. Dwyer, “Automatic generation of load tests,” inASE, 2011, pp. 43–52.
[7] P. Ammann and J. Offutt,Introduction to Software Testing. New York, NY, USA: Cambridge University Press, 2008. [8] K. Beck, Test-Driven Development: By Example, ser. The
Addison-Wesley Signature Series. Addison-Wesley, 2003. [9] D. R. Faught, “Exploratory load testing,” stickyminds.com,
2011. [Online]. Available: www.stickyminds.com/s.asp?F= S10144 COL 2
[10] J. Bach, “What is exploratory testing?” stickyminds.com, 2011. [Online]. Available: www.stickyminds.com/r.asp?F= DART 2255
[11] M. K. Aguilera, J. C. Mogul, J. L. Wiener, P. Reynolds, and A. Muthitacharoen, “Performance debugging for distributed systems of black boxes,” inSOSP, 2003, pp. 74–89. [12] G. Ammons, J.-D. Choi, M. Gupta, and N. Swamy, “Finding
and removing performance bottlenecks in large systems,” in
ECOOP, 2004, pp. 170–194.
[13] W. Cornelissen, A. Klaassen, A. Matsinger, and G. van Wee, “How to make intuitive testing more systematic,”IEEE Softw., vol. 12, no. 5, pp. 87–89, 1995.
[14] C. Kaner, “What is a good test case?” in Software Testing Analysis & Review Conference (STAR) East. STAR, 2003. [15] G. J. Myers,Art of Software Testing. New York, NY, USA:
John Wiley & Sons, Inc., 1979.
[16] M. Grindal, J. Offutt, and S. F. Andler, “Combination test-ing strategies: A survey,”Software Testing, Verification, and Reliability, vol. 15, pp. 167–199, 2005.
[17] E. Dustin, J. Rashka, and J. Paul,Automated Software Testing: Introduction, Management, and Performance. Addison-Wesley, Sep 2004.
[18] M. Fewster and D. Graham,Software Test Automation: Effec-tive Use of Test Execution Tools. Addison-Wesley, September
1999.
[19] C. Kaner, “Improving the maintainability of automated test suites,”Software QA, vol. 4, no. 4, 1997.
[20] S. Parsons, “Independent component analysis: A tutorial introduction,”Knowl. Eng. Rev., vol. 20, no. 2, pp. 198–199, 2005.
[21] A. Hyv¨arinen and E. Oja, “Independent component analysis: algorithms and applications,”Neural Netw., vol. 13, no. 4-5, pp. 411–430, 2000.
[22] S. Grant, J. R. Cordy, and D. Skillicorn, “Automated concept location using independent component analysis,” in WCRE ’08. Washington, DC, USA: IEEE Comp. Soc., 2008, pp. 138–142.
[23] D. L. Parnas, “On the criteria to be used in decomposing systems into modules,”Communications of the ACM, vol. 15, pp. 1053–1058, 1972.
[24] P. L. Tarr, H. Ossher, W. H. Harrison, and S. M. S. Jr., “ degrees of separation: Multi-dimensional separation of concerns,” in ICSE, 1999, pp. 107–119.
[25] W. W. Cohen, “Fast effective rule induction,” in Twelfth ICML. Morgan Kaufmann, 1995, pp. 115–123.
[26] I. H. Witten and E. Frank,Data Mining: Practical Machine Learning Tools and Techniques. Morgan Kaufmann, 2005. [27] D. L. Bird and C. U. Munoz, “Automatic generation of
random self-checking test cases,” IBM Syst. J., vol. 22, pp. 229–245, September 1983.
[28] R. Hamlet, “Random testing,” inEncyclopedia of Software Engineering. Wiley, 1994, pp. 970–978.
[29] M. B. Cohen, P. B. Gibbons, W. B. Mugridge, and C. J. Colbourn, “Constructing test suites for interaction testing,” in
ICSE, 2003, pp. 38–48.
[30] M. Grindal, J. Offutt, and S. F. Andler, “Combination testing strategies: a survey,”Softw. Test., Verif. Reliab., vol. 15, no. 3, pp. 167–199, 2005.
[31] A. Arcuri and L. C. Briand, “A practical guide for using statistical tests to assess randomized algorithms in software engineering,” inICSE, 2011, pp. 1–10.
[32] E. J. Weyuker and B. Jeng, “Analyzing partition testing strategies,”IEEE Trans. Softw. Eng., vol. 17, no. 7, pp. 703– 711, 1991.
[33] W. Dickinson, D. Leon, and A. Podgurski, “Finding failures by cluster analysis of execution profiles,” inICSE, 2001, pp. 339–348.
[34] J. Wildstrom, P. Stone, E. Witchel, and M. Dahlin, “Machine learning for on-line hardware reconfiguration,” in IJCAI’07, San Francisco, CA, USA, 2007, pp. 1113–1118.
[35] M. Haran, A. Karr, A. Orso, A. Porter, and A. Sanil, “Apply-ing classification techniques to remotely-collected program execution data,” in ESEC/FSE-13. New York, NY, USA: ACM, 2005, pp. 146–155.