USER GUIDE
For Research, Forensic, Paternity and Cell Line Authentication. Not for use in Diagnostic and Therapeutic applications.
HID Real-Time PCR Analysis Software
Version 1.2
for use with:
7500 Real-Time PCR Instruments
Quantifiler
®DNA Quantification Kits
Publication Number MAN0009819The information in this guide is subject to change without notice.
DISCLAIMER
TO THE EXTENT ALLOWED BY LAW, LIFE TECHNOLOGIES AND/OR ITS AFFILIATE(S) WILL NOT BE LIABLE FOR SPECIAL, INCIDENTAL, INDIRECT, PUNITIVE, MULTIPLE, OR CONSEQUENTIAL DAMAGES IN CONNECTION WITH OR ARISING FROM THIS DOCUMENT, INCLUDING YOUR USE OF IT.
Limited Use Label License No. 540: Sequencing or Fragment Analysis Intellectual Property for Human Identity Testing Software:
Notice to Purchaser: No right to resell this software product, any upgrades, modified versions, updates, additions, copies, or any of its components is conveyed expressly, by implication, or by estoppel. This software product may be used to perform internal research and development for the sole benefit of the purchaser; provided, however, that Life Technologies Corporation ("LTC") does not convey any right or license, whether expressly, by implication, by estoppels, or otherwise, under any LTC patents that claim DNA sequencing or fragment analysis methods, to the purchaser by the purchase of this software product to use such DNA sequencing or fragment analysis methods. This software product is not for use in commercial applications of any kind, including, without limitation, quality control and commercial services such as reporting the results of purchaser's activities for a fee or other form of consideration, except as follows. A limited license to use the DNA sequencing or fragment analysis methods covered by such patents can be obtained for certain research and development activities (a) through the purchase of certain LTC reagents that convey rights for commercial use (e.g., LTC kits for performing human identity testing and LTC kits for performing in vitro diagnostics testing) when such reagents are used on an authorized LTC instrument, or (b) directly from LTC. In addition, LTC grants the purchaser a limited right to use this software product in conjunction with: (1) a second product purchased from LTC or that conveys rights for commercial use (e.g., LTC kits for performing human identity testing and LTC kits for performing in vitro diagnostics testing) and (2) an authorized LTC instrument that conveys rights for commercial use to perform services on a fee per test or contract basis. For information on obtaining additional rights, please contact [email protected] or Out Licensing, Life Technologies, 5791 Van Allen Way, Carlsbad, California 92008.
TRADEMARKS
All trademarks are the property of Thermo Fisher Scientific and its subsidiaries unless otherwise specified. TaqMan is a registered trademark of Roche Molecular Systems, Inc, TaqMan used under permission and license. Microsoft, Windows, PowerPoint, and Excel are registered trademarks of Microsoft Corporation.
Adobe, Acrobat, and Reader are registered trademarks of Adobe Systems, Inc.
Pentium and Intel are registered trademarks and Core is a trademark of Intel Corporation. © 2015 Thermo Fisher Scientific Inc.. All rights reserved.
Contents
3
HID Real-Time PCR Analysis Software v1.2 Getting Started Guide
About This Guide . . . 7
Purpose . . . 7
Revision history . . . 7
CHAPTER 1
Get Started . . . 9
Software overview . . . 9
Features in v1.2 . . . 10
Install or upgrade to v1.2 . . . 10
Calibrate the Instrument . . . 13
CHAPTER 2
Customize the Software . . . 17
Modify a default experiment template . . . 17
Create an experiment template . . . 18
Link your template to a Home screen button . . . 18
Set display defaults . . . 19
CHAPTER 3
Select the Experiment and Set Up a Plate . . . 21
HID Real-Time PCR Analysis Software workflow . . . 22
Start the software and select an experiment . . . 23
Navigate the software . . . 24
Specify experiment properties . . . 25
Define samples and view targets . . . 26
Assign the targets, samples, and standards to wells . . . 28
Save plate layout as *.eds or template . . . 32
Link your template to a Home screen button . . . 33
CHAPTER 4
Run the Plate . . . 35
View the run method . . . 35
Set notifications . . . 37
Start or stop the run . . . 38
Monitor the run . . . 38
Contents
CHAPTER 5
Select Analysis Settings and Thresholds . . . 41
Open analysis settings . . . 41
View/Edit CT settings . . . 42
Enter HID settings . . . 43
Enter Flag settings . . . 46
CHAPTER 6
Enhance Data Analysis . . . 49
View the analysis results . . . 50
Interpret QC flag information . . . 52
Omit wells from analysis . . . 53
Omit targets in an experiment well . . . 54
Examine the Degradation Index . . . 54
Change the appearance of, print, and save plots . . . 55
CHAPTER 7
Export and Report Results . . . 57
Overview . . . 57
Export data . . . 57
Print a report . . . 59
CHAPTER 8
Generate Dilution and Reaction Worksheets for STR Setup . . . . 61
Overview . . . 61
Add kits to an experiment . . . 61
Select unknown samples for amplification . . . 62
Edit dilution settings for individual samples . . . 63
View the dilution scheme . . . 64
Export dilution and reaction worksheets . . . 64
Save new STR Kit information from an experiment into STR Kit Library . . . 64
CHAPTER 9
HID Real-Time PCR Analysis Software Validation . . . 65
Introduction . . . 65
Materials and methods . . . 66
Experiments and results . . . 66
5
HID Real-Time PCR Analysis Software v1.2 Getting Started Guide
Contents
Documentation and Support . . . 73
How to use your documentation . . . 73
Obtaining related documentation . . . 74
Obtaining information from the Help system . . . 74
Obtaining support . . . 75
Limited product warranty . . . 75
7
HID Real-Time PCR Analysis Software v1.2 Getting Started Guide
About This Guide
Purpose
The 7500 Real-Time PCR System and HID Real-Time PCR Analysis Software detects and quantifies human and/or male DNA in samples. This guide is intended to help you quickly learn how to use the HID Real-Time PCR Analysis Software to perform analysis of samples prepared with the:
• Quantifiler® HP DNA Quantification Kit • Quantifiler® Trio DNA Quantification Kit • Quantifiler® Human DNA Quantification Kit • Quantifiler® Duo DNA Quantification Kit
• Quantifiler® Y Human Male DNA Quantification Kit This guide assumes that:
• You are familiar with the Microsoft® Windows® operating system, the Internet, and Internet browsers.
• You know how to handle DNA samples and prepare them for PCR.
Use this guide after your plate is prepared and loaded in the 7500 Real-Time PCR System.
For instructions on preparing a plate, refer to the user guide for the Quantifiler® Kit you are using.
Revision history
Revision Description Date
A.0 New document for version 1.2 features (support for Quantifiler® Trio and HP DNA
Quantification Kits; Degradation Index). Incorporates all information from the HID Real-Time PCR Analysis Software v1.1 User Guide (Pub. no. 4455443)
January 2014
B.0 Added Chapter 9, “HID Real-Time PCR Analysis Software Validation” on page 65.
About This Guide Revision history
C.0 Correct quencher listed for Quantifier® Duo
and Quantifier® Male or Human kits.
Add reference to evaluating the quality indices determined by the HID Real-Time PCR Software to determine if highly degraded samples can be better analyzed with the Ion Personal Genome Machine™ (PGM™) System,refer to the Quantifiler® HP and Trio DNA Quantification Kits User Guide.
July 2015
9
HID Real-Time PCR Analysis Software v1.2 Getting Started Guide
1
CHAPTER 1
Get Started
This chapter covers:
■ Software overview . . . 9
■ Features in v1.2 . . . 10
■ Install or upgrade to v1.2. . . 10
■ Calibrate the Instrument . . . 13
Software overview
HID Real-Time PCR Analysis Software is designed specifically to assist human identification laboratories performing DNA quantitation, by simplifying assay setup and streamlining data review and dilution and reaction setup for downstream STR analysis. For example, the software automatically selects the appropriate Quantifiler® Kit target, reporter, quencher, and thermal profile. After a run, the HID Real-Time PCR Analysis Software provides an analysis of each well. The software exports:
• All results
• STR kit setup instructions • Sample dilutions calculations
HID Real-Time PCR Analysis Software is for use with the 7500 Real-Time PCR Instrument only.
Applicable HID kits
You can use the HID Real-Time PCR Analysis Software with the following kits: • Quantifiler® HP DNA Quantification Kit
• Quantifiler® Trio DNA Quantification Kit • Quantifiler® Human DNA Quantification Kit • Quantifiler® Duo DNA Quantification Kit
• Quantifiler® Human Male DNA Quantification Kit
Custom experiment option
You can also use the HID Real-Time PCR Analysis Software for more complex
experiments by selecting the Custom Assay option on the Home screen. If you use the Custom Assay option, refer to the Applied Biosystems 7500/7500 Fast Real-Time PCR System Getting Started Guide for Standard Curve Experiments for instructions.
Chapter 1 Get Started Features in v1.2
1
Features in v1.2
HID Real-Time PCR Analysis Software v1.2 includes all of the v1.1 functionality and includes the following new features:
• Support for Microsoft® Windows® 7 operating system
• Experiment templates for new Quantifiler® DNA Kits: Quantifiler® HP and Trio Kits
• Updated STR library preloaded with additional STR kits:
– AmpFlSTR® Identifiler® Plus PCR Amplification Kit (28 and 29 cycles) – AmpFlSTR® NGM™ PCR Amplification Kit (29 and 30 cycles)
– AmpFlSTR® NGM SElect™ PCR Amplification Kit (29 and 30 cycles) – GlobalFiler™ PCR Amplification Kit
• Degradation Index for use in conjunction with IPC CT to evaluate potential DNA degradation and/or presence of PCR inhibitors that could affect STR analysis • Simplified default display for the Well Table view
Install or upgrade to v1.2
Refer to the 7500/7500 Fast Real-Time PCR System Site Preparation Guide (Pub. no. 4412843) for system layout, electrical, power, safety, and other site requirements.
Computer and instrument requirements
Component Recommended Requirements
Computer • Processor (minimum speed: 2.7 GHz): – Core™ 2 Duo CPU E8400 3.0 GHz *2
or
– Intel® Core™ i7-2620M CPU 2.7 GHz *2 • 1 GB RAM1
• One hard drive with at least 10 GB available • 20/48X IDE CD-ROM drive
• USB v1.2
• Ethernet network interface adapter (10BASE-T)2§
• Operating system:
11
HID Real-Time PCR Analysis Software v1.2 Getting Started Guide
Chapter 1 Get Started Install or upgrade to v1.2
1
Install with new instrument
If the HID Real-Time PCR Analysis Software is installed with a new 7500 Real-Time PCR System, both the instrument and the software must be installed by an Life Technologies technical representative.
If you have the instrument but no 7500 Software installed, you can install v1.2 directly. Insert the HID Real-Time PCR Analysis Software CD and follow the Installation Wizard instructions.
Upgrade from v1.1 to v1.2
IMPORTANT! Do not uninstall v1.1 before following this procedure. If v1.1 is not present, the upgrade will not run.
IMPORTANT! You must have Administrator privileges to perform this upgrade.
1.
Insert the HID Real-Time PCR Analysis Software v1.2 CD.The v1.2 upgrade installer automatically backs up the v1.1 calibration,
experiments, and log files, then uninstalls v1.1. After the v1.2 software installation is complete, you can restore the backed-up files to the appropriate folders as described in step 4.
2.
Follow the Installation Wizard instructions.Note: If installing on a computer connected to the instrument, make sure that you enter the same instrument serial number that was entered when v1.1 was
installed.
3.
Enter the Upgrade Registration Code provided with the installation CD. Do not enter any spaces between the numbers in the registration code.Monitor • 1280 × 1024 pixel resolution for full screen display3
• 16-inch
• True Color (32 bit) • UL listed
Instrument Instrument firmware G2.10 (installed on all instruments purchased after 2008) If your instrument was
purchased before 2008, check the version of firmware installed by going to
x:/Applied Biosystems/7500 system/firmware. The example below shows firmware G2.09. Contact Life Technologies if your firmware version is not G2.10.
1 The software may experience communication errors if run on computers with less than 1 GB. 2 § Required only if you plan to connect the computer to a local area network (LAN).
3 If screen resolution is not set to 1280 X 1024, the Analysis Summary screen may not be properly displayed.
Chapter 1 Get Started Install or upgrade to v1.2
1
4.
(If installing on a computer connected to the instrument) After installation sucessfully completes, copy the calibration and experiments files from the back-up folders to the appropriate folders:Note: During installation, the v1.1 log files are backed up to the\<install location>\7500\backup\config\logs\<date stamp> folder. These log files do not need to be reinstalled.
5.
Make sure that all calibrations are up-to-date. See “Calibration procedure” on page 13 for instrument calibration requirements.Replace SDS Software v1.2.3
1.
Review “Computer and instrument requirements” on page 10 and ensure that your system meets the requirements.2.
Archive all experiment and calibration data.3.
Uninstall the SDS Software v1.2.3.IMPORTANT! If the SDS Software v1.2.3 is present, the installation will not run.
4.
Insert the HID Real-Time PCR Analysis Software CD.5.
Enter the Full Installation Registration Code provided with the installation CD.6.
Follow instructions of the installation wizard.7.
Make sure that all calibrations are up-to-date. See “Calibration procedure” on page 13 for instrument calibration requirements.7500 Real-Time PCR Instruments purchased before February 2008
Tower and laptop computers of 7500 Real-Time PCR Instruments purchased before February 2008 require a memory upgrade before the computers can install the HID
Calibration files
From \<install location>\7500\backup\calibration\
<date stamp>\eclipse\plugins\
com.apldbio.sds.instrument.sds7500_1.0.0\ config\
To \<install location>\7500\eclipse\plugins
\com.apldbio.sds.instrument.sds7500_1.0.0\config\
Experiments files
From \<install location>\7500\backup\experiments\<date stamp>
13
HID Real-Time PCR Analysis Software v1.2 Getting Started Guide
Chapter 1 Get Started Calibrate the Instrument
1
Calibrate the Instrument
Required materials
Table 1 lists the materials needed to perform the instrument calibration.
Table 1 User-supplied materials
Calibration procedure
Below is an outline of the calibration procedure. Refer to Applied Biosystems® 7500/
7500 Fast Real-Time PCR Systems System Maintenance (Pub. no. 4387777) for complete instructions.
Perform:
• Regions of Interest (ROI) calibration • Background Calibration
• Optical Calibration • Dye Calibration:
– Perform Dye Calibration of the new ABY®, JUN® and Mustang Purple® (MP) dyes. Follow the custom dye procedure.
– Perform Dye Calibration of all system dyes for new instrument installations, or if replacing SDS v.1.2.3
– Use 60 °C as the default temperature for all dye calibration • RNase P Instrument Verification Plate run
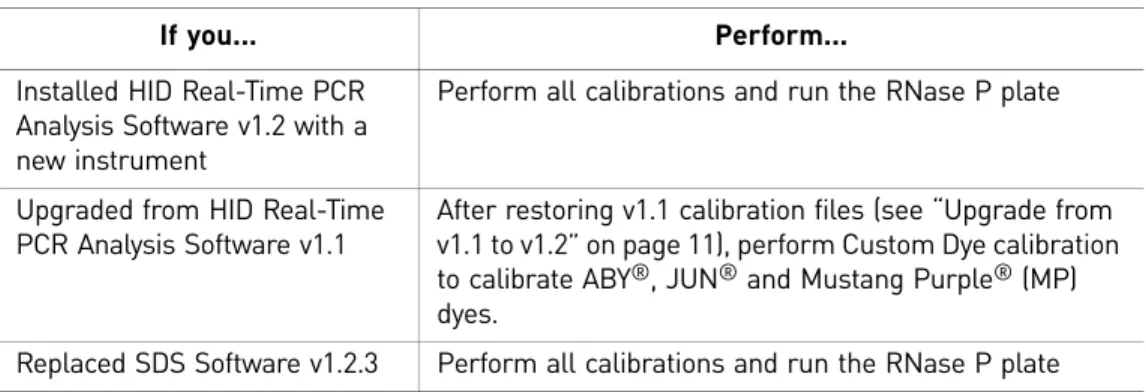
If you... Perform...
Installed HID Real-Time PCR Analysis Software v1.2 with a new instrument
Perform all calibrations and run the RNase P plate
Upgraded from HID Real-Time PCR Analysis Software v1.1
After restoring v1.1 calibration files (see “Upgrade from v1.1 to v1.2” on page 11), perform Custom Dye calibration to calibrate ABY®, JUN® and Mustang Purple® (MP) dyes.
Replaced SDS Software v1.2.3 Perform all calibrations and run the RNase P plate
If you... Material Cat. no.
Replaced SDS Software v1.2.3
7500 Real Time PCR Systems Spectral Calibration Kit I
4349180 TaqMan® RNase P Instrument Verification Plate 4350584
Upgraded from HID v1.1
or
Replaced SDS v.1.2.3
96-Well Spectral Calibration Plate with ABY® Dye 4461591
96-Well Spectral Calibration Plate with JUN® Dye 4461593
96-Well Spectral Calibration Plate with Mustang Purple® Dye
Chapter 1 Get Started Calibrate the Instrument
1
New dye spectra
Figure 1 through Figure 3 show the calibration spectra for ABY®, JUN® and Mustang Purple® (MP) dyes.
Figure 1 ABY® dye spectra
15
HID Real-Time PCR Analysis Software v1.2 Getting Started Guide
Chapter 1 Get Started Calibrate the Instrument
1
Chapter 1 Get Started Calibrate the Instrument
17
HID Real-Time PCR Analysis Software v1.2 Getting Started Guide
2
CHAPTER 2
Customize the Software
This chapter covers:
■ Modify a default experiment template . . . 17
■ Create an experiment template. . . 18
■ Link your template to a Home screen button. . . 18
■ Set display defaults . . . 19
Modify a default experiment template
You can make changes to the experiment templates provided with the software after making a backup copy of the original templates.
Save a copy of the original template
Before you modify a template, save a copy of the original template:
1.
Navigate to C:\Applied Biosystems\7500\config\templates.2.
Select EditCopy to copy the folder C:\AppliedBiosystems\7500\config\templates.
3.
Navigate to a safe location on your computer.4.
Select EditPaste to insert a copy of the templates folder in the location you select.Modify the original template
1.
Click the button on the Home screen for the experiment type of interest.2.
Modify the template as needed, including:• Moving standards and NTCs to different wells • Adding samples and/or extraction blanks • Setting plate layout
• Setting the display defaults for the Amplification plot, plate view, and well table
• Modifying analysis settings (HID, CT, and Flags)
3.
Click the down arrow next to Save in the toolbar, then in the drop-down list, then select Save as, then select the name of the original template.Chapter 2 Customize the Software Create an experiment template
2
Create an experiment template
1.
Set up an experiment with the desired settings, including: • Moving standards and NTCs to different wells • Adding samples and/or extraction blanks • Setting plate layout• Setting the display defaults for the Amplification plot, plate view, and well table
• Modifying analysis settings (HID, CT, and Flags)
2.
Click the down arrow next to Save in the toolbar, then select Save as Template. To use your template instead of a default template, click Open at the top of the Home screen, then select your template instead of clicking a button for an experiment type.Link your template to a Home screen button
You can link your template to the any of the Quantifiler® assay icons on the Home screen for:
The software will automatically use the template as the default experiment when you click the corresponding button. You will still be able to use a different template by opening a different experiment.
1.
Before you link your template file to a button on the Home screen, save a copy of the original template:a. Navigate to C:\Applied Biosystems\7500\config\templates. b. Select EditCopy to copy the folder C:\Applied
Biosystems\7500\config\templates.
c. Navigate to a safe location on your computer.
d. Select EditPaste to insert a copy of the templates folder in the location you select.
2.
Link your template to a button on the Home screen:a. In the toolbar, from the file that you want to link, click the down arrow next to Save.
b. In the drop-down menu, select Save as Template. c. Navigate to C:\Applied Biosystems\7500\config\templates.
19
HID Real-Time PCR Analysis Software v1.2 Getting Started Guide
Chapter 2 Customize the Software Set display defaults
2
d. Select the file corresponding to the assay button that you want to replace.
IMPORTANT! Be sure to give the file exactly the same name as the file corresponding to the button that you want to replace.
e. Click Save.
Set display defaults
Select information to display in the Plate View
1.
Click Show in Wells to open the drop-down list.2.
Click the checkbox next to an item of data to select ( ) the item for display or to deselect it ( ).3.
Click Set as Default (this button is dimmed before you change a setting, or if you are logged in as Guest).Specify the information to display in the Well Table
1.
Click Show in Table to open the drop-down list.2.
Click the checkbox next to an item of data to select ( ) the item for display or to deselect it ( ).3.
Click Set as Default (this button is dimmed before you change a setting, or if you are logged in as Guest).Customize the amplification plot
1.
Make changes as described in “Change the appearance of, print, and save plots” on page 55.2.
Click the checkbox next to an item of data to select ( ) the item for display or to deselect it ( ).3.
Click Save Current Settings as Default (this button is dimmed before you change a setting, or if you are logged in as Guest).Chapter 2 Customize the Software Set display defaults
21
HID Real-Time PCR Analysis Software v1.2 Getting Started Guide
3
CHAPTER 3
Select the Experiment and Set Up a
Plate
This chapter covers:
■ HID Real-Time PCR Analysis Software workflow . . . 22
■ Start the software and select an experiment . . . 23
■ Navigate the software . . . 24
■ Specify experiment properties . . . 25
■ Define samples and view targets . . . 26
■ Assign the targets, samples, and standards to wells . . . 28
■ Save plate layout as *.eds or template . . . 32
■ Link your template to a Home screen button. . . 33 This chapter assumes that you have prepared a plate according to the instructions in the user guide for the Quantifiler® Kit you are using.
Chapter 3 Select the Experiment and Set Up a Plate HID Real-Time PCR Analysis Software workflow
3
HID Real-Time PCR Analysis Software workflow
Select the experiment and set up a plate: 1. Start the software.
2. Start a new experiment. 3. Specify experiment properties.
4. Define samples and assign targets, samples, and standards to wells.
5. Save the experiment.
Review results:
1. View analysis summary. 2. View quantitation results.
Select analysis settings and thresholds: • HID settings (includes HID flags) • Flag settings
Export and print results.
Set up a Quantifiler® chemistry kit plate and load in the instrument.
Run the plate.
Perform PCR amplification.
HID Real
-T
ime PCR Analysis Sof
tware
Generate dilution and reaction worksheets for STR set up:
1. Configure STR Library and default dilution settings.
2. Add kits to an experiment.
3. Select the unknown samples for amplification. 4. Edit dilution settings for individual samples as
needed.
23
HID Real-Time PCR Analysis Software v1.2 Getting Started Guide
Chapter 3 Select the Experiment and Set Up a Plate Start the software and select an experiment
3
Start the software and select an experiment
1.
On your desktop, double-click or select StartAll ProgramsApplied BiosystemsHID Real-Time PCR Analysis Software to open the Login Screen. The screen should open within 1 minute.2.
In the User Name field, enter your user name or select it from the drop-down list. You can log in as a guest, but only users logged in with a user name can:• Edit the names of folders for experiment information import, information export, or data.
• Enable or disable the requirement to enter a user name to start the software. • Set a plate layout as the default layout (See “Link your template to a Home
screen button” on page 33).
• Configure how data is displayed (see Chapter 2, “Customize the Software”).
3.
Click OK to open the Home screen with icons for HID and Custom Assays asshown.
Chapter 3 Select the Experiment and Set Up a Plate Navigate the software
3
4.
Choose an HID experiment:• Click one of the HID template icons: – Quantifiler® HP
– Quantifiler® Trio
– Quantifiler® Duo
– Quantifiler® Male
– Quantifiler® Human
– Quantifiler® Male & Human (hybrid plate)
or
• In the toolbar, click the down arrow next to New Experiment to open the drop-down list and select the appropriate experiment.
For custom experiments
To perform a non-HID experiment, or a modified experiment, click: • Custom Assay on the right side of the Home screen.
or
• Assays in the toolbar, then select Custom Assays in the drop-down list.
For information on running custom experiments, refer to the 7500/7500 Fast Real-Time PCR System Getting Started Guide for Standard Curve Experiments.
Navigate the software
Each HID Real-Time PCR Analysis Software experiment screen displays instructions for a step in the experiment. Use the Experiment Menu at the left of any screen to navigate the software.
Click >> (Expand) to expand the Experiment Menu. Click << (Collapse) to collapse the Experiment Menu.
Click Setup, Run, or Analysis, to display screens used in the corresponding process.
You can access HID Real-Time PCR Analysis Software screens in any sequence.
To return to the Home screen at any time, click (Home) at the bottom left of any screen.
25
HID Real-Time PCR Analysis Software v1.2 Getting Started Guide
Chapter 3 Select the Experiment and Set Up a Plate Specify experiment properties
3
Specify experiment properties
1.
In the Experiment Menu, select SetupExperiment Properties.2.
In the “How do you want to identify this experiment?” section, enter the name of the plate or experiment information in the Experiment Name field. Entries in the other fields are optional.Note: The name you enter in the Experiment Name field appears on the data report and on *.xls spreadsheets of data that you export. If you do not enter a name, “Untitled” appears on the report and in the exported spreadsheet.
The following parameters are automatically set: • Instrument: 7500 (96 wells)
• Experiment: Quantitation-HID Standard Curve • Reagents: TaqMan® Reagents
• Ramp Speed: Standard (~1 hour to complete a run for Quantifiler® HP and Quantifiler® Trio kits, and ~2 hours for all other Quantifiler® kits)
Chapter 3 Select the Experiment and Set Up a Plate Define samples and view targets
3
Define samples and view targets
Note: Targets are automatically listed and named. Standards dilutions and an NTC sample are listed by default for each Quantifiler® Kit. For information about the standard included in the Quantifiler® Kit, refer to your Quantifiler® Kit user guide (see “How to use your documentation” on page 73).
Define samples
1.
In the Experiment Menu, click SetupPlate Setup. Select the Define Targets and Samples tab.2.
In the Define Samples area on the right side of the pane, specify sample names.• To define a new sample:
– Click Add New Sample. A new line appears in the Sample Name field, or
– In the toolbar, select Sample Library to open the sample library screen, then click New.
27
HID Real-Time PCR Analysis Software v1.2 Getting Started Guide
Chapter 3 Select the Experiment and Set Up a Plate Define samples and view targets
3
3.
Select the sample type: Standard, NTC, or Unknown. Unknown is the default sample type for new samples. When you assign the sample type, the software automatically assigns the appropriate task to each target.4.
Repeat steps 2 and 3 for each sample.IMPORTANT! List each sample individually. For replicates (identical samples), add the sample name only once. To assign the replicate to a well in the plate, in step 4 on page 29, select the well, then select the check box next to the sample name.
View targets
1.
In the Experiment Menu, select SetupPlate Setup.2.
Select the Define Targets and Samples tab.3.
In the Defined Targets area on the left side of the pane, view the targets list to verify that you selected the correct experiment in step 4 on page 24.Change color
designation
To change the color that represents a target in the data analysis:
1.
Click (down arrow) in the Color column.2.
Select a color in the drop-down list.Kit Reporter dyes Quencher
Quantifiler® Trio Small autosomal: VIC® dye NFQ-MGB
Male (Y): FAM™ dye NFQ-MGB
Large autosomal: ABY® dye QSY7
IPC: JUN® dye QSY7 Quantifiler® HP Small autosomal: VIC® dye NFQ-MGB
Large autosomal: ABY® dye QSY7
IPC: JUN® dye QSY7
Quantifiler® Duo Human: VIC® dye NFQ-MGB
Male: FAM™ dye NFQ-MGB IPC: NED™ dye NFQ-MGB
Quantifiler® Male or
Human
Human: FAM™ dye NFQ-MGB
Male: FAM™ dye NFQ-MGB
Chapter 3 Select the Experiment and Set Up a Plate Assign the targets, samples, and standards to wells
3
Assign the targets, samples, and standards to wells
Go to the Assign Targets and Samples tab.
In the Define Targets and Samples tab, click Assign Targets and Samples beneath the Define Samples area.
or
In the Experiment Menu, select SetupPlate Setup, then select the Assign Targets and Samples tab.
Assign Using Plate Layout
Assign samples,
standards, and NTCs
to wells
To assign samples, standards, and NTCs using the View Plate Layout tab:
1.
Select the View Plate Layout tab in the pane on the right of the screen.29
HID Real-Time PCR Analysis Software v1.2 Getting Started Guide
Chapter 3 Select the Experiment and Set Up a Plate Assign the targets, samples, and standards to wells
3
2.
Specify the information to display in the wells:a. Click Show in Wells to open the drop-down list. Items that are marked with a check ( ) are selected for display.
b. Click an item to select or deselect it for display.
3.
(Optional) To save your selections as default settings, click Set as Default at the top right of the View Plate Layout toolbar.4.
Assign standards, NTCs, and unknown samples to well(s). a. To select:• Well – Click the well
• Row of wells – Click a letter on the side of the layout • Column of wells – Click a number at the top of a column
• More than one well, row, or column – Drag the pointer over the wells, letters, or columns to select
b. In the Assign Sample(s) to the Selected Wells section to the left of the plate layout, select the check box in the Assign column corresponding to the unknown, standard, or NTC sample in the well(s). The target for each sample is set by default.
Note: <Sample 1> is automatically assigned to all wells that are not assigned as standard(s) or NTC(s).
5.
(Optional) To change the quantity of standards, enter the quantity in ng/µL in the Quantity field in the Assign Targets to the Selected Wells area. The quantity of standard samples is set by default.6.
Repeat steps 4 and 5 until you assign samples, standards, and NTCs to all wells that you use in the experiment. You can delete empty wells after data analysis.Note: If you delete the samples/standards/NTCs in a well and then restore them, you must reenter the well information.
The task for each target/sample combination is set automatically.
7.
Clear all wells that do not contain samples or targets:a. Select the well(s) to clear. b. Right-click the well(s).
Chapter 3 Select the Experiment and Set Up a Plate Assign the targets, samples, and standards to wells
3
Assign a new
sample to a well
To add a new sample to a well:
1.
Double-click the well to open the Add New Sample dialog box.2.
Click Add New Sample.3.
Target and task are set by default according to sample type. To change the sample type, click the down arrow in the Sample column header and select theappropriate sample type from the drop-down list.
4.
To change the sample quantity setting for standard samples, perform step 5 on page 29.Move samples,
standards, and NTCs
1.
Select the wells for the samples, standards or NTCs you want to move.2.
Deselect ( ) the items in the Assign Sample(s) to the Selected Wells pane, orright-click the wells and select Clear.
3.
One at a time, select the new wells for an item you are moving, then select ( ) the items in the Assign Sample(s) to the Selected Wells pane.31
HID Real-Time PCR Analysis Software v1.2 Getting Started Guide
Chapter 3 Select the Experiment and Set Up a Plate Assign the targets, samples, and standards to wells
3
To assign samples, standards, and NTCs using the View Well Table tab:
1.
Select the View Well Table tab.Each row in the table represents one well. To group the rows by a characteristic, click the column header. For example, click Task to group rows by task.
To select wells with specific characteristics:
a. Click the left Select Wells With button above the layout diagram. b. Select Sample, Target, or Task in the drop-down list.
c. Click the right Select Wells With button. d. Select a specific sample, target, or task.
2.
Specify the information to display in the table:a. Click Show in table to open the drop-down list. Items that are checked in the check box ( ) are selected for display.
b. Click an item to select or deselect it for display.
3.
(Optional) To save your selections as default settings, click Set as Default at the top right of the View Plate Layout toolbar.4.
Assign samples, standards, and NTCs to well(s): a. Select the well(s). To select:• Well – Click under one of the column headings in the row next to the well location (for example, to select well A6, click in row A6 under Sample).
• More than one well – Drag the pointer over the wells that you want to select, or Ctrl+Click the wells that you want to select.
b. In the Assign Sample(s) to the Selected Wells section, select the check box in the Assign column corresponding to the unknown, standards, or NTC sample in the well(s). The target for each sample is set by default.
Note: <Sample 1> is automatically assigned to all wells that are not assigned as standard(s) or NTC(s).
5.
(Optional) To change the quantity of standards, enter the quantity (in ng/µL) in the Quantity field in the Assign Targets to the Selected Wells area. The quantity of samples is set by default.6.
Repeat steps 1 and 5 until you assign samples, standards, and NTCs to all wells that you use in the experiment. You can delete empty wells after data analysis.Note: If you delete the samples, standards, or NTCs in a well and then restore them, you must reenter the well information.
Chapter 3 Select the Experiment and Set Up a Plate Save plate layout as *.eds or template
3
7.
Clear all wells not assigned:a. Click the left Select Wells With button at the top of the table. b. Select Sample from the drop-down list.
c. In the well table, select the sample name(s) of the well(s) to clear.
d. In the Assign samples to the selected wells area, deselect the checkbox in the Assign column beside the sample name.
Save plate layout as *.eds or template
IMPORTANT! Do not save the experiment to the network folder until the plate run is completed.
1.
To save your plate layout, in the toolbar, click the down arrow next to Save, then in the drop-down list, select:• Save – to save the plate layout as an Experiment Document Single (*.eds) file • Save as – to save the plate layout as a *.eds file with a different name
or
• Save as Template – to save the experiment file as a template for future experiments
2.
If you want to save the file with a different name, enter the new name in the File Name field.3.
Click Save.4.
Before you start the run, verify that the plate is loaded in the instrument, as described in the user guide for the Quantifiler® Kit you are using.33
HID Real-Time PCR Analysis Software v1.2 Getting Started Guide
Chapter 3 Select the Experiment and Set Up a Plate Link your template to a Home screen button
3
Link your template to a Home screen button
You can link your template to the any of the Quantifiler® assay icons on the Home screen for:
The software will automatically use the template as the default experiment when you click the corresponding button. You will still be able to use a different template by opening a different experiment.
1.
Before you link your template file to a button on the Home screen, save a copy of the original template:a. Navigate to C:\Applied Biosystems\7500\config\templates. b. Select EditCopy to copy the folder C:\Applied
Biosystems\7500\config\templates.
c. Navigate to a safe location on your computer.
d. Select EditPaste to insert a copy of the templates folder in the location you select.
2.
Link your template to a button on the Home screen:a. In the toolbar, from the file that you want to link, click the down arrow next to Save.
b. In the drop-down menu, select Save as Template. c. Navigate to C:\Applied Biosystems\7500\config\templates.
d. Select the file corresponding to the assay button that you want to replace.
IMPORTANT! Be sure to give the file exactly the same name as the file corresponding to the button that you want to replace.
Chapter 3 Select the Experiment and Set Up a Plate Link your template to a Home screen button
35
HID Real-Time PCR Analysis Software v1.2 Getting Started Guide
4
CHAPTER 4
Run the Plate
This chapter covers:
■ View the run method . . . 35
■ Set notifications. . . 37
■ Start or stop the run . . . 38
■ Monitor the run. . . 38
■ Save the results . . . 39
View the run method
1.
In the Experiment Menu, select SetupRun Method to open the Run Method screen.2.
Select the Graphical View tab to open the thermal profile for the assay. Thermal profile for Duo KitChapter 4 Run the Plate View the run method
4
3.
Verify that the value in the reaction volume field is:• 25 µL for Quantifiler® Human, Human Male, and Duo Kits • 20 µL for Quantifiler® HP and Trio Kits
For more information on run parameters, refer to the user guide for the Quantifiler® Kit you are using.
Thermal profile for Male Kit, Human Kit, and Human and Male Kit
37
HID Real-Time PCR Analysis Software v1.2 Getting Started Guide
Chapter 4 Run the Plate Set notifications
4
Set notifications
You can set the software to send e-mail notification of selected events to e-mail addresses that you specify.
1.
In the Experiment Menu, select RunNotification Settings to open the screen.2.
To send notifications:• In the Run Status area, select the Enable Notifications check box.
or
• In the Notifications Settings area, select Yes for Enable Notifications. If you do not want the system to send notifications, select No.
IMPORTANT! Notifications cannot be sent unless the computer that performs the run is on an e-mail network.
3.
For “Select the events to generate notifications,” select the check boxes for events that you want to generate e-mails. You can select:• Instrument Error – Notifies addressees that the run stopped before completion of the run
• Run Started – Notifies addressees that the run began
• Run Completed – Notifies addressees that the run is finished
4.
In the “Enter email addresses for notifications” field, enter the e-mail address(es) (including you) to which notifications are sent. Use the format shown on the screen. Enter a comma between addresses.5.
Define the outgoing server. If you need information about the server, contact your network system administrator.a. In the Outgoing Server (SMTP) field, enter the name of the outgoing server. For example: smtp.mycompany.com
b. Select Yes next to “Server requires an encrypted connection?” if the outgoing server requires an encrypted connection. If no encrypted connection is required, select No.
Chapter 4 Run the Plate Start or stop the run
4
c. If the outgoing server requires authentication to receive the e-mail from the instrument, select Yes next to “Server requires authentication?” Enter the authentication user name and password in the dialog box.
Start or stop the run
IMPORTANT! If the computer that performs the run is on a network, avoid excess use of the network during a run.
Note: You can set analysis parameters before or after you run a plate. To set parameters before you run a plate, see Chapter 5, “Select Analysis Settings and Thresholds”.
Start
To start a run:
•In the Experiment Menu, select Setup, select any screen, then click Start Run at the top right corner.
or
• In the Experiment Menu, select Run, select any screen, then carefully click Start Run at the top left corner.
Note: If you double-click the Start Run button, it may not become a Stop Run button, but the run proceeds normally.
Stop
When you start a run, the green Start Run button becomes a red Stop Run button. Click the Stop Run button to stop the run immediately.
Monitor the run
During a run, you can access the amplification plot, temperature plot, and run method. In the Experiment Menu, select Run, then click:
• Amplification Plot – To view amplification plots of reactions • Temperature Plot – To view temperature plots of reactions • Run Method – To view and edit the run method during the run
39
HID Real-Time PCR Analysis Software v1.2 Getting Started Guide
Chapter 4 Run the Plate Save the results
4
Save the results
After a run is complete, HID Real-Time PCR Analysis Software automatically
performs analysis and saves the initial results file. If you modify the plate (for example, if you remove a well from analysis and reanalyze the results), the software does not automatically save the changes. After reanalysis, the HID Real-Time PCR Analysis Software prompts you to save the results.
After the run, see Chapter 6, “Enhance Data Analysis,” to view and manage the results.
Chapter 4 Run the Plate Save the results
41
HID Real-Time PCR Analysis Software v1.2 Getting Started Guide
5
CHAPTER 5
Select Analysis Settings and
Thresholds
This chapter covers:
■ Open analysis settings . . . 41
■ View/Edit CT settings. . . 42
■ Enter HID settings . . . 43
■ Enter Flag settings . . . 46
IMPORTANT! All default settings shown in this guide and in the software screens are for illustration only. For your experiments, set the parameters and thresholds according to your laboratory protocol.
Before analyzing data from a completed run, you can edit values for the analysis parameters:
• CT threshold, baseline start cycle, and end cycle • HID flag thresholds
• QC flag thresholds
The Analysis Settings screen also contains the area where you set the parameters for the Dilution Calculation tool to use in calculating a dilution scheme for downstream amplification.
Note: See “Edit dilution settings for individual samples” on page 63 for more information about settings in the Dilution Scheme area.
Open analysis settings
1.
In the Experiment Menu, select Analysis, then select any one of the following data displays:• Amplification Plot
• Standard Curve
• Raw Data Plot
• QC Summary
Chapter 5 Select Analysis Settings and Thresholds View/Edit CT settings
5
2.
Click the Analysis Settings button in the top right corner of the screen to display the Analysis Settings dialog box.View/Edit C
T
settings
Select the CT Settings tab to view the settings for CT. The recommended CT settings for each Quantifiler® kit are included in the experiment templates provided with the software and in the user guide for the associated Quantifiler® kit. The recommended settings are those which were used in the validation experiments performed for each kit by Thermo Fisher Scientific.
The default system settings are: • Manual CT Threshold = 0.2 • Manual Baseline Start Cycle = 3 • Manual Baseline End Cycle = 15
To change these settings, click Edit Default Settings, then enter the new values.
To analyze the data with new settings, click Apply Analysis Settings at the bottom of the Analysis Settings dialog box.
43
HID Real-Time PCR Analysis Software v1.2 Getting Started Guide
Chapter 5 Select Analysis Settings and Thresholds Enter HID settings
5
Enter HID settings
1.
Select the HID Settings tab to view the Dilution Scheme, HID Flags, and HID Flag settings.See “Edit dilution settings for individual samples” on page 63 for more information about settings in the Dilution Scheme area.
2.
In the Use column in the HID Flags table, select the check box for each flag that you want to include in the analysis.You can use a flag to identify quality issues and help to interpret results for wells. Flags can indicate samples that may require further attention. You can exclude wells from data analysis. See “Omit wells from analysis” on page 53 for instructions on excluding wells from analysis.
3.
Enter threshold settings for the flag(s) that you select: a. In the HID Flags table, select the flag of interest.b. In the HID Flag Settings area, enter in the corresponding fields the value(s) that you want to use.
Repeat steps 2 and 3 until you enter settings (or view the default settings), for all the flags that you select.
Note: To save your HID flag settings for future use, save the experiment as a template before you start the run (see “Start or stop the run” on page 38.)
4.
To analyze the data with new settings, click Apply Analysis Settings at theChapter 5 Select Analysis Settings and Thresholds Enter HID settings
5
HIGHQT
The HIGHQT flag indicates that the quantity, or mean quantity of sample replicates, is above a threshold that you set.
IPCCT
The IPCCT flag indicates one of the following:
LOWQT
The LOWQT flag indicates that the quantity, or mean quantity of sample replicates, is below a threshold that you set.
NTCCT
This flag refers to the CT value of the NTC (non-template control). No amplification of human and/or male target(s) should occur in NTC wells.
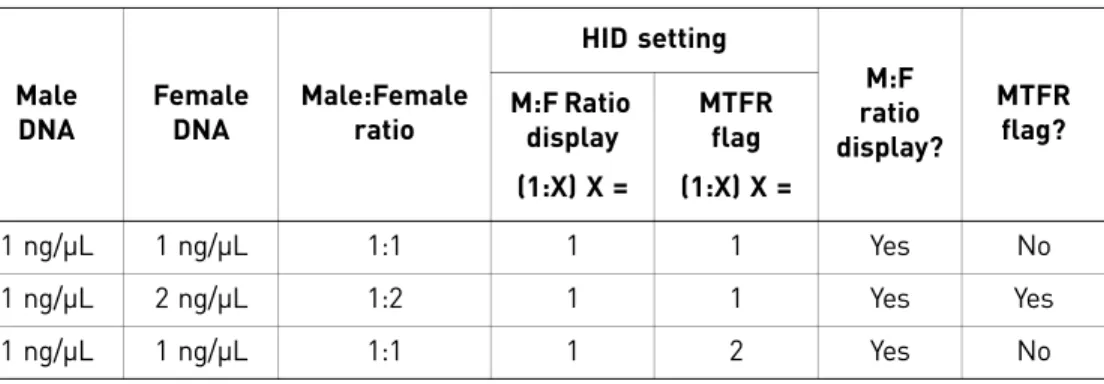
MTFR flag and M:F ratio display
The MTFR (Male to Female Ratio) is expressed as 1:X. A well is flagged if X is greater than the threshold that you set. For example, if you set the MTFR flag threshold at 1:10, then a sample containing 5 ng/µL of male DNA and more than 55 ng/µL of human DNA generates an MTFR flag. The flag for this condition is a yellow triangle ( ) in
Well
contents Cause Comment
Unknown sample
The IPC (Internal PCR Control) CT value is greater than the average of the IPC CT values for all the standards plus the threshold that you set.
We strongly recommend that you base the threshold setting on validation data produced by your laboratory. We have observed the following: • For information on interpreting the IPCCT flag for Quantifiler® Kit experiments, refer to the user guide for the kit you are using.
Standard or NTC
The IPC (Internal PCR Control) CT value is above or below the maximum or minimum, respectively, that you set.
In Quantifiler® Kit experiments, IPC target amplification should be within an expected range. Low or no IPC amplification can indicate the presence of PCR inhibitors, incorrect experiment setup, or reagent or instrument failure.
45
HID Real-Time PCR Analysis Software v1.2 Getting Started Guide
Chapter 5 Select Analysis Settings and Thresholds Enter HID settings
5
In contrast, the M:F ratio display does not have an associated flag. The M:F ratio is also expressed as 1:X and is displayed in the M:F ratio column of the well table only if X is greater than or equal to the threshold that you set for the M:F ratio display.
The M:F ratio display threshold is expressed as 1:X where X must be less than or equal to the X value for the MTFR flag. For example, if you set the M:F ratio display to 1:1, then the MTFR flag must be set to 1:>1. Samples with ratios greater than the MTFR flag display the MTFR flag and display the calculated M:F ratio. The M:F Ratio Display function alerts you to male and female mixtures before STR analysis.
Table 2 Results of example M:F and MTFR settings
SLOPE
Indicates the PCR amplification efficiency for the experiment. The amplification efficiency is calculated using the slope of the regression line in the standard curve. The standard wells are flagged if the slope is not between the minimum and maximum values that you set.
The standard curve is derived from a serial dilution set of standards containing a range of known quantities. Results from amplifications of these standards are used to generate a curve.
A slope of − 3.3 indicates 100% amplification efficiency. Refer to the Quantifiler®
Human DNA Quantification Kit and Quantifiler® Y Human Male DNA Quantification Kit
User’s Manual and the Quantifiler® Duo DNA Quantification Kit User’s Manual for more
information on the standard curve and slope.
R2
This flag indicates the regression coefficient calculated from the regression line of the standard curve. The R2 value indicates the closeness of fit between the standard curve regression line and individual CT data points from the standard reactions. A value of 1.00 indicates a perfect fit between the regression line and the data points.
Male DNA Female DNA Male:Female ratio HID setting M:F ratio display? MTFR flag? M:F Ratio display (1:X) X = MTFR flag (1:X) X = 1 ng/μL 1 ng/μL 1:1 1 1 Yes No 1 ng/μL 2 ng/μL 1:2 1 1 Yes Yes 1 ng/μL 1 ng/μL 1:1 1 2 Yes No
Chapter 5 Select Analysis Settings and Thresholds Enter Flag settings
5
YINT
The Y-intercept value of the standard curve indicates the expected CT value for a sample with a quantity of 1 (for example, 1 ng/µL). The YINT flag can assist in evaluating standard performance and serial dilution preparation. Your laboratory can perform validation studies to determine a range for the Y-intercept and you can set the HID Flag values for each Quantifiler® kit and the HID Flag values for each target (human and male) in the Quantifiler® Duo assay. A YINT flag may indicate incorrectly prepared standard concentrations, degraded standard, or other preparation errors.
Enter Flag settings
1.
Select the Flag Settings tab to view and define instrument, sample, and data collection flags. Flags not used in the analysis are gray. Table 3 on page 47 explains the flags.2.
In the Use column, select each flag that you want to include in the analysis.3.
Select the condition (< > =) in the Condition column drop-down lists and enter thecorresponding values in the Value column to specify the conditions that generate a flag.
4.
To omit the wells that have a flag from the analysis, select the correspondingReject Well check boxes.
47
HID Real-Time PCR Analysis Software v1.2 Getting Started Guide
Chapter 5 Select Analysis Settings and Thresholds Enter Flag settings
5
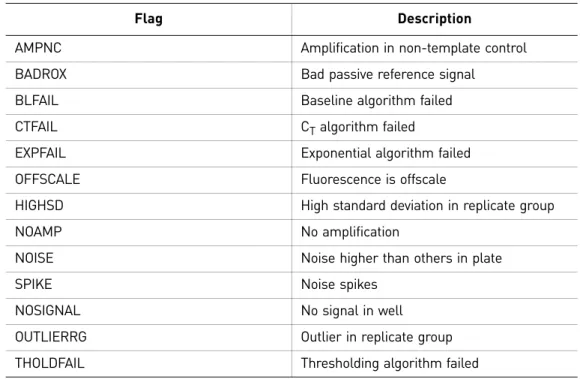
Table 3 QC flags
Flag Description
AMPNC Amplification in non-template control BADROX Bad passive reference signal
BLFAIL Baseline algorithm failed CTFAIL CT algorithm failed
EXPFAIL Exponential algorithm failed OFFSCALE Fluorescence is offscale
HIGHSD High standard deviation in replicate group NOAMP No amplification
NOISE Noise higher than others in plate SPIKE Noise spikes
NOSIGNAL No signal in well OUTLIERRG Outlier in replicate group THOLDFAIL Thresholding algorithm failed
Chapter 5 Select Analysis Settings and Thresholds Enter Flag settings
49
HID Real-Time PCR Analysis Software v1.2 Getting Started Guide
6
CHAPTER 6
Enhance Data Analysis
This chapter covers:
■ View the analysis results . . . 50
■ Interpret QC flag information. . . 52
■ Omit wells from analysis. . . 53
■ Omit targets in an experiment well . . . 54
■ Examine the Degradation Index. . . 54
Chapter 6 Enhance Data Analysis View the analysis results
6
View the analysis results
Flagged wells
To view the results of the data analysis:
1.
In the Experiment Menu, select AnalysisQC Summary to open the QC Summary screen.Note: If screen resolution is not set to 1280 X 1024, the Analysis Summary may not be properly displayed.
2.
In the QC Summary area, select the Analysis Summary tab to display areas that list the HID-specific flags that you selected to include in the data analysis and indicate the number of wells that meet/do not meet the threshold that you set. The table below shows the meaning of the symbols.Location Symbol Meaning
Standard Curve bar Green square ( ) A value for Slope, R2, or Y-Intercept meets the threshold
Red octagon ( ) A value for Slope, R2, or Y-Intercept does not meet the
51
HID Real-Time PCR Analysis Software v1.2 Getting Started Guide
Chapter 6 Enhance Data Analysis View the analysis results
6
Standard curve
The Standard Curve bar contains the SLOPE, R2, and Y-Intercept flags. Click thecolumn heading for a red octagon ( ) to highlight in the plate layout the wells represented in the standard curve. This graphical view simplifies the identification of wells that require further analysis using your laboratory protocol.
Standard
The Standard bar reports the IPCCT flags for all the wells on the plate that youdesignated as sample type Standard. Click the number in the Thresholds Not Met column to view the well(s) that do not meet the IPCCT threshold in the plate layout or well table format. You can use the amplification, multi-component, or the raw data plot(s) to troubleshoot the data for these wells. You can examine the wells that meet the threshold by clicking the number in the All Threshold Met column.
NTC (non-template
control)
The NTC bar reports the IPCCT and NTCCT flags for all the wells on the plate that you designated as sample type NTC (non-template control). Click the number in the Thresholds Not Met column to view the well(s) that do not meet the IPCCT or NTCCT threshold in the plate layout or well table format. You can use the amplification, multi-component, or raw data plot(s) to troubleshoot the data for these wells. You can examine the wells that meet the threshold by clicking the number in the All Threshold Met column.
Unknown
The Unknown bar reports the IPCCT, HIGHQT, LOWQT, and MTFR flags for all thewells on the plate that you designated as sample type Unknown (note that the MTFR flag is not available in Human, HP, or Human Male kit experiments). The HIGHQT, LOWQT, and MTFR (male to female ratio) flags indicate that the quantity of DNA or ratios of male to female DNA in unknown samples might require additional attention. Numbers below the flag indicate the number of wells that do not meet the threshold. Click the number in the Thresholds Not Met column to view the well(s) that do not meet a threshold in plate layout or well table format. You can use the amplification, multi-component, or raw data plot(s) to troubleshoot the data for these wells. You can examine the wells that meet the threshold by clicking the number in the All Threshold Met column.
Instrument-related
flags
In addition to the flags listed above, a message might be displayed to indicate that one or more of the instrument-related flags is generated by a potential problem with the instrument. The message prompts you to select the QC Flags Details tab to view the flags.
All Thresholds Not Met column of: • Standard bar
• NTC bar • Unknown bar
Hyperlinked numbers The number of wells that do not meet the thresholds for a flag value
Chapter 6 Enhance Data Analysis Interpret QC flag information
6
Well(s) automatically omitted
In certain rare instances, such as assignment of targets to empty wells, HID Real-Time PCR Analysis Software may automatically omit certain wells of a Quantifiler® Kit run.
The software automatically omits wells that may prevent the completion of data analysis, so that analysis can continue for the rest of the wells in the plate. These wells are indicated by a red exclamation point above the Analysis Summary tables. You can examine the automatically omitted wells by clicking the number next to the
exclamation point.
Interpret QC flag information
QC Flags Detail
1.
In the QC Summary screen, select the QC Flags Detail tab to view all QC flags (both general and HID).2.
Click a flag to select all affected wells in the plate layout, and to open a brief description of the flag and wells in a box below the list.53
HID Real-Time PCR Analysis Software v1.2 Getting Started Guide
Chapter 6 Enhance Data Analysis Omit wells from analysis
6
Omit wells from analysis
You can omit wells from analysis. To view data from individual wells on the Amplification analysis plot, in the Experiment Menu, select one of the following screens:
• Amplification – Amplification vs. cycle and amplification vs. well
• Standard curve – CT vs. quantity of standards, flagged samples, and unflagged samples
• Multicomponent plot – Fluorescence vs. cycle of all reaction components • Raw data plot – Amplitude vs. filter
• Multiple plots view – Amplification, Standard curve, Multicomponent, and Raw data plots in one pane
1.
In the Experiment Menu, select Analysis. Click any Analysis screen. If no data are displayed, click Analyze.2.
Omit wells using the well table or plate layout:To use the well table, select the View Well Table tab, then select the Omit check boxes corresponding to the wells to exclude from the analysis.
or
To use the plate layout, select the View Plate Layout tab. Right-click the well(s) to omit, then select Omit.
3.
Click Analyze to reanalyze the experiment data with the omitted well(s) excluded from the analysis.Chapter 6 Enhance Data Analysis Omit targets in an experiment well
6
Omit targets in an experiment well
For Duo, HP, and Trio experiments, you can omit one of the standard targets in a well from analysis (shown for a Duo experiment in the example below).
1.
Right-click a well with a standard target that you want to omit.Note: You can omit only one target from one well at a time.
2.
Select Omit from the drop-down list, then select:• Well – to omit all targets from the well. The (well omitted) icon appears in the well.
• Individual Target (for example, Duo Human) – to omit a specific target from the well, select the name of the target. The individual target omitted icon (for example, for Duo Human omitted) appears in the well.
3.
Click Analyze to reanalyze the experiment data with the omitted target(s) excluded from the analysis.Examine the Degradation Index
Degradation Index refers to the data observed when a sample may be degraded: a decrease in measured amount for large DNA fragments compared to small DNA fragments. While DNA degradation is not the only theoretically possible mechanism for a decrease in amount, it is the predominant mechanism in the absence of inhibitors. The Degradation Index is for use as a general indicator of whether large DNA
fragments may perform more poorly in STR reactions. Evaluate Degradation Index in conjunction with the IPC CT.
The Degradation Index is automatically calculated by the HID Real-Time PCR Software using the following formula:
55
HID Real-Time PCR Analysis Software v1.2 Getting Started Guide
Chapter 6 Enhance Data Analysis Change the appearance of, print, and save plots
6
Change the appearance of, print, and save plots
Change the appearance of a plot
1.
In the Experiment Menu, select Analysis, then click the name of a plot of interest.2.
In the plot screen, locate the icon bar above the plot.3.
Click (Hide) to hide the plot legend.4.
To change the appearance of a plot, click (Edit Plot Properties) to open the Plot Properties dialog box. Three tabs are displayed.5.
Select the appropriate tab to enter the values you want to use to plot the data.6.
Click OK to apply the changes.Specify wells to report
You can specify which wells to include in the amplifications plots and results table of reports:
1.
In the Experiment Menu, select any Analysis screen.2.
Select the well(s) to include, using either the View Plate Layout tab (see step 4 on page 29) or the View Well Table tab (see step 4 on page 31).Print or save a plot
Click (Print) to print the plot.
Click (Save) to save the plot as a *.jpg file.
Chapter 6 Enhance Data Analysis Change the appearance of, print, and save plots
57
HID Real-Time PCR Analysis Software v1.2 Getting Started Guide
7
CHAPTER 7
Export and Report Results
This chapter covers:
■ Export data . . . 57
■ Print a report . . . 59
Overview
After the HID Real-Time PCR Analysis Software completes analysis and after you review the data, you can generate a customized report in *.pdf files, then save or print the report.
You can also export and save data in these formats: • Excel® (*.xls)
• Powerpoint® (*.ppt) • Text (*.txt)