in a Large Organizational Email Network:
Visualization and Modeling Approaches
Benjamin H. Sims, Nikolai Sinitsyn and Stephan J. EidenbenzAbstract This paper presents findings from a study of the email network of a large scientific research organization, focusing on methods for visualizing and modeling organizational hierarchies within large, complex network datasets. In the first part of the paper, we find that visualization and interpretation of complex organizational network data is facilitated by integration of network data with information on for-mal organizational divisions and levels. By aggregating and visualizing email traffic between organizational units at various levels, we derive several insights into how large subdivisions of the organization interact with each other and with outside orga-nizations. Our analysis shows that line and program management interactions in this organization systematically deviate from the idealized pattern of interaction pre-scribed by “matrix management”. In the second part of the paper, we propose a power law model for predicting degree distribution of organizational email traffic based on hierarchical relationships between managers and employees. This model considers the influence of global email announcements sent from managers to all employees under their supervision, and the role support staff play in generating email traffic, acting as agents for managers. We also analyze patterns in email traffic volume over the course of a work week.
Keywords Network visualization
·
Complex networks·
Community detection·
Power law model·
Organizational hierarchiesThis chapter was created within the capacity of an US governmental employment. US copyright protection does not apply.
B.H. Sims (
B
)·N. Sinitsyn·S.J. EidenbenzLos Alamos National Laboratory, Los Alamos, NM 87545, USA e-mail: [email protected]
N. Sinitsyn
e-mail: [email protected] S.J. Eidenbenz
e-mail: [email protected]
© Springer International Publishing Switzerland (outside the USA) 2014 R. Missaoui and I. Sarr (eds.),Social Network Analysis – Community Detection and Evolution, Lecture Notes in Social Networks, DOI 10.1007/978-3-319-12188-8_2
1 Introduction
In this paper, we present results of our analyses of large organizational email datasets derived from the email traffic records of Los Alamos National Laboratory (LANL).1
Analyzing such large email datasets from complex organizations poses a number of challenges. First, considerable work is required to parse large quantities of raw data from network logs and convert it into a format suitable for network analysis and visualization. Second, a great deal of care is required to analyze and visualize net-work data in a way that makes sense of complex formal organizational structures—in our case, 456 organizational units that are connected through diverse organizational hierarchies and management chains. Finally, it can be difficult to sort out the effects of email traffic generated by mass announcements and communications along man-agement chains from the more chaotic, less hierarchical traffic generated by everyday interactions among colleagues.
This paper addresses these complexities in two ways. First, we demonstrate methods for understanding large-scale structural relationships between organiza-tional units by using carefully thought-out visualization strategies and basic graph statistics. Second, we propose a power law model for predicting the degree distri-bution of email traffic for nodes of large degree that engage in mass emails along hierarchical lines of communication. This likely characterizes a significant portion of email traffic from managers (and their agents) to employees under their supervision. This model goes beyond existing models of node connectivity in organizations by considering the influence of specific email usage practices of managers.
Our motivation for this analysis is primarily sociological, with a focus on understanding structural relationships among formal organizational divisions and along defined management chains within a particular organization. Email network analysis enables us to draw conclusions about the respective roles of different ele-ments in the organizational hierarchy, beyond what is specified in organizational charts and management plans. This offers insight into the functioning of the organi-zation, and could have practical implications for management and communications. Further, it provides a case study that can be compared to other organizational studies, and demonstrates a general set of methods that can be employed to gain organiza-tional insight from email data.
2 Analysis and Visualization of Organizational Structure
The study of social networks in organizations has a long history, going back at least as far as the Hawthorne studies of the 1920s, in which anthropological observations of worker interactions at Western Electric’s Hawthorne Works were represented as networks [11,20]. The convention of representing social connections as graphs, with
circles or other shapes representing individuals and lines representing relationships between them, emerged in these very early stages of social network research [10]. Initially, these graphs were hand drawn, and typically laid out to qualitatively repre-sent patterns the researchers found important. With the rise of computational social network analysis in the 1970s and 1980s, it became possible to lay out graphs algo-rithmically. Spring-based algorithms facilitated gaining visual insights into interac-tional patterns in a more systematic way. Today, sophisticated graph drawing tools like Cytoscape and Gephi provide network researchers with access to a wide range of layout algorithms and drawing styles [16,17]. Despite the rise of sophisticated mathematical constructs for analyzing social network graphs, visual representations still remain important, particularly in anthropological and sociological studies.
Studies of the network structure of organizations have drawn attention to the key roles of structural holes and brokers. A structural hole is relationship of nonredun-dancy between two nodes in a network [4]: in other words, a structural hole exists between two individuals if their connection would create a unique link between parts of the network that are currently separated. Structural holes are very common in most large organizations. When such a link is made, as long as it remains unique, the individuals at both ends are able to function as brokers between the two parts of the organization, a position that confers many benefits in terms of power and access to information.
A great deal of research has focused on the respective roles of strong and weak ties in the creation and transfer of knowledge in organizations. Weak ties are those that are exercised rarely and often connect individuals to others who are at some organizational or geographic remove. Strong ties are characterized by more frequent interaction, more positive feelings, and exchanging of services. Weak ties have been shown to be important in knowledge search, since they often provide access to novel information, a key element in innovation [13,14]. However, scientific and technical knowledge have several features that are difficult to convey through weak ties. First, these forms of knowledge often have a large tacit component [7,29]. Tacit knowledge is knowledge that has not been, and perhaps cannot be, formally expressed, and is central to expert judgment. Because of this, it can only be effectively transferred from one individual to another through prolonged, direct interaction. The transfer of tacit knowledge between organizational units is facilitated by the existence of multiple direct, strong ties. Scientific and technical concepts are also complex, and thus require greater information bandwidth and/or more time to communicate, both of which are facilitated by strong ties [14,22]. In general, then, weak ties provide access to new knowledge, which is key to developing innovative ideas, while strong ties enable transfer and sharing of knowledge at a deeper level, which is necessary for research collaboration and for the elaboration and implementation of new ideas [28]. The sociological literature on organizational gatekeepers suggests that some individuals who occupy broker roles can play a critical role in knowledge transfer within and between organizations. A study by Allen and Cohen [1] identified a key tension between organization-based and discipline-based coding schemes in research and development laboratories. Coding schemes are ways of perceiving and organiz-ing the world that vary from one community to another. Organizations need access to
outside coding schemes to bring in new information and ideas, while internal coding schemes facilitate close working relationships between colleagues. In the laboratory they studied, Allen and Cohen found that the key mechanism for managing this ten-sion was to place a limited number of individuals in informal gatekeeper roles. These gatekeepers had more ties to technical disciplinary communities and colleagues out-side the laboratory, and more familiarity with the research literature. Being in this gatekeeper position relative to the outside world also made them preferred sources of information and advice within the organization. Tortoriello et al., in a more recent study [33], note that the tight relationships and shared knowledge individual organi-zational units need to function effectively inhibits their ability to interact effectively with other organizational units. Having a limited number of people in gatekeeper roles is a mechanism that enables groups to maintain a cohesive identity while preserving access to important knowledge and information from elsewhere in the organization. The rise of electronic mail as a central communication mechanism in organizations, along with extensive archiving of email communications, has created a body of data that can be used to analyze organizational interactions at very large scales. Auto-matically collected email data has significant advantages for capturing interactions among organizational units: although email does not capture all relevant interactions, it provides comprehensive coverage across the entire organization without the over-head involved in large-scale survey-based studies. Studies have shown that email communication patterns generally reflect the underlying social network structure of an organization [34].
The Enron corpus, released by regulators as part of an investigation into the companys bankruptcy, is one of the few publicly available email datasets of significant scope available to researchers. As such, it has played a key role in the development of email analysis techniques [5,8]. However, the Enron corpus is quite small (half a million messages between 158 individuals) compared to the total email volume of a large organization. Unfortunately, larger email corpora (like the one analyzed here) are often not considered publicly releasable, and are accessible only to researchers internal to the organization in question. For example, [19] describes a very large email network of email communications among Microsoft employees. A key feature of many of these email studies, which we build upon here, is that they track both individual-level communications and communications across formal divisions of the organization. Aggregating relationships based on formal organizational structures offers an important level of insight, which can be particularly useful for managers and analysts interested in interactions among business units, capabilities, or functions rather than individuals.
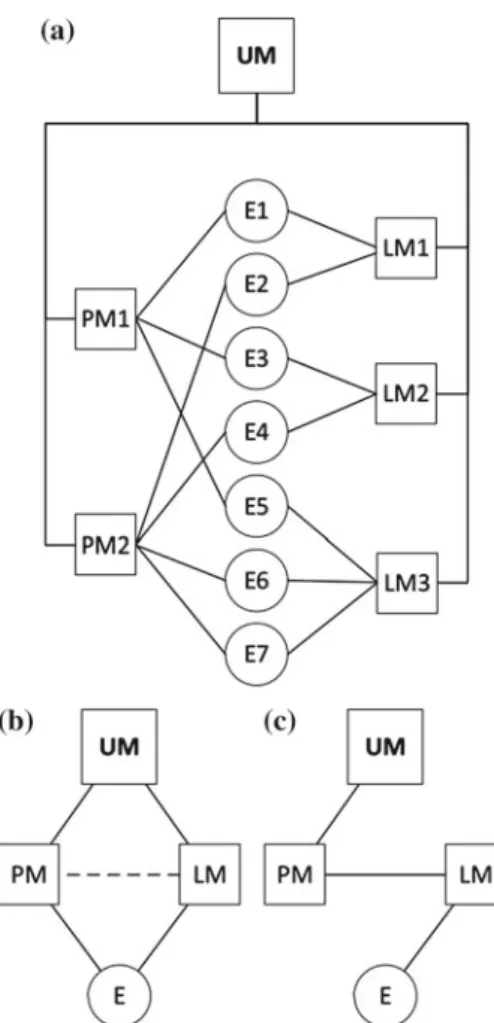
Fig. 1 aSchematic representation of a typical organizational chart for a fully matrixed organization. Each employee reports to one line and one program manager, and line and program managers independently report to upper management.bThe idealized communication pattern that results froma.
Dotted lineindicates less frequent communication.c
The actual communication pattern at LANL, revealed through analysis of email data. (UM=
upper management, PM= program/project management, LM=line management, E=employee.)
2.1 Structural Relationships Between Elements of the
Organization
Our analysis of structural relationships within LANL focuses on two broad, cross-cutting distinctions: program versus line organizations, and technical research and development functions versus operations functions (safety, physical plant, etc.). LANL is a hybrid matrix management organization. In a fully matrixed organi-zation, each employee has two managers: a line manager and a program or project manager (Fig.1a). The employee is assigned to a line management unit based on their skill set and capabilities. For example, a computer scientist might be assigned to a Computational Modeling group, or an engineer to a Structural Engineering group. Line management plays little or no role in guiding the day-to-day work of employ-ees, however. Instead, the employee is assigned to work on one or more projects,
each of which is supervised by a program or project manager. A project is generally directed toward a specific product or deliverable, such as design of a particular model of aircraft or completion of a particular research task. The day-to-day work of the employee toward these particular goals is directed by the program or project man-ager. Both line and program managers usually report, through some management chain, to upper level general managers. The idealized communication pattern that results is one in which program and line managers communicate primarily vertically, interacting with both upper management and employees (Fig.1b). In order to keep things running smoothly, however, program and line managers must also periodically communicate laterally, to ensure a good fit between capabilities and projects.
The matrix management model became popular in the aerospace industry with the rise of program management in the 1950s, and was in part influenced by the organizational structure of the Manhattan Project [3], in which Los Alamos played a major role. At LANL today, line and program organizations play less distinct roles. The base-level line units that house most employees are called groups, which may be built around programs or capabilities. In our analysis, we draw a distinc-tion between groups and higher-level line management organizadistinc-tions, which aren’t directly involved in technical or operations work. Program organizations play a vari-ety of coordinating roles among groups, management, and outside organizations, and sometimes conduct technical or operations work as well. Despite this flexible definition, our analysis reveals that technical program organizations occupy a very well-defined structural space within the organization as a whole.
Our analysis of email traffic between organizational units at LANL is based on a complete email record for a 25 day period in 2011. This time period was selected pri-marily based on practical considerations of data availability; it is possible that other time periods would yield somewhat different results [21,35]. In order to locate indi-viduals within organizational structures, we used organizational telephone directory data to associate email addresses with low-level organizational units, and informa-tion from organizainforma-tion charts to generate mappings of these units to higher-level ones. We included only those email addresses that corresponded to an individual in the LANL employee directory, thereby excluding mailing lists and external corre-spondents. The resulting dataset comprises approximately 3 million emails between 12,000 addresses. This is a relatively large organizational communication network compared to others described in the literature. For example, one of the data sets ana-lyzed in [24] is an email network for a scientific research organization that appears comparable to ours. This network consists of approximately 3 million total emails col-lected over 18 months, but covers only 1,200 internal organizational email addresses. There are a few examples of analysis of much larger email networks: [21] uses a data set covering 43,000 addresses at a university over one year, while [19] is based on emails among over 100,000 employees of a multinational corporation over a period of 5 months.
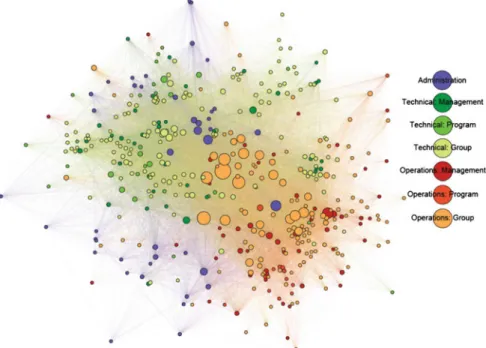
Figure2 shows email traffic between organizational units, laid out using a force-vector algorithm. By aggregating email traffic this way, we in effect apply a block model in which groupings are pre-specified by formal organizational posi-tion. We chose not to take a generalized block modeling approach [9] because our
Fig. 2 Email traffic between organizational units at LANL, using a force-vector layout. Node size represents betweenness centrality. Edge color is a mix of the colors of the connected nodes. Although individual edges are difficult to discern at this scale, the overall color field reflects the type of units that are most connected in a given region
primary goal is to understand how pre-defined organizational units interact. Organi-zations are colored according to the technical/operational and line/program classifi-cation described above, and their sizes represent betweenness centrality. There are some visible patterns in this layout. First, a number of operations groups have the highest betweenness centrality, reflecting their role as key intermediaries or brokers in the network. Ranking the nodes by betweenness centrality confirms this: 17 of the top 20 nodes are operations organizations. The central position of these organizations probably reflects the fact that they provide services to most of the other organizational units at the laboratory. In addition, operations units and technical units occupy distinct portions of the graph; this indicates that there is generally more interaction within these categories than between them. The highly central operations groups appear to play a bridging role between the two categories. Administration units appear to be somewhat more closely associated with technical units than operations units, although this is difficult to state with certainty.
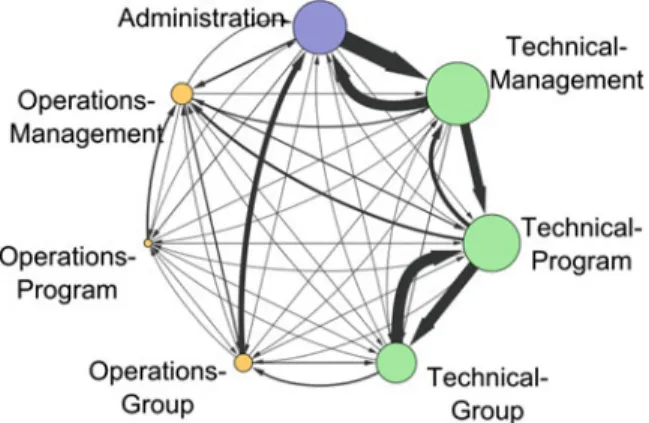
Some of the ambiguities in interpretation can be clarified by grouping all units in a given category into a single node, resulting in the 7-node graph shown in Fig.3. This view, which uses a simple circular layout, reveals that there is a large amount of email traffic (in both directions) on the technical side of the organization along the path Administration—Management—Program—Group, and relatively little traffic
Fig. 3 Email traffic between organization types at LANL. Node diameter represents total degree (i.e. total number of incoming and outgoing emails) of the node; edge width represents email volume in the direction indicated
between these entities along any other path. The operations side of the organization does not display this pattern, indicating that relationships between groups, programs, and management are more fluid there. The strength of the ties between technical pro-gram organizations and both technical groups and technical management, in the absence of a strong direct tie between technical groups and technical management, suggests that technical program organizations serve as a broker between these ele-ments of the organization. This contrasts with the role program organizations play in a true matrix organization, where they represent an independent chain of command from line management. The structure of this relationship at LANL is depicted in Fig.1c.
Figure3also indicates that operations organizations have lower overall volumes of incoming and outgoing email than technical organizations, even though there are similar numbers of employees in each category [18]. There could be a number of rea-sons for this. Operational knowledge may be less complex and more readily codified than technical knowledge, reducing the need for strong interactional ties. Alterna-tively, the nature of operational work, which can take place in the field and involve significant manual labor and use of machinery, may inhibit email communication. Some workers may not have constant access to email during working hours, and communication needs may be more localized and readily satisfied by direct personal interaction. Additional research would be required to fully explore these possibilities. Another way of understanding the roles different types of organizational units play is in terms of their relationships with outside entities. Figure4plots the number of emails each type of organization sends and receives to/from commercial versus non-commercial domains. This indicates that all types of operational units communicate significantly more with commercial entities, which is probably driven by relation-ships with suppliers and contractors. Technical groups, technical management, and administration communicate about equally with commercial and non-commercial
domains. The outlier here is technical programs, which communicate more with external addresses than any other type of organizational unit, and are much more highly connected to non-commercial domains.
These findings suggest that program organizations at LANL occupy the gatekeeper position described in [1, 33]: they serve as brokers between organizational levels, as well as a key link between the laboratory and the outside world—particularly non-commercial entities like academic institutions and other government agencies. Their position between upper management and technical work organizations may reflect their role in translating between management coding schemes and those of technical domain experts, while their position between LANL and external entities suggests a broader role in translating between internal and external coding schemes. There are a number of possible applications of this kind of analysis. Studies have shown that individuals, including managers, are not always accurate in their perceptions of the structure of informal networks in their organizations, beyond the individuals with whom they regularly interact [23]. Quantitative network analysis and visualization can therefore provide significant, data-driven insights that are not ordinarily available to managers and other employees in organizations. The findings presented here show that program organizations at LANL have shifted from their original role as one axis of a management matrix scheme to a role as organizational gatekeepers. In an organization undergoing this kind of shift, some managers or workers may not be completely aware of the nature of the change. In that case, this kind of analysis can provide insights into how to effectively interact with and make use of program organizations. For example, the manager of an administration unit could hypothetically fill a structural hole by developing direct contacts with key program units, in order to gain more insight into the organization’s external relationships. Alternatively, in some organizations, a shift in the nature of program management might pose problems: for example, if management expects program managers to play an active role in matrix management, their role as gatekeepers might conflict with organizational needs. In such a case, analysis and visualization of network relationships between organizational levels could provide a basis for accurate organizational assessment and realignment.
2.2 Structural Relationships Within Organizational Units
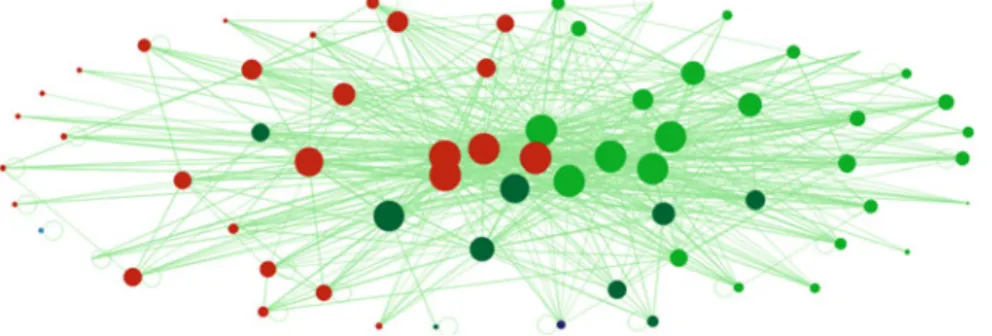
We conducted a small exploratory study to demonstrate use of email network analysis to visualize relations among members of an organizational unit. Figures5and6show email networks that were obtained from email exchange records among the mem-bers of two LANL groups over a period of two weeks. We intentionally chose groups that do similar work (theoretical research). In the smaller group in Fig.5, the two nodes with highest betweenness centrality are group managers, and the third is tech-nical support staff. Thus, the group has a relatively unified hierarchical structure with management and support staff at the center. In the larger group, managers were still among the most central nodes, but many other nodes had similar betweenness
Fig. 4 Total emails to/from commercial (.com, .net, .info) versus non-commercial (.gov, .edu, .mil, etc.) domains, by organization type
Fig. 5 Email network for 2 week period in smaller group. Size of a node is proportional to logarithm of its betweenness centrality. Nodes with different colors correspond to different communities that were identified by application of the Girvan-Newman algorithm to the group’s email network [12,15]. Link widths are proportional to the logarithm of the number of emails exchanged along these links. The network was visualized by assigning repulsion forces among nodes and spring constants proportional to the link weights, and then finding an equilibrium state
centrality (Fig.6). These include administrative assistants, seminar organizers, and several project leaders. This indicates a flatter, less centralized organizational struc-ture. In order to explore group structure, we applied the Girvan-Newman community detection algorithm to each graph [12]. For the first group, this algorithm identified four communities, the significance of which is not clear to us; for the second group, it revealed two main communities that correspond to two previous groups that merged to form the current group. These interpretations could be expanded by use of alterna-tive centrality measures and comparison of various community detection methods.
Fig. 6 Email network for 2 week period in larger group
3 Node Connectivity Distribution as a Function
of Organizational Hierarchy
Several network types, including biological metabolic networks [31], the World Wide Web, and actor networks [30], are conjectured to have power law distributions of node connectivity. In the case of metabolic networks, the interpretation of scale free behavior is complicated by the lack of complete knowledge and relatively small sizes (∼103nodes) of such networks, while the mechanisms of self-similarity in many large social networks are still the subject of debate. However, organizational hierarchy has been shown to generate degree distributions for contacts between individuals that follow power laws [2].
Managers prefer to use email to communicate with subordinates in many different communication contexts [25]. We propose that, in addition to the general effects of organizational hierarchy, particular email communication practices of managers may provide an underlying mechanism that generates power law distributions in node con-nectivity of organizational email networks. To explore this possibility, we develop a scale-free behavioral model that considers the effects of mass email announcements sent by managers to subordinates. In this model, the self-similarity of the connec-tivity distribution of the email network is a consequence of the static self-similarity of the management structure, rather than resulting from a dynamic process, such as preferential attachment [26] or optimization strategies [27]. More specifically, self-similarity is due to the ability of a manager to continuously and directly com-municate only with a relatively small number of people, while communications with other employees have to be conveyed in the form of broad announcements.
Suppose that the top manager in an organization sends emails to all employees from time to time. This manager must correspond to the node in the email network that has highest connectivityN. Suppose that the top manager also talks directly (in person) tol managers that are only one step lower in the director’s hierarchy (let’s call them 1st level managers). Each of those 1st level managers, presumably, control their own subdivisions in the organization. Assuming roughly equal spans of man-agerial control, we can expect that, typically, one 1st level manager sends emails
toN/lpeople. In reality, each manager also has a support team, such as assistants, administrators, technicians, etc. who also may send announcements to the whole subdivision.
Let us introduce a coefficientawhich says how many support team employees are involved in sending global email announcements in the division on the same scale as their manager. We can then conclude that at the 1st level from the top there areal
persons who send emails toN/lemployees at a lower level.
Each 1st level manager controlsl2nd level ones and we can iterate our arguments, leading to the conclusion that there should be(al)2managers on the 2nd level who should be connected toN/(l2)people in their corresponding subdivisions. Continu-ing these arguments to the lower levels of the hierarchy, we find that, at a given level
x, there should be(al)xmanagers (or their proxies) who write email announcements toN/(lx)people in their subdivision.
Consider a plot that shows the number of nodes n versus the weight of those nodes, i.e. their outdegreew. Considering previous arguments, we find that the weight
w = N/(lx)should correspond ton =(al)x nodes. Excluding the variablex, we find
log(n)=log(al)
log(l) (log(N)−log(w)) , (1)
where log is the natural logarithm.
Equation (1) shows that the distribution of connectivity, n(w), in a hierarchi-cal organizational email network should generally be a power law with exponent
log(al)
log(l) >1. Obviously, at some levelx, this hierarchy should terminate around the
point at which(al)x=N/(lx), because the number of managers should not normally exceed the number of employees. Hence the power law (1) is expected to hold only for nodes with heavy weights, e.g.n >50, i.e. for nodes that send announcement-like one-to-many communications, and at lowernthis model predicts a transition to some different pattern of degree distribution. At this level, it is likely that non-hierarchical communication patterns begin to dominate in any case.
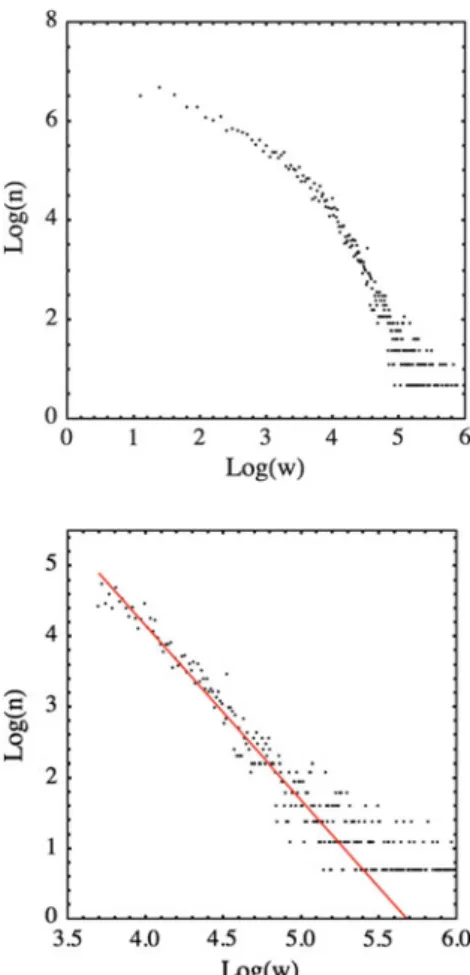
In order to compare this model to actual network data, we analyzed the statistics of node connectivity in email records at LANL during a two-week time interval (Fig.7). We removed nodes not in the domainlanl.govand cleaned the database of various automatically generated messages, such as bouncing emails that do not find their target domain. In this case, however, we kept domains that did not correspond to specific employees, in order to preserve emails from mailing lists that managers may use to communicate with employees. Our remaining network consists ofN ≈32,000 nodes, which is still about three times the number of employees at LANL. This is partially attributed to the fact that we included addresses not tied to individuals, and also the fact that a significant fraction of employees have more than one email address for various practical reasons.
Numerical analysis, in principle, should allow us to obtain information about parametersl,xanda, from which one can make some very coarse-grained conclu-sions about the structure of the organization. Such an analysis should, of course, always be applied with a certain degree of skepticism due to potential issues with
Fig. 7 LogLog plot of the distribution of the number of nodesnhaving the number of out-going linksw
Fig. 8 Zoom of Fig.7
forw>40.Red lineis a linear fit corresponding to log(n)≈14.0−2.47 log(w)
data quality, the simplicity of the model, and logarithmic dependence of the power law on some of these parameters [6]. We found that our data forw >40 could be well fitted by log(n)≈14.0−2.47log(w)(Fig.8). If, e.g., we assumel =4, then
a ≈7, i.e. each manager has the support of typicallya−1 =6 people, who help her post various announcements to her domain of control. The power law should terminate at the level of hierarchyxgiven by(al)x =N/(lx), which corresponds to
x ≈3, i.e. the email network data suggest that there are typicallyx =3 managers of different ranks between the working employee and the top manager of the orga-nization. The typical number of email domains to which the lowest rank manager sends announcements iswmin≈ N/lx ≈48. This should also be the degree of the
nodes at which the power law (1) should be no longer justified. Indeed, we find the breakdown of the power law (1) atw<40. This estimate also predicts that a typical working employee receives emails from(x+1)a =28 managers or their support teams.
Fig. 9 The frequency of non-manager nodes receiving emails from a given number of different managers during the considered time interval. Managers are defined as nodes sending emails to more than 45 different addresses
Comparing these results to the actual organizational structure of the organization is very difficult due to the lack of empirical data on many of the model parameters. However, email data does enable us to independently test the above prediction of
∼28 managers (or their surrogates) sending emails to the lowest rank employees. For purposes of analysis, we define managers as individuals sending emails to more than 45 different addresses during the time interval represented by our data (i.e. belonging to the power law tail of the distribution). We then produced a histogram of the distribution of the number of emails sent to each non-manager by managers. (In reality this corresponds to the number of emails non-managers receive from managers as well as their surrogates.) Figure9shows that this distribution does indeed peak near the mean value≈26, which closely agrees with the model prediction. This result validates our choice forl, which we set to four in previous calculations, and shows that the model is generally consistent with our email data. One can also see from Fig.9 that email network characteristics, such as the number of emails employees receive from managers, are described by a distribution rather than a single number. Our model cannot predict the structure of such distributions. Rather, it is useful as a relatively simple model that can recognize hierarchical features that may be typical for email networks of large organizations. Future validation efforts could involve collecting additional data to measure the actual values of parametersl,xand
afor LANL and other organizations, as well as characterizing patterns of mass email usage in more detail.
Fig. 10 The number of emails sent per minute (top) and number of addresses sending email per minute (bottom) over a one week time interval
4 Email Traffic in Real Time
Figure10shows total email traffic and number of addresses sending email over one week with a one minute resolution. Working days have a bi-modal distribution with heaviest activity at the beginning and end of the day. The lower level of activity on Friday is related to an alternative work schedule that most LANL employees
follow. This schedule enables employees to take every other Friday off in exchange for working longer hours Monday–Thursday. As a consequence, only slightly more than 50 % of the workforce is at work on a given Friday. This is directly reflected in the amount of email traffic on Fridays.
5 Conclusion
Visualizing and modeling email traffic in complex organizations remains a challenging problem. Visualizing email data in terms of formal organizational units reduces com-plexity and provides results that are more intelligible to organization members and analysts interested in understanding organizational structure at a macro level. For predicting the degree distribution of high-degree nodes in an organization, we find that it is useful to take into account both organizational hierarchy and email-specific behavior (in particular, the use of mass emails within line management chains). These findings suggest that considering information about formal organizational structures alongside email network data can provide significant new insights into the function-ing of large, complex organizations.
References
1. Allen TJ, Cohen SI (1969) Information flow in research and development laboratories. Adm Sci Q 14(1):12–19
2. Barabasi A-L, Ravasz E, Vicsek T (2001) Deterministic scale-free networks. Phys A 299: 559–564
3. Bugos GE (1993) Programming the American aerospace industry, 1954–1964: the business structures of technical transactions. Bus Econ Hist 22:210–222
4. Burt RS (1992) Structural holes: the social structure of competition. Harvard University Press, Cambridge
5. Chapanond A, Krishnamoorthy MS, Yener B (2005) Graph theoretic and spectral analysis of Enron email data. Comput Math Organ Theory 11:265–281
6. Clauset A, Shalizi CR, Newman MEJ (2009) Power-law distributions in empirical data. SIAM Rev 51:661–703
7. Collins HM (1985) Changing order: replication and induction in scientific practice. Sage, London
8. Diesner J, Frantz TL, Carley KM (2005) Communication networks from the Enron email corpus ‘It’s always about the people. Enron is no different’. Comput Math Organ Theory 11:201–228 9. Doreian P, Batagelj V, Ferligoj A (2005) Generalized blockmodeling. Cambridge University
Press, Cambridge
10. Freeman LC (2009) Methods of social network visualization. In: Meyers RA (ed) Encyclopedia of complexity and systems science. Springer, Berlin, pp 2981–2998
11. Gillespie R (1991) Manufacturing knowledge: a history of the Hawthorne experiments. Cam-bridge University Press, CamCam-bridge
12. Girvan M, Newman MEJ (2002) Community structure in social and biological networks. Proc Natl Acad Sci 99:7821–7826
14. Hansen MT (1999) The search-transfer problem: the role of weak ties in sharing knowledge across organization subunits. Adm Sci Q 44(1):82–111
15. Hansen DL, Shneiderman B, Smith MA (2011) Analyzing social media networks with NodeXL: insights from a connected world. Elsevier, Burlington
16. http://gephi.github.io/
17. http://www.cytoscape.org/
18. http://www.lanl.gov/about/facts-figures/talent.php
19. Karagiannis T, Vojnovic M (2008) Email information flow in large-scale enterprises.http:// research.microsoft.com/pubs/70586/tr-2008-76.pdf
20. Kilduff M, Tsai W (2003) Social networks and organizations. Sage, London
21. Kossinets G, Watts DJ (2006) Empirical analysis of an evolving social network. Science 311: 88–90
22. Krackhardt D (1992) The strength of strong ties: the importance of Philos in organizations. In: Nohria N, Eccles RG (eds) Networks and organizations: structure, form, and action. Harvard Business School Press, Boston
23. Krackhardt D, Hanson JR (1993) Informal networks: the company behind the chart. Harvard Bus Rev 71(4):104–111
24. Leskovec J, Kleinberg J, Faloutsos C (2007) Graph evolution: densification and shrinking diameters. ACM Trans Knowl Discov Data 1(2)
25. Markus ML (1994) Electronic mail as the medium of managerial choice. Organ Sci 5:502–527 26. Mitzenmacher M (2004) A brief history of generative models for power-law and lognormal
distributions. Internet Math 1:226–251
27. Papadopoulos F, Kitsak M, Serrano MA, Boguna M, Krioukov D (2012) Popularity versus similarity in growing networks. Nature 489:537–540
28. Phelps C, Heidl R, Wadwha A (2012) Knowledge, networks, and knowledge networks: a review and research agenda. J Manag 38:1115–1166
29. Polanyi M (1966) The tacit dimension. Doubleday, Garden City
30. Ravasz E, Barabasi A-L (2003) Hierarchical organization in complex networks. Phys Rev E 67:026112
31. Ravasz E, Somera AL, Mongru DA, Oltvai ZN, Barabasi A-L (2002) Hierarchical organization of modularity in metabolic networks. Science 297:1551–1555
32. Sims BH, Sinitsyn N, Eidenbenz SJ (2013) Visualization and modeling of structural features of a large organizational email network. In: Proceedings of the 2013 IEEE/ACM international conference on advances in social networks analysis and mining. ACM, New York, pp 787–791 33. Tortoriello M, Reagans R, McEvily B (2012) Bridging the knowledge gap: the influence of strong ties, network cohesion, and network range on the transfer of knowledge between orga-nizational units. Organ Sci 4:1024–1039
34. Wuchty S, Uzzi B (2011) Human communication dynamics in digital footsteps: a study of the agreement between self-reported ties and email networks. PLoS ONE 6(11):e26972 35. Zeini S, Göhnert T, Hoppe U, Krempel L (2012) The impact of measurement time on subgroup
detection in online communities. In: Proceedings of the 2012 IEEE/ACM international confer-ence on advances in social networks analysis and mining. IEEE, Los Alamitos, pp 389–394