Durham Research Online
Deposited in DRO:18 May 2016
Version of attached le: Accepted Version
Peer-review status of attached le: Peer-reviewed
Citation for published item:
Copping, L.T. and Cramman, H. and Gott, S. and Gray, H. and Tymms, P. (2016) 'Name writing ability not length of name is predictive of future academic attainment.', Educational research., 58 (3). pp. 237-246. Further information on publisher's website:
http://dx.doi.org/10.1080/00131881.2016.1184948
Publisher's copyright statement:
This is an Accepted Manuscript of an article published by Taylor Francis Group in Educational research on 24/05/2016, available online at: http://www.tandfonline.com/10.1080/00131881.2016.1184948
Use policy
The full-text may be used and/or reproduced, and given to third parties in any format or medium, without prior permission or charge, for personal research or study, educational, or not-for-prot purposes provided that:
• a full bibliographic reference is made to the original source
• alinkis made to the metadata record in DRO
• the full-text is not changed in any way
The full-text must not be sold in any format or medium without the formal permission of the copyright holders. Please consult thefull DRO policyfor further details.
Durham University Library, Stockton Road, Durham DH1 3LY, United Kingdom Tel : +44 (0)191 334 3042 | Fax : +44 (0)191 334 2971
Page 1 of 19
Educational Research RESEARCH NOTE
Name writing ability not length of name is predictive of future academic attainment Lee Copping, Helen Cramman, Sarah Gott, Helen Gray and Peter Tymms
Centre for Evaluation and Monitoring, Durham University, Durham, UK Lee Copping
Centre for Evaluation and Monitoring, Durham University, Durham, UK +44 (0) 191 334 4313
[email protected] Helen Cramman
Centre for Evaluation and Monitoring, Durham University, Durham, UK +44 (0) 191 334 4242
[email protected] Sarah Gott
Centre for Evaluation and Monitoring, Durham University, Durham, UK +44 (0) 191 334 4169
[email protected] Helen Gray
Centre for Evaluation and Monitoring, Durham University, Durham, UK +44 (0) 191 334 4203
[email protected] Peter Tymms
Centre for Evaluation and Monitoring, Durham University, Durham, UK +44 (0) 191 334 4231
The corresponding author is Helen Cramman
Full postal address: Centre for Evaluation and Monitoring, Science Site, Stockton Road, Durham, DH1 3UZ
Word count: 4545 (inc. tables, references and captions)
Page 2 of 19
Structured Abstract Background
The Performance Indicators in Primary Schools On Entry Baseline (PIPS baseline) assessment for pupils starting school includes an item which aims to assess how well a pupil writes his or her own name. There is some debate regarding the utility of this measure, on the grounds that name length may constitute bias.
Purpose, method and design
The predictive validity of this item and its link to name length was investigated with a view to using this item in further assessments. Previous modest scale work from the USA, suggests that name writing ability is a robust indicator which correlates substantively with other known indicators of later reading whilst remaining independent of name length. This paper greatly expanded the sample size and geographical coverage and, rather than concurrent measures, the predictive validity of the item is assessed. The sample includes children from England, Scotland and Australia (N = 14932), assessed between 2011 and 2013. Potential confounding factors that are analysed include age, geographical region and ethnicity.
Findings and conclusions The evidence suggests that the name writing item is a robust measure, with good predictive validity to future academic outcomes in early reading, phonological awareness and mathematics. The length was not related to the ability to write one’s own name nor was it predictive of future outcomes.
Keywords:
Name writing, name length, predictive validity, academic performance. The context
The Performance Indicators in Primary Schools On-Entry Baseline (PIPS Baseline) assessment1 (Tymms 1999a) informs teachers and headteachers about what their pupils know and can do in their first few weeks in formal education, to help improve provision within the school. Since its inception, more than 3.6 million assessments have been carried out using PIPS Baseline and the assessment has been translated into multiple languages (Tymms et al. 2014). In 2013, the international Performance Indicators in Primary Schools (iPIPS) project was established to provide accurate benchmarking for countries across the world with the aim of helping policymakers evaluate education policy and practices (www.ipips.org). More recently, the Centre for Evaluation and Monitoring (CEM) launched its accredited assessment as an approved provider for the UK Department for Education2’s new reception baseline measurement of progress in England’s Primary Schools (Standards and Testing Agency, 2014). CEM’s new assessment, known as BASE3, evolved from the PIPS Baseline assessment.
1 created by Peter Tymms and developed with Christine Merrell
2 The UK’s Department for Education is responsible for education in England. 3 created by Christine Merrell
Page 3 of 19
The PIPS Baseline assessment (Tymms 1999a) covers early reading, phonological awareness and early mathematics. Optional sections on Personal, Social and Emotional Development (PSED) and Behaviour can also be completed by the teacher based on their observations of the pupil. The schools also provide background information including gender, postcode and date of birth for each pupil. The questions in the assessment have been selected due to their performance as indicators of later attainment. Tymms (1999b) sets out the extent to which the sub-sections predict reading and mathematics at age 7 years. The first item which a pupil is presented with in the PIPS Baseline assessment asks the pupil to write his or her name on a piece of paper and the quality of the writing is then scored by the assessor on a six point scale. The name writing item correlated 0.52 with reading and 0.49 with maths in Year 2. Whilst this item appears to be a robust indicator of future academic performance, there is some debate regarding the utility of this measure, on the grounds that name length may constitute bias (discussed below). The name writing measure is not included in the new BASE assessment. This paper aims to investigate the validity of this item as an unbiased predictor within the PIPS Baseline assessment and in particular assess the degree to which name length constitutes bias. Name writing and name length
Name writing is widely accepted as an early step on the path to literacy. The learning of the function of words and letters, may precede, run in parallel with, or happen after the emergence of name writing, making it one of the first steps in literacy development (Bloodgood, 1999). The writing of one’s own name may start as a logographic event; the name is one unit with no recognition of letter values. The ability to write one’s name has been shown to correlate substantively with alphabet knowledge, print knowledge, letter sound knowledge and phonological awareness (Blair and Savage, 2006; Bloodgood, 1999; Puranik, Lonigan and Kim, 2011; Welsch, Sullivan and Justice, 2003). Bloodgood has a seven point scale whereas Puranik and Lonigan, 2012 score name writing on a nine point scale. For both the lowest score, 1 is for scribble, the mid-point in the scales show some letter formation whether it is related to the child’s name or not and the highest score is for fluent and correct writing of the name. The knowledge of letter names and sounds relating to a child’s name was examined in children aged four and five in Australia and the USA (Treiman and Broderick, 1998). They found a significant increase in the number of pupils able to name a letter when the letter presented to them was the initial letter of their first name rather than a randomly selected letter of the alphabet. There were non-significant differences in naming ability when subsequent letters in the children’s names were tested. There were no significant differences between children in knowing the sound of letters where the letter appeared in their name or not. The authors argued that the difference in letter-name and letter-sound knowledge shows that the two are different processes although it may simply be the case that children were told the names of letters more often than the sound they make. They concluded that names for children are not merely logographic entities but that children actively look for links between oral and written language, starting with the first letter of their name. The learning of the first letter acts as ‘critical impetus for further growth in alphabet knowledge’ (Treiman and Broderick, 1998, p.112).
Bloodgood (1999), investigated the relationship of name writing with literacy development amongst children aged three to six and a half in the USA. They reported that name writing
Page 4 of 19
ability is related to other literacy knowledge and that name production correlates with alphabet knowledge, the concept of word and word recognition in four and five year olds. More recent research also seems to indicate that more proficient name writers perform better at literacy tasks than less proficient writers (Welsch et al. 2003; Puranik and Lonigan, 2012). Research also indicates that early spelling strategies may also be linked to knowledge of letters present in one’s own name (Both-de Vries and Bus, 2010). Meta-analytical studies confirm that spelling and name writing are weakly correlated (Lonigan, Schatschneider and Westberg, 2008).
Drouin and Harmon (2009) argued that name writing should not be used as a stand-alone measure of literacy levels. When examining name writing and letter knowledge in preschool children, they noted that whilst there was a relationship between the two, the ability to write their own name did not mean they could name the letters present within it. Similarly, Treiman and Broderick (1999) found that whilst name writing was correlated with letter sound knowledge, children did not necessarily know the sounds of letters in their own name. It is thus difficult to determine whether name writing proficiency reflects actual conceptual understanding of literacy facets or if it simply reflects mechanical, rote learning of the name, in whole or in part (Puranik and Lonigan, 2011).
As noted above, it has been suggested that if name writing ability (and related literacy skills) in pre-schoolers reflected conceptual and phonological understanding of letters, those children with longer names may have an early advantage in emerging literacy development through exposure to more letters. Indeed, an early study by Treiman, Kessler and Bourassa (2001) found that kindergarteners with longer names attempted to overuse letters present in their own name and used phonetically relevant letters less frequently when spelling words. The authors claimed that this spelling error strategy was not random and reflected exposure to a greater number of letters in children with longer names, who subsequently attempt to use them to spell other words. This explanation is corroborated to an extent by the results of Both-de Vries and Bus (2010).
In an empirical test attempting to clarify the importance of name writing, Puranik and Lonigan (2012) further investigated emergent literacy skills and name writing abilities. In two separate studies of pre-schoolers in the USA, length of name (operationalised as the number of unique letters present in the first name) was examined alongside several key measures of early literacy development. Results indicated that there were no significant differences on any measure of literacy development between children with longer and children with shorter name lengths. However, more proficient name writers significantly outperformed less proficient name writers on all literacy based tasks. This demonstrated, with a modest sample in the USA, that whilst the ability to write one’s name is a robust indicator of literacy, it was unrelated to the number of unique letters present therein and represented an indicator of early literacy ability in its own right.
Page 5 of 19
One of the issues surrounding the above work is the relatively small sample size (n=170) and geographical restrictions. Furthermore, the other literacy related measures were collected concurrently. The advantages of the PIPS Baseline assessment are that its widespread use has generated a very large amount of data for the variables of interest, whilst the use of the follow up assessments allow us to examine performance over time in three countries. Here, we also examine effects across different ethnic backgrounds and the measure of name writing ability was investigated in relation to later performance in reading (including vocabulary), phonological awareness and mathematics. The length of a pupil’s name (both first and last) was included in analysis. The current research hypothesised that name writing scores would correlate positively with later outcomes of reading, phonological awareness and mathematics. Furthermore, it is hypothesised that the length of a pupil’s name is independent of both name writing scores and future outcomes.
Method
Data was extracted from historicPIPS Baseline assessments between September 2011 and July 2013. During this time period, the assessment was delivered across England, Scotland and Australia. Analysis for each region was conducted separately to allow for minor differences in item content. The English and Scottish sets of data were sub-samples of larger datasets chosen to be representative of two countries (Tymms et al. 2014).
Pupil age was recorded as age in months and days at the time of testing (Age at Assessment). Only pupils who completed both assessments (start and end of year) were included in the analysis. Additionally, ethnicity data existed for the English cohort. Whilst the data from England and Scotland is representative of the population, the Australian data was sampled opportunistically. See Table 1 for full sample characteristics.
[Table 1 located near here]
The analysis also included controls for Age at Assessment. In the English data set, a further control was also implemented by using the Income Deprivation Affecting Child Index (IDACI) score. The IDACI score is a national level measure indexing the percentage of people in a given postal area classified by the government as impoverished (Noble et al, 2000).
For the purposes of the current study, the name writing scores are considered from the start of year data. Measures of reading, phonological awareness and mathematics are considered from the end of year data set.
Measures from the PIPS Baseline (Start of year) assessment
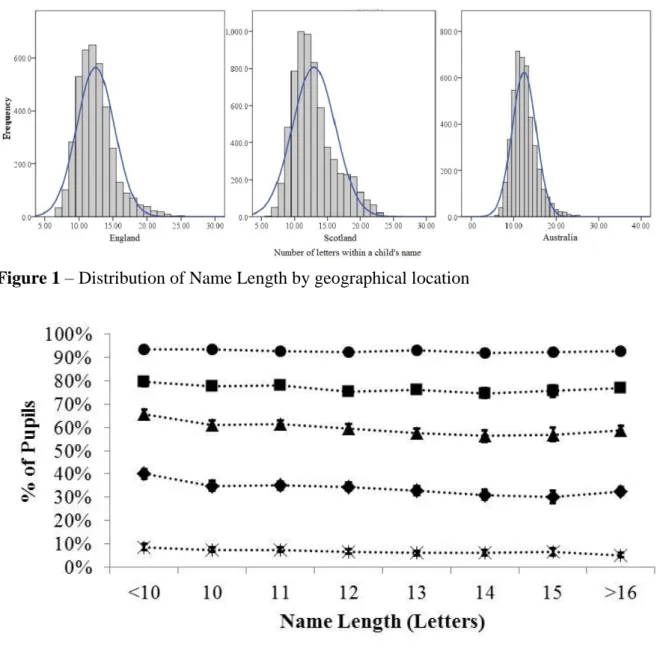
Name Length was measured as the count of the number of letters making up a pupil’s recorded name (first name plus last name). Distributions of name length and further details about this variable are shown in Figure 1 and Tables 2 and 3.
Page 6 of 19
Name Writing Score was captured by pupils writing their names on a piece of paper. The teacher scored the quality of each pupil’s attempt at name writing on a 6 point scale (0-5), based on a series of visual examples and written descriptions.
[Figure 1 located near here] [Table 2 located near here] [Table 3 located near here]
Measures from the PIPS Baseline (End of year) assessment
The assessment is carried out on a one-to-one basis between a pupil and teacher and contains a number of sequences with stopping rules. Each overall measure (Reading, Phonological Awareness and Mathematics) is based on scores achieved in these sequences.
Reading was measured using questions on picture vocabulary, ideas about reading, letter identification, word recognition and reading stories.
Phonological Awareness was measured in two ways. Pupils were asked to repeat unfamiliar or nonsense words of increasing length. Scores were awarded based on their success in repetition. Pupils were also assessed via a rhyming paradigm. Pupils are presented with an image of an object, e.g. cherries, and are instructed to select the picture that rhymes with the target from one of four potential images, e.g. berries.
Mathematics was measured using questions on ideas about maths, counting, simple sums, number recognition, shapes, number manipulation and formal sums.
These end of year measures are summarised in Table 4. [Table 4 located near here]
The analyses
Analysis of correlations was conducted to examine the relationship between Name Length and Name Writing Score, Reading, Phonological Awareness and Mathematics (Table 5).
[Table 5 located near here]
As indicated in Table 5, all correlations between Length of Name and other measures were less than 0.1 and, from an educational point of view effectively zero (significant effects only due to the size of the samples). Sex specific correlations were broadly similar across all measures. This indicates that Length of Name is substantively unrelated to Name Writing, Reading,
Page 7 of 19
Phonological Awareness or Mathematics. By contrast Name Writing significantly and substantively predicts performance across all assessment domains.
[Figure 2 located near here]
Figure 2 illustrates the cumulative percentage scores of pupils scoring 1 to 5 on the Name Writing measure stratified by Name Length, including 95% confidence intervals. While the differences between each Name Length within each scoring bracket are small, children with a name of less than 10 letters are slightly more likely (about 5%) to score a 3 or above and 4 or above on Name Writing scores. The effect size of having a Name Length of less than 10 is small (d = .12).
Table 6 illustrates the same relationships controlling for Age at Assessment (and in the English data set, socioeconomic status indexed by IDACI scores).
As shown in Table 6, when controlling for Age at Assessment and IDACI score, the relationships between Length of Name, Name Writing, Reading, Phonological Awareness and Mathematics are very similar to previous analysis (Table 5).
[Table 6 located near here]
Table 7 shows the correlations and partial correlations (controlling for Age at Assessment and IDACI) between earlier Length of Name and Name Writing score performance on later, Reading, Phonological Awareness and Mathematics scores by ethnic group. This analysis was possible only for the English data set.
[Table 7 located near here]
A similar pattern of very weak correlations is evident across all ethnic groups; White British pupils demonstrating significant results only through a large sample size. Chinese pupils were excluded due to low sample size (n<10). Sex specific correlations were not reported to keep sample sizes adequate for analysis.
Discussion
The ability of a pupil to write their name evidently shows good correlations with performance in Reading, Phonological Awareness and Mathematics one year later. The results demonstrate clearly that the relationship between the number of letters present in a name and the ability to write a name is effectively zero. Children with longer or shorter names do not demonstrate superior abilities in name writing. Furthermore, the length of the name clearly is negligibly linked to measures of reading ability and phonological awareness and mathematics scores one year later.
Page 8 of 19
This indicates that the ability to write one’s name, not the length of the name is a robust predictor of emergent literacy development in young children, supporting the works of Puranik and Lonigan (2012). Name writing is thus a good measure of early literacy proficiency and future academic potential in its own right and would not bias results in favour of pupils with longer or shorter names. Our analysis does not support the view that longer names might confer an advantage. Whilst it may well be that children use letters from their name as part of spelling strategies as found by previous authors (Both-de Vries et al. 2008; Treiman et al. 2001), the use of these strategies does not appear to impact on reading, mathematics or phonological awareness.
These effects were robust over three countries and (where applicable) were independent of age, sex, socioeconomic deprivation and ethnicity, in very large samples of young children. Unlike earlier empirical work in this area (Puranik and Lonigan, 2012; Treiman, Kessle and Bourassa, 2001), our study contributes to the current corpus of literature by extending these research to very large and representative samples of young children outside of the USA.
Whilst these results are supportive of previous findings, the underlying processes behind name writing ability remain unclear. If name writing reflects true conceptual understanding of letter knowledge, we would expect children with longer names (who have greater exposure to more letters) to have a distinct advantage in literacy tasks. Similarly, we would have expected the same effects with measures of phonological awareness. Neither appears to be the case however, despite the fact that name writing, reading and phonological awareness are all correlated. Interestingly, however, the correlation between name writing and mathematics is similar to the relationship between name writing, reading and phonological awareness. It may be the case that name writing proficiency is reflective of greater cognitive development generally rather than literacy alone.
Limitations, implications and avenues for further research
As reported earlier, children are often most interested in the letters present in their forename (Puranik and Lonigan, 2012). In this study, we used the number of letters present in their whole name (forename and surname). Whilst we report the absence of a predictive relationship between the number of letters present in the whole name, reading, phonological awareness, mathematics and name writing, a note of caution should be attached to the interpretation of these relationships. Future research using forename only may reveal a different pattern of results.
Whilst correlations between reading, phonological awareness, mathematics and name writing in this study are broadly similar between England and Scotland, these same relationships tend to be weaker in the Australian sample. It may also be that, whilst the English sample and Scottish samples were examined in relation to other national data sets and were representative of the population generally, we cannot be sure of how representative the Australian sample is.
Page 9 of 19
Whilst this data set did include data regarding ethnicity and socioeconomic circumstances, this was only the case in England. Although these important variables appear to have had no effect on the strengths of the relationships reported in the analysis, extensions of this investigation could be considered in other regions to aid in establishing how robust these effects are. Furthermore, the English sample was predominantly White/British in classification and several of the minorities examined in this study had comparatively small sample sizes. This could be remedied in future work.
References
Blair, R., and R, Savage. 2006. “Name writing but not environmental print recognition is related to letter-sound knowledge and phonological awareness in pre-readers.” Reading and Writing 19: 991–1016.
Bloodgood, J.W. 1999. “What’s in a name? Children’s Name writing and Literacy Acquisition.” Reading Research Quarterly 34: 342-367.
Both-de Vries, A., and A. G. Bus. 2010. “The proper name as starting point for basic reading skills.” Reading and Writing 23: 173–187.
Drouin, M., and J. Harmon. 2009. “Name Writing and Letter Knowledge in pre-schoolers: Incongruities in skills and the usefulness of name writing as a developmental indicator.” Early Childhood Research Quarterly 24: 263-270
Standards and Testing Agency. 2014. “Reception baseline: criteria for potential assessments.” Standards and Testing Agency and Department for Education, May 2014. Accessed 26 July 2015.
https://www.gov.uk/government/uploads/system/uploads/attachment_data/file/415142/Baseli ne_criteria.pdf
Lonigan, C., C. Schatschneider, and L. Westberg. 2008. Results of the national early literacy panel research synthesis: Identification of children’s skills and abilities linked to later outcomes in reading, writing, and spelling, 55–106. Washington, DC: National Early Literacy Panel.
Page 10 of 19
Noble, M., G. A. N. Smith, B. Penhale, G. Wright, C. Dibben, T. Owen, and M. Lloyd. 2000. Measuring Multiple Deprivation at the Small Area Level: The Indices of Deprivation 2000, Regeneration Research Summary, Number 37. London: Department of the Environment, Transport and the Regions.
http://www.communities.gov.uk/publications/regeneration/measuringmultipledeprivation/.
Puranik, C., and C. Lonigan. 2012. “Name-writing proficiency, not length of name, is associated with preschool children’s emergent literacy skills.” Early Childhood Research Quarterly 27: 284-294.
Puranik, C., and C. Lonigan. 2011. “From scribbles to scrabble: Preschool children’s developing knowledge of written language.” Reading and Writing: An Interdisciplinary Journal 24: 567–589.
Puranik, C., C. Lonigan, and Y. Kim. 2011. “Contributions of emergent literacy skills to name writing, letter writing, and spelling in preschool children.” Early Childhood Research Quarterly 26: 465–474.
Treiman, R., and V. Broderick. 1998. “What’s in a Name: Children’s Knowledge about the Letters in Their Own Names.” Journal of Experimental Child Psychology 70: 97-116.
Treiman, R., B. Kessler, and D. Bourassa. 2001. “Children’s own name influences their spelling.” Applied Psycholinguistics 22: 555–580.
Tymms, P.B. 1999a. "Baseline assessment, value-added and the prediction of reading." Review of Journal of Research in Reading 22: 27-36. doi: 10.1111/1467-9817.00066.
Tymms, P. B. 1999b. “Baseline assessment, value-added and the prediction of reading.” Journal of Research in Reading 22: 27-36.
Tymms, Peter, Christine Merrell, David Hawker, and Frazer Nicholson. 2014. Performance Indicators in Primary Schools: A comparison of performance on entry to school and the progress made in the first year in England and four other jurisdictions. London: Department for Education.
Page 11 of 19
https://www.gov.uk/government/uploads/system/uploads/attachment_data/file/318052/RR34 4_-_Performance_Indicators_in_Primary_Schools.pdf
Welsch, J., A. Sullivan, and L. Justice. 2003. “That’s my letter! What preschoolers’ name writing representations tell us about emergent literacy knowledge.” Journal of Literacy Research 35: 757–776.
Page 12 of 19
Table 1: Sample characteristics, mean age* distribution by ethnicity and country All (N/Age*/SD) Male (N/Age*/SD) Female (N/Age*/SD) Total Sample 14932 5.06 .48 7677 5.08 .46 7677 5.08 .49 England All 3912 4.55 .30 2035 4.56 .30 1877 4.55 .30 White 2975 4.55 .30 1539 4.55 .29 1436 4.55 .30 Asian 587 4.56 .31 300 4.55 .31 287 4.56 .31 Chinese 7 4.59 .22 4 4.61 .28 3 4.57 .19 Black 73 4.56 .30 44 4.51 .31 29 4.63 .29 Mixed 151 5.07 .30 81 4.56 .31 70 4.58 .29 Other 25 4.56 .33 16 4.62 .32 9 4.46 .35 Unclassified 94 4.62 .30 51 4.63 .31 43 4.61 .28 Scotland All 6590 5.09 .34 3304 5.11 .35 3286 5.08 .32 Australia All 4430 5.47 .35 2338 5.50 .36 2092 5.44 .35 * Age of candidates at first assessment in years
Page 13 of 19
Table 2: Descriptive statistics of Name Length and Name Writing by geographical location Location England (N = 3912) Scotland (N = 6590) Australia (N = 4430)
Mean/SD/Range Mean/SD/Range Mean/SD/Range Length of Name (letters) 12.44/2.77/7-29 12.96/3.25/6-29 12.46/2.83/6-36 Name Writing Score 1.96/1.28/0-5 2.79/1.37/0-5 3.27/1.12/0-5
Page 14 of 19
Table 3: Cross tabulation of Name Length (letters) with Name Writing (score) Name Length
(Letters)
Name Writing Score
0 1 2 3 4 5 5 0 0 0 0 1 0 6 1 1 1 6 8 4 7 8 17 17 34 57 12 8 41 73 63 117 156 59 9 82 180 194 342 391 97 10 147 344 368 569 601 167 11 205 406 455 723 756 207 12 210 467 432 681 757 184 13 172 400 445 596 639 146 14 138 295 314 429 419 110 15 85 183 204 293 257 72 16 58 124 128 204 214 30 17 32 75 115 131 138 26 18 37 59 73 127 126 25 19 27 63 62 80 95 25 20 16 39 46 56 61 13 21 9 31 27 40 37 12 22 15 14 12 38 30 7 >=23 9 18 22 23 32 4
Page 15 of 19
Table 4: Descriptive statistics for all measures (End of year)
England (N=3912) Scotland (N=6590) Australia (N=4430) Mean/SD/Range Mean/SD/Range Mean/SD/Range Reading 98.66/39.54/4-188 115.86/39.13/7-188 126.29/39.01/4-193 Phonological
Awareness
14.60/3.46/0-17 15.52/2.75/0-17 24.07/5.17/0-28 Mathematics 43.15/9.81/0-68 48.41/8.77/6-69 55.01/9.11/7-74
Page 16 of 19
Table 5: Correlations between Name Writing score and Name Length with later measures scored by sex and region
England (M/F in parentheses) N = 3912 Scotland (M/F in parentheses) N = 6590 Australia (M/F in parentheses) N = 4430 Name Writing Length of Name Name Writing Length of Name Name Writing Length of Name Name Writing - -.05* (-.06*/.06*) - -.03* (-.02/-.06*) - -.07** (-.09**/-.07*) Reading .46** (.42**/.48**) .01 (.03/-.02) .45** (.42**/.46**) .00 (.02/-.03) .31** (.33**/.27**) -.03 (-.01/-.05*) Phonological Awareness .33** (.29**/.35**) .03 (.03/.01) .31** (.29**/.32**) .00 (.03/-.05*) .25** (.26**/.22**) -.02 (-.01/-.04) Mathematics .42** (.42**/.44**) .01 (.01/.01) .40** (.41**/.43**) -.01 (.02/-.03) .34** (.32**/.41**) -.05* (-.02/-.07**) **p<.001, *p<.05
Page 17 of 19
Table 6: Age controlled (and IDACI controlled in England) correlations between Name Writing score and Name Length with later measures scores by sex and region
England (M/F in parentheses) N = 3912 Scotland (M/F in parentheses) N = 6590 Australia (M/F in parentheses) N = 4430 Name Writing Length of Name Name Writing Length of Name Name Writing Length of Name Name Writing - -.05* (-.07*/-.06*) - -.04* (-.02/-.08**) - -.07** (-.09**/-.07*) Reading .41** (.38**/.42 **) .01 (.02/-.02) .44** (.41**/.45* *) .01 (.01/-.04*) .31** (.33**/.27* *) -.03 (-.01/-.05*) Phonological Awareness .28** (.24**/.29 **) .03 (.03/.02) .30** (.29**/.31* *) .00 (.03/-.05*) .25** (.26**/.22* *) -.02 (-.01/-.04) Mathematics .36** (.37**/.37 **) .01 (.00/.01) .38** (.40**/.41* *) -.01 (.01/-.03) .33** (.32**/.41* *) -.05* (-.03/-.07**) **p<.001, *p<.05
Page 18 of 19
Table 7: Correlations for England between Name Writing score, Reading, Mathematics and Name Length by ethnic group (Age and IDACI-controlled partial correlations in parenthesis)
Name Length White N = 2975 Asian N = 587 Chinese N < 10 Black N = 73 Mixed N = 151 Other N = 25 Name Writing -.06** (-.07) -.01 (-.03) - -.04 (-.01) .10 (.15) -.18 (-.17) Reading -.02 (-.01) .09* (.07) - .14 (.18) .02 (.06) .01 (.20) Phonological Awareness .00 (.00) .04 (.03) - .17 (.20) .11 (.13) .05 (.10) Maths -.01 (-.01) .05 (.02) - .20 (.23) .05 (.09) -.12 (.01) **p<.001, *p<.05
Page 19 of 19
Figure 1 – Distribution of Name Length by geographical location
Figure 2 – Percentage of pupils achieving each Name Writing Score or above (with 95% confidence intervals which are small compared to the icons and often not visible)