Integrative Methods for Analysing Big Data in
Precision Medicine
Vladimir Gligorijevi ´c
1,†, No ¨el Malod-Dognin
1,†, and Nata ˇsa Prˇzulj
1,*1Department of Computing, Imperial College London, SW7 2AZ London, United Kingdom *[email protected]
†both authors contributed equally
ABSTRACT
We provide an overview of recent developments in big data analyses in the context of precision medicine and health informatics. With the advance in technologies capturing molecular and medical data, we entered the area of Big Data in biology and medicine. These data offer many opportunities to advance precision medicine. We outline key challenges in precision medicine and present recent advances in data integration-based methods to uncover personalized information from big data produced by various omics studies. We survey recent integrative methods for disease subtyping, bio-markers discovery and drug repurposing, and list the tools that are available to domain scientists. Given the ever-growing nature of these big data, we highlight key issues that big data integration methods will face.
1 Introduction
Precision medicine, also known as personalized, predictive, preventive and participatory (P4) medicine1, is an emerging approach for individualizing the practice of medicine2. Prevention and treatment strategies that take into account individual variability are not new; for example, blood-typing has been used to guide blood transfusion for more than a century, with a total of 35 human blood groups being recognized by the International Society of Blood Transfusion.3Similarly, gender, race, time of ischaemia, cytomegalovirus and sero-type are taken into account to reduce the risk of rejecting organ transplantations4–7. The challenge in applying the precision medicine concept to omics and clinical data sets of patient features that have become available and that cannot be interpreted directly by medical practitioners due to their large sizes and complexities.
Big data is a broad term for data sets so large or complex that traditional data processing methods are inadequate. It is often characterized by three Vs8: volume, which refers to the large size of the data, velocity, which refers to the high speed at which data are generated, and variety, which refers to the heterogeneity of the data coming from different sources. All these characteristics apply to currently available biological and medical datasets. Since the beginning of the Human Genome Project9, novel technological developments led to the era of omics sciences. Using novel high-throughput capturing technologies, we are now able to access the DNA of an individual (genetic data), the transcribed RNA over time (expression and co-expression data), proteins (protein profiles and protein interaction data), metabolism (metabolic profiles) and epigenome (DNA methylation data), among other data types10. The environment is also taken into account (e.g., nutrition and bacterial environment by nutriomics and metagenomics, respectively)11,12, and also histopathological and medical imaging data are now subject to high throughput capturing and analysis methods13–16.
Therefore, we are facing an increasing gap between our ability to generate big biomedical data and our ability to analyse and interpret them17. In this context, it is not surprising that big data and precision medicine are jointly investigated. In 2011, the “Big Data Research and Development Initiative”1was targeting personalized medicine through the GenISIS program (Genomic Information System for Integrated Science) to enhance health care for Veterans. In 2012, the US National Institutes of Health (NIH) launched the “Big Data to Knowledge” initiative, to harvest the wealth of information contained in biomedical Big Data18. Finally, President Obama recently announced the “Precision Medicine” initiative2, with an ambitious goal of driving precision medicine by incorporating many different types of data, from genomes to microbiomes, with patient data collected by health care providers and patients themselves.
Out of many challenges in precision medicine, here we focus on four related problems: patient sub-typing, bio-marker discovery, drug repurposing and personalized treatment prediction. We provide a review of methods capable of integrative analyses of multiple data types in addressing these problems.
1https://www.whitehouse.gov/blog/2012/03/29/big-data-big-deal 2https://www.whitehouse.gov/precision-medicine
Sub-typing and Bio-marker discovery. Also known as patient stratification, sub-typing is the task of identifying sub-populations of patients that can be used to guide treatment procedures of a given individual belonging to the sub-population, and to predict the outcomes. Sub-typing identifiesendotypes, which refer to sub-types in which patients are related by similarities in their underlying disease mechanisms (i.e., to explain the diseases mechanisms)19, andverotypes, which refer to true populations of similar patients for treatment purposes (i.e., to predict therapies for curing the patients)20. However, what precisely constitutes endotypes and verotypes, as well as how they should be discovered, remains open. Despite varying definitions, sub-typing remains a classification task and an active and growing area of machine learning research (see Section3.1). Diseases such as cancer, autism, autoimmune diseases, cardiovascular diseases and Parkinson’s have all been studied through the lens of subtyping21–23.
According to FDA, a bio-marker is any measurable diagnostic indicator that is used to assess the risk, or presence of a disease24. Bio-marker discovery aims at finding features that are characteristic to particular patient sub-populations (e.g., specific gene mutations in tumour tissues, specific miRNAs, metabolites, etc.). The goal is that an individual is only tested for bio-markers to decide whether or not she/he belongs to a specific patient sub-type. Bio-markers are considered key to improving health-care and lowering medical costs25.
Drug repurposing and personalised treatment. Drug repurposing refers to the identification and development of new uses for the existing, or abandoned pharmacotherapies. Capitalising on already known drugs allows for reducing the cost of developing pharmacotherapies compared with de novo drug discovery and development26. With the availability of various omics data, computational predictions of new drug candidates for repurposing have necessitated the development of many new methods for data integration (see Section3.2).
Drug repurposing is not only about identifying new targets for known drugs; preclinical evaluations also include predicting therapeutic regimens (i.e., dose and frequency) and safety of the treatment (i.e., side effects). Bringing together patient sub-typing and precise prediction of therapeutic treatment outcomes is key for deriving personalised treatments. For example, the American Society of Clinical Oncology estimates that testing colon cancer patients for mutations in K-RAS gene would save $604 million in drug costs annually; since patients with these mutationsdonot respond well to EGF inhibitors, it is preferable to avoid giving them an inefficient and potentially toxic treatment, which is also very expensive ($100,000 per treatment)3.
In this paper, we give an overview of the available methods for analysing large and diverse biomedical data, introduce concepts of data integration and classification, and elaborate on the successes and limitations of Big Data approaches in precision medicine.
2 Big Data
2.1 Avalanche of Omics data
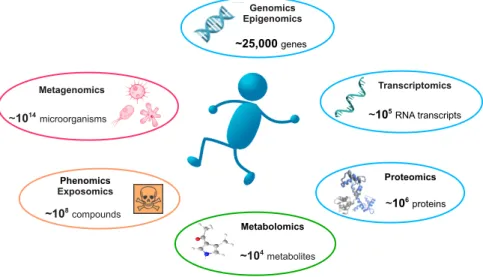
With the recent advances in biomedical data capturing technologies, omics sciences produce ever increasing amounts of biomedical data. We briefly present key available omics data types, which are illustrated in Figure1.
Genomics and exomics. Genomics is a part of genetics that focuses on capturing whole genomes. Historically, the Human Genome Project required 12 years and $3 billion to capture the first human genome, with a final release in 2003 reporting about 20,500 genes9. The first commercial next generation sequencer (NGS), the Roche GS-FLX 454 (released in 2004), allowed capturing the second human genome in two months27. In comparison, a modern NGS such as the Illumina HiSeq X is capable of producing up to 16 human genomes worth of data per three-day run. Note that only 1-2% of a human’s genetic material codes for genes, in DNA regions called exons. Exomics, which focuses on these smaller regions, leads to quicker and cheaper sequencing28,29. Recently, the ability to perform sequencing of individual cells has provided novel insights into human biology and diseases30,31. Heterogeneity in DNA sequence from one cell to another has unveiled the concept ofmosaicism, i.e., the presence of two or more populations of cells with different genotypes in one individual32. Cancer in particular has been studied through the lens of genomic variation to find driver mutations.
Epigenomics. Epigenomics is the study of the complete set of epigenetic modifications of the genetic material of a cell. These reversible modifications on DNA or histones affect gene expression and thus play a major role in gene regulation. High throughput methods, such as ChipSeq and Bisulfit sequencing, allow for detection of epigenetic modifications, such as DNA methylation, histone modification and chromatin structure33,34. Epigenomics findings are cell-type specific and epigenetic reprogramming has a clear role in cancer35,36.
Transcriptomics. As opposed to DNA sequence, which is relatively static37, RNA reflects the dynamic state of a cell. Transcriptomics aims at measuring the amount of transcribed genetic material over time. It includes both coding and non-coding RNAs, whose functions are sometimes unknown38. Co-expressed genes (i.e., with similar expression patterns over time)
Figure 1. Illustration of various omics data types.
have been shown to be likely regulated via the same mechanisms39and differential expression patterns are used to identify dysregulated genes in cancer40, predict possible drug-targets41and cancer outcomes42.
Proteomics and interactomics. While transcriptomics considers all transcribed RNAs, proteomics focuses on the produced proteins, after all post-translational modifications(e.g., phosphorylation, glycolysation and lipidation). The human proteome is several order of magnitude larger than the human genome; because of alternative promoters, alternative splicing, and mRNA editing, the≈25,000 human genes lead to≈100,000 transcripts; with more than 300 different types of post-translational modifications, the number of resulting proteins is estimated to be larger than 1,800,00043. Hight-throughput capture of protein sequences is done via mass spectrometry experiments44. Interactions amongst proteins, or between proteins and other molecules, are captured with high-throughput techniques, such as yeast-two-hybrid45and affinity-captured coupled with mass spectrometry46. Interactomes and protein-protein interactions in particular, were successfully used to identify evolutionarily conserved pathways, complexes and functional orthologs47–49.
Metabolomics, glycomics and fluxomics. A metabolite is any substance produced or consumed during metabolism (all chemical processes in a cell). Metabolomics studies all chemical processes involving metabolites50. Metabolic profiles are measured with mass-spectrometry and nuclear magnetic resonance spectrometry. Glycomics is the branch of metabolomics that studies glycomes, the sets of all sugars – free or in more complex molecules such as glycoproteins – in cells. Glycosylation is the most intensive and complex post-translational modification of proteins and glycans are known to be involved in cell growth and development51, in the immune system52, in cell-to-cell communication53, in cancer and microbial diseases54,55. Fluxomics refers to a range of methods in experimental and computational biology that attempt to identify, or predict the rates of metabolic reactions in biological systems56.
Phenomics and exposomics. Phenomics is an area of biology measuring phenomes – physical and biochemical traits of organisms – as they change in response to genetic mutation and environmental influences. Genome wide association studies (GWAS) are commonly used for detecting associations between single-nucleotide polymorphisms (SNPs) and common diseases such as heart disease, diabetes, auto-immune diseases, and psychiatric disorders57. Exposomics encompasses all human environmental (i.e. non-genetic) exposures from conception onwards. It includes, amongst others, exposure to toxic molecules, drugs and radiation. Exposomics benefits from continuous tracking that is now available for most of the key physiological metrics (blood pressure, heart rhythm, brain waves, etc.) and environmental indices, such as air pollution, pollen count and radiation. Even medical imaging, which was traditionally manually investigated, is now a subject of high-throughput capturing14,15. For example, radiomics (the high-throughput capturing and analysis of medical radio images) recently lead to connectomics, which captures and analyses brain connectivity maps.
Metagenomics. Metagenomics aims at capturing human microbiomes, usually through 16S rRNA sequencing. Our bacterial flora has been shown to play an important role in various medical conditions12; for example, the bacterial flora of the intestine is known to modulate the effects of drugs involved in cancer treatments58. However, taking into account microbiota is challenging,
as human microbiome consists of circa 100 trillion microbial cells, which is about ten times the number of human cells59.
2.2 Biomedical data gets more complex
The complexity of biomedical data grows in two directions: in terms of the number of samples and in terms of heterogeneity.
The growing number of samples. As capturing technologies are becoming faster and cheaper, the number of individuals for whom data is available is quickly increasing. For example, the number of available human genomes/exomes increased almost exponentially during the last decade: the first human exome was released in 20039, while in 2012, 1,092 human genomes were available60. Nowadays, the Exome Aggregation Consortium contains 60,706 unrelated human exomes.4The United Kingdom government recently announced the project to map 100,000 human genomes by 20175and the precision medicine initiative in the US plans to map 1 million human genomes. Note that this increasing number of genome samples will also come at the price of increasing variations in terms of genome quality. Next generation sequencers produce short reads that need to be assembled into genomes. The quality of the assembled genome highly depends on the ratio between the sum of the short read lengths and of the target genomic sequence length. This ratio is called the depth of the sequencing and it is expressed in terms of X (e.g., 2X sequencing means that on average each nucleotide is covered by two short reads). While current sequencing uses≈30X, a recent study argues that high quality genomes may require≈126X (refereed as deep sequencing)61.
Moreover, for the same individual, an increasing number of samples is captured; data can be collected over different tissues, by using single cell genomics62, or on different conditions (e.g., before and after treatment). Finally, the time span of available samples is increasing. For example, gene expression can be measured over time to assess the effect of drugs. Recent developments of non-intrusive capturing techniques (e.g., fetal exome sequencing from maternal blood63and magnetic-resonance-imaging (MRI), capturing brain connectivity maps from unborn babies to adults6) will allow collecting information over the whole life span of an individual, which paves the way to personalized medicine from womb to tomb.
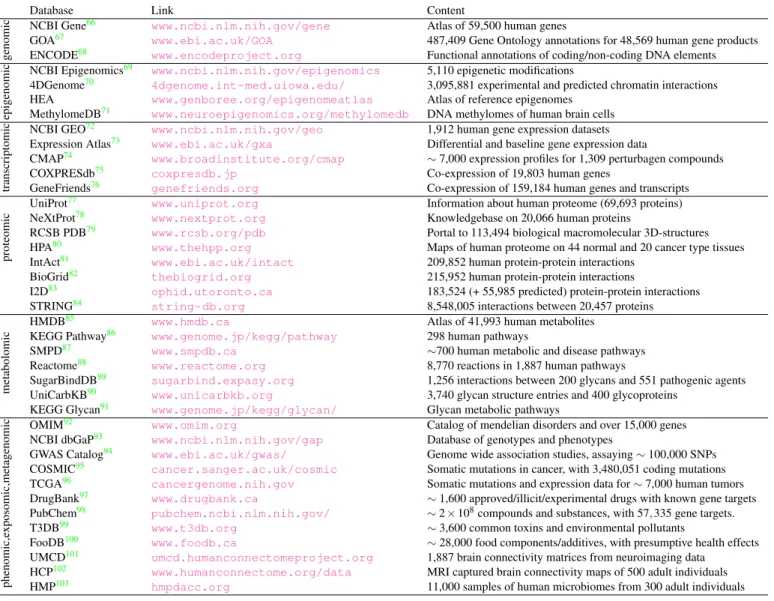
Increasing heterogeneity of captured data. The number of different biological entities (e.g., genes, RNAs, proteins, metabolites, drugs, diseases, etc.) for which data can be collected is increasing. The variety of available data is illustrated in Table1, which presents some of the well established large scale biomedical databases. The collected data are so large that even basic data management is becoming challenging. US healthcare was already storing 150 exabytes (1018Bytes) of data in 2011 and is expected to handle yottabytes of data (1024Bytes) in the next few years7.
These datasets are highly heterogeneous; data from the same type can be captured with different technologies having varying coverage, bias and noise robustness (e.g., the different technologies for capturing protein-protein interactions64), and the same applies across data types. Moreover, the large number of data sources poses data collection issues coming from the lack of standard format in data repositories (so-called data-extraction problem in Big Data65).
3 Machine learning techniques
As described in the previous section, Big Data are of large-scale, diversity and complexity, and as such they require efficient algorithms for extracting knowledge hidden in them. Computational techniques that are used to analyse Big Data are either based on statistical, machine learning (ML), or network-based (NB) methods104. These methods have already demonstrated great potential in bridging the gap between production and interpretation of big data in precision medicine, but there is still a lot of room for their improvements.
ML methods came into focus of Big Data analysis due to their prominent ability tocollectively mine (integrate)large-scale, diverse and heterogeneous biomedical data types, a foremost challenge in precision medicine and medical informatics105. Thus, in this section, we mostly focus on ML methods for data integration, but we also mention some recent statistical and NB methods for data integration.
ML methods can be divided into the following classes(see Fig. 2 for an illustration):
• supervised methods, such as classification and regression, take as input training data samples with known labels. A model is learned through a training process that maximises the accuracy of its performance on the training data set. The model is then used for mapping new data samples to existing labels. For example, an input data can comprise patients classified as cases and controls. A model is learned to maximise the difference between cases and controls and then it is applied in classification of new patients. Some of the widely used supervised techniques include Support Vector Machines (SVM)106, Kernel-based methods107and Logistic regression108.
4Exome Aggregation Consortium (ExAC), Cambridge, MA (http://exac.broadinstitute.org) [09/2015]
5https://www.gov.uk/government/news/human-genome-uk-to-become-world-number-1-in-dna-testing 6Developing Human Connectome Project,http://www.developingconnectome.org/project/
Database Link Content
genomic
NCBI Gene66 www.ncbi.nlm.nih.gov/gene Atlas of 59,500 human genes
GOA67 www.ebi.ac.uk/GOA 487,409 Gene Ontology annotations for 48,569 human gene products
ENCODE68 www.encodeproject.org Functional annotations of coding/non-coding DNA elements
epigenomic
NCBI Epigenomics69 www.ncbi.nlm.nih.gov/epigenomics 5,110 epigenetic modifications
4DGenome70 4dgenome.int-med.uiowa.edu/ 3,095,881 experimental and predicted chromatin interactions HEA www.genboree.org/epigenomeatlas Atlas of reference epigenomes
MethylomeDB71 www.neuroepigenomics.org/methylomedb DNA methylomes of human brain cells
transcriptomic
NCBI GEO72 www.ncbi.nlm.nih.gov/geo 1,912 human gene expression datasets
Expression Atlas73 www.ebi.ac.uk/gxa Differential and baseline gene expression data
CMAP74 www.broadinstitute.org/cmap ∼7,000 expression profiles for 1,309 perturbagen compounds
COXPRESdb75 coxpresdb.jp Co-expression of 19,803 human genes
GeneFriends76 genefriends.org Co-expression of 159,184 human genes and transcripts
proteomic
UniProt77 www.uniprot.org Information about human proteome (69,693 proteins)
NeXtProt78 www.nextprot.org Knowledgebase on 20,066 human proteins
RCSB PDB79 www.rcsb.org/pdb Portal to 113,494 biological macromolecular 3D-structures
HPA80 www.thehpp.org Maps of human proteome on 44 normal and 20 cancer type tissues
IntAct81 www.ebi.ac.uk/intact 209,852 human protein-protein interactions
BioGrid82 thebiogrid.org 215,952 human protein-protein interactions
I2D83 ophid.utoronto.ca 183,524 (+ 55,985 predicted) protein-protein interactions
STRING84 string-db.org 8,548,005 interactions between 20,457 proteins
metabolomic
HMDB85 www.hmdb.ca Atlas of 41,993 human metabolites
KEGG Pathway86 www.genome.jp/kegg/pathway 298 human pathways
SMPD87 www.smpdb.ca ∼700 human metabolic and disease pathways
Reactome88 www.reactome.org 8,770 reactions in 1,887 human pathways
SugarBindDB89 sugarbind.expasy.org 1,256 interactions between 200 glycans and 551 pathogenic agents
UniCarbKB90 www.unicarbkb.org 3,740 glycan structure entries and 400 glycoproteins
KEGG Glycan91 www.genome.jp/kegg/glycan/ Glycan metabolic pathways
phenomic,e
xposomic,metagenomic
OMIM92 www.omim.org Catalog of mendelian disorders and over 15,000 genes NCBI dbGaP93 www.ncbi.nlm.nih.gov/gap Database of genotypes and phenotypes
GWAS Catalog94 www.ebi.ac.uk/gwas/ Genome wide association studies, assaying∼100,000 SNPs COSMIC95 cancer.sanger.ac.uk/cosmic Somatic mutations in cancer, with 3,480,051 coding mutations TCGA96 cancergenome.nih.gov Somatic mutations and expression data for∼7,000 human tumors DrugBank97 www.drugbank.ca ∼1,600 approved/illicit/experimental drugs with known gene targets PubChem98 pubchem.ncbi.nlm.nih.gov/ ∼2×10⁸compounds and substances, with 57,335 gene targets.
T3DB99 www.t3db.org ∼3,600 common toxins and environmental pollutants
FooDB100 www.foodb.ca ∼28,000 food components/additives, with presumptive health effects
UMCD101 umcd.humanconnectomeproject.org 1,887 brain connectivity matrices from neuroimaging data HCP102 www.humanconnectome.org/data MRI captured brain connectivity maps of 500 adult individuals HMP103 hmpdacc.org 11,000 samples of human microbiomes from 300 adult individuals
Table 1.Available data for human. The databases presented in the first row contain genomic data. The databases presented in the second row contain epigenomic data. The databases presented in the third row contain transcriptomic data. The databases presented in the fourth row conatain proteomic data. The databases presented in the fifth row contain metabolomic and glycomic data. The databases presented in the sixth row contain phenomic, exposomic and metagenomic data.
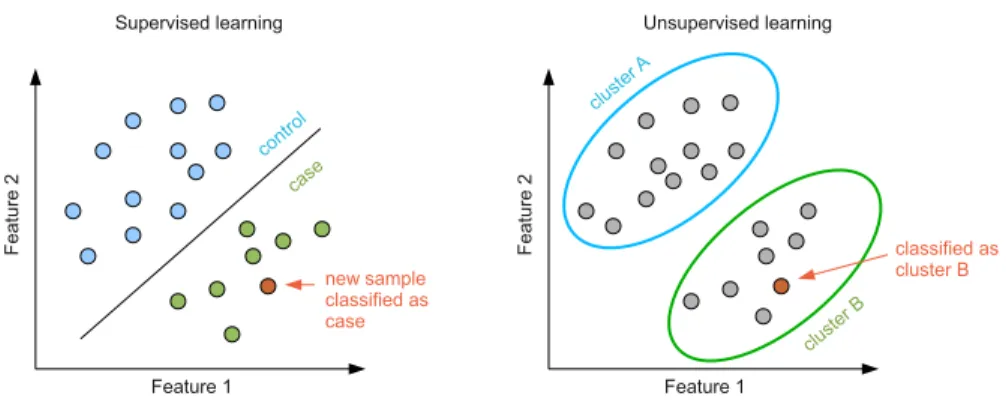
• unsupervised methods, such as clustering and dimensionality reduction, take as input unlabelled data set. A model is learned by revealing hidden patterns in the data and organising the data into meaningful subsets. These methods are often used in molecular subtyping of cancer patients, or in discovering of patterns in gene expression data. Some of the widely used unsupervised methods in precision medicine include hierarchical clustering109, K-means109and its generalisations including matrix factorization methods110.
• semi-supervised methodstake as input a mixture of labelled and unlabelled samples. A model is learned to explain the structure in the data as well as to make new predictions of unlabelled samples. For example, in predicting new drug-disease associations, semi-supervised methods learn known drug-disease associations from labelled samples (i.e., prior knowledge), to predict novel drug-disease associations. This strategy is particularly suitable for data integration, as is can incorporate various data types as prior knowledge. One of the most widely used such method is network-regularised matrix factorization111.
Based on the type of data they integrate, the integration methods can be divided intohomogeneous, where the same type of data, but across multiple perspectives (e.g., experimental studies) is integrated, andheterogeneous, where multiple data types in different formats are integrated. The later is computationally more challenging, because it requires a framework that can
Figure 2.A schematic illustration of the two main learning techniques in ML – supervised (left panel) and
unsupervised (right panel) learning.Left: In supervised learning a training dataset consists of samples with known class labels, e.g., cases and controls. A model is learned by maximizing the difference between cases and controls and then a label for a new sample is determined. Right: In unsupervised learning all samples are unlabelled. A model clusters samples into different groups based on their similarity.
deal with heterogeneous data without transforming it and losing any information through the transformation. A majority of the existing frameworks cannot cope with this issue and they require a pre-processing step prior to integration, where they transform the data into a single representation. In Section3.2, we discuss this issue in more detail and identify methods capable of addressing this problem.
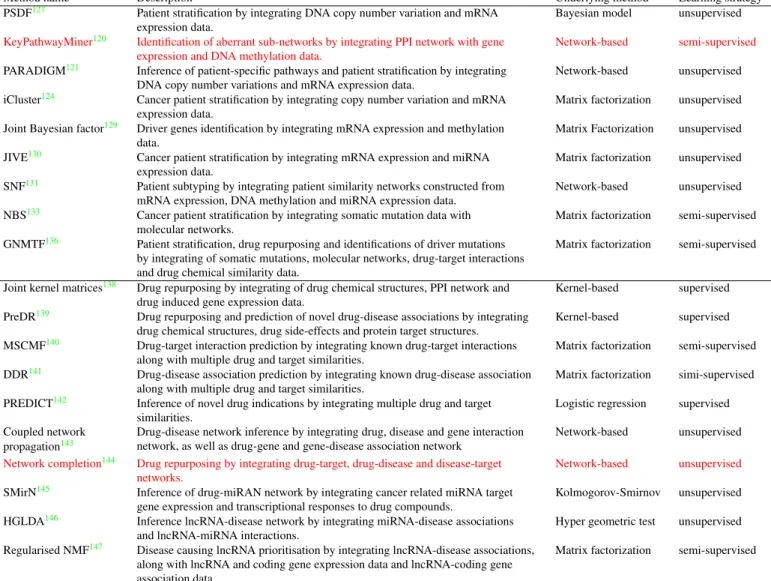
We survey recent integrative methods for disease sub-typing, biomarker discovery and drug repurposing, and provide a summary listing computational tools that can be used by domain scientists for analysing of Big Data (see Table2for the list of methods).The presented methods are chosen based on the following criteria: (1) the method is integrative (i.e., it considers more than one data type) and is applied on biomedical Big Data; (2) the method is predominantly based on Machine Learning (ML) techniques, although we also consider couple of network-based methods; and (3) the method has been used to address one of the the four different precision medicine challenges (see Section 1).
3.1 Computational methods for disease sub-typing and bio-marker discovery
Disease sub-typing (or disease stratification) is a task of grouping patients into subgroups based on genomic, transcriptomic, epigenomic and clinical data. The main goal of sub-typing is achieving more accurate prognoses of individuals’ expected outcomes that can be used to improve treatment decisions. Treatments of many diseases have benefited from sub-typing, including Parkinson’s, cardiovascular, autoimmune diseases and cancer112.
Cancer is one of the most studied diseases by sub-typing. It is a disease in which genome aberrations are accumulating and eventually leading to dysregulation of the cellular system. Histologically similar cancers are composed of many molecular subtypes with significantly different clinical behaviours and molecular complexity at the genomic, epigenomic, transcriptomic and proteomic levels. Many sub-types have been identified by utilising techniques for data integration for various cancer types, including colon and rectal113, breast114and ovarian cancer115.
Unsupervised clustering ML methods, such as hierarchical clustering116, k-means117, consensus clustering118and non-negative matrix factorization119have mostly been applied to gene expression data, by comparing expression levels of disease genes across different samples to identify meaningful subgroups. The most recent of such methods propose to divide patients into clinically relevant subtypes by comparing differentially expressed genes (based on normal and cancer tissue samples)116. Based on the selected set of differentially expressed genes, they calculate the distance between patients and perform hierarchical clustering109. Using mRNA expression data of breast and lung cancer patients, they identifiedfourbreast cancer andfivelung cancer subtypes with significantly different survival rates. Moreover, instead of identifying individual driver mutations, they identify driver mutation modules for each individual subtype. Namely, by using the protein-protein interaction (PPI) network and by mapping the top 15 most frequently mutated genes of each identified subtype onto the network, they search for an optimally connected sub-network covering these genes. The identified sub-networks are postulated as driver modules that can serve as new targets for repurposing of known drugs and their combinations116. Many other studies have also focused on developing methods for identifying aberrant network modules and pathways by utilizing molecular networks and other omics data. For example, Alcarazet al.120developed KeyPathwayMiner, a method for extraction of aberrant network modules from PPI network by integrating gene expression and DNA methylation data. The authors demonstrated the performance of KeyPathwayMiner on TCGA colorectal cancer patients. The method uses heuristic techniques based onant colony optimization
to extract maximally connected sub-networks with a certain number of differentially expressed genes in all patients. The resulting sub-networks was shown to be enriched in genes with over active signalling in colorectal cancer that can be interpreted as potential therapeutic targets. Similarly, Vaskeet al.121developed PARADIGM, a method for inferring patient-specific altered molecular pathways. The methods also allows for identification of common altered pathways among different patients and thus providing patient sub-typing. The authors applied PARADIGM on TCGA gene expression and DNA copy number variations data of glioblastoma multiform patients; based on the significant pathway perturbations the authors divide patient into four different subgroups with significantly different survival outcome.
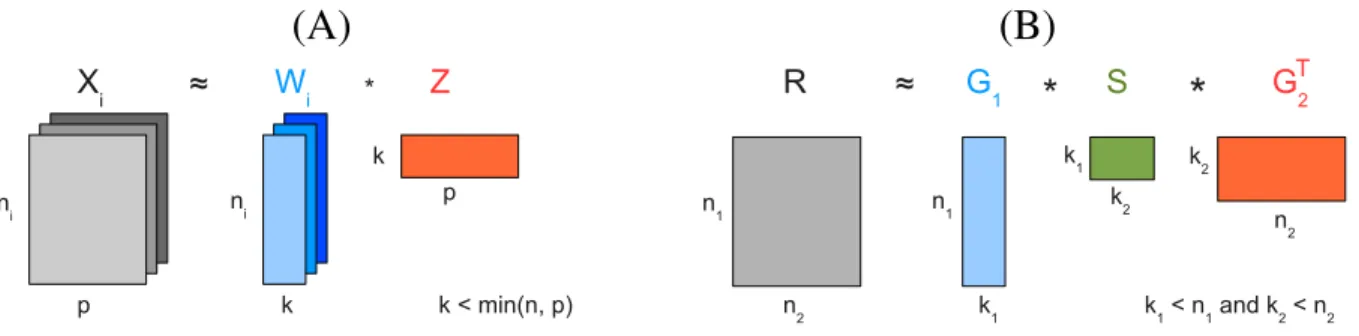
However, a majority of recent methods use integrative approaches to combine multiple types of molecular data, such as DNA copy number alteration, DNA methylation, mRNA and protein expression, and molecular interaction data, accounting for different levels of variations among affected individuals and thereby providing more accurate sub-typing122,123. For example, Shenet al.124developed iCluster, an unsupervised learning framework that can simultaneously perform clustering, data integration, feature selection and dimension reduction of multiple data types. It uses a probabilistic matrix factorization approach to simultaneously decompose data matrices, representing different data types (e.g., DNA methylation, DNA copy number variations, mRNA expression data) over the same number of samples (patients), into a common feature space represented by two low-dimensional matrices(Fig. 3(A)). Specifically, they decompose the data matrices by simultaneously factorizing each data matrix into a product of two low-dimensional matrices. The dimensionality of the low-dimensional matrices represents the number of cancer subtypes and it is a predefined parameter. The first matrix, also calledthe coefficient matrix, is specific to each data type, while the second matrix, also calledthe cluster indicator matrix, is shared across the decomposition. The second matrix captures the dependencies across the data types, and based on its entries it is used for a single, integrated assignment of tumor samples to clusters (subtypes). The authors applied iCluster on DNA copy number variation and gene expression data to stratify breast and lung cancer patients. After obtaining the probabilistic representation of the low-dimensional, cluster indicator matrix, they assign tumor samples to different subgroups. In both the breast and lung cancer data examples, they identify novel subgroups with statistically different clinical outcomes as a result of combined information from the both data types124.
(A)
(B)
Figure 3.Illustration of MF-based methods.(A) Matrix factorization of multiple data matrices,Xi, representing different
data types (e.g., mRNA expression, DNA methylation, copy number variation, etc.) over the same number of samplesp. The matrices are decomposed into a common feature space, represented by matrixZ, that is also a cluster indicator matrix; it is used for assigningpsamples intokclusters. MatricesWicalled coefficient matrices are specific to each data seti. (B)
Tri-factorization of the data matrixRrepresenting relations between two data sets of sizesn1andn2(e.g., drug-target
interactions) into three low-dimensional matrices. MatricesG1andG2are cluster indicator matrices for the first and second
dataset respectively; matrixG1(G2) is used for assigningn1(n2) data points tok1(k2) clusters. MatrixSis the
low-dimensional representation ofR.
iCluster is a widely used tool and it has been applied for subtyping of various cancers. For example, Curtisat al.125, applied it to breast cancer patients from METABRIC (Molecular Taxonomy of Breast Cancer International Consortium) cohort and identifiedtensubgroups with significantly different outcomes. Moreover, they reported significant correlation between genome variations and gene expression data and based on that, they discovered novel putative genes for breast cancer125. iCluster was also applied on TCGA glioblastoma multiforme (the most common and most aggressive malignant brain tumor) data set by simultaneous clustering of DNA copy number variation, methylation and gene expression data126. The authors reveal three distinct tumor subtypes of glioblastoma multiforme, as opposed to the four distinct subtypes reported by previous studies that used solely gene expression data22. This demonstrates the power of integrative analysis over analyses of single data types in characterising, classifying and predicting clinical outcomes of cancer patients.
The first method that deals with detection of contradictory signals across different data types is proposed by Yuanet al.127. They propose a Patient Specific Data Fusion (PSDF) method based on non-parametric Bayesian approach to integrate gene expression and copy number variation data of prostate and breast cancer patients127. A Bayesian approach is a statistical
ML approach that builds a model of data by constructing conditional dependencies between data variables represented by conditional probabilities. One of the widely used methods for learning conditional probabilities is Markov chain Monte Carlo (MCMC) technique128. Unlike other methods, this method successfully detects contradictory signals between different data types arising from different measurement errors. Specifically, a latent variable is assigned to each patient; it measures whether or not the patient’s data are concordant (i.e., in agreement) across different data types. This approach allows for contradictory data information to be suppressed in the patient clustering assignment. The biggest drawback of this approach is that it does not scale well with the number of data types and thus, the authors restrict their analysis only on two data types. Namely, the MCMC step is computationally the most intensive and requires around 48 hours for a single MCMC chain to complete. Despite this drawback, the authors report a novel subtype of prostate cancer patients with extremely poor survival outcome127.
To further take into account data inconsistency across data types, iCluster was further generalised by Rayet al.129 by introducing Bayesian joint factor model built upon iCluster framework. Namely, instead of having a single cluster indicator matrix common for all data types, they further decompose it into shared and data-specific matrix components. Specifically, the cluster indicator matrix is represented as a sum of data type specific and common low-dimensional feature matrices. The common and specific low-dimensional matrices are learned jointly via simultaneous decomposition of all data matrices. This generalisation was shown to be particularly useful for joint analysis of multi-platform genomic data, as it allows more flexibility in the decomposition of distinct data types. Moreover, the authors reported better performance of their model compared to iCluster, because unlike iCluster, that enforces all tumor samples to be included into the clustering procedure, the proposed model can selectively choose between more and less correlated samples across data types when performing clustering assignment. The authors demonstrated their method on TCGA gene expression, copy number variation and methylation data of ovarian cancer patients, particularly for uncovering key driver genes in ovarian cancer129. Similarly, Locket al.130introduced JIVE (Joint and Individual Variation Explained), a method which instead of having the same coefficient matrices for shared and data-specific components proposed a model with different coefficient matrices corresponding to joint and data-specific components capturing low-dimensional joint variations across data types, as well as variations specific to each data type. With this extension, JIVE performed a better characterisation of tumor subtypes, as well as a better understanding of the biological interactions between different data types130.
To overcome scalability drawbacks of the previous ML clustering methods, that operate with high-dimensional gene ×patient matrices, Wanget al.131 proposed a network-based method that integrates data represented by patient×patient matrices. This method, called Similarity Network Fusion (SNF), combines mRNA expression, DNA methylation and microRNA expression data for the same set of cancer patients. First, for each data type, it constructs a weighted network of patients, with nodes being patients and weighted links being similarities between patients. The similarities are computed based on their gene profiles for a particular data type. Second, it normalises weights of each network by taking into account the networks from all data types. Finally, it fuses all the networks into a single network by performing a diffusion of information within each network and across different networks. After the convergence of the diffusion process, the authors use a spectral clustering method132on the final fused network to group patients into clusters. Unlike the previous methods, SNF is more scalable. Namely, instead of processing large-scale matrices constructed over a large number of genes, SNF method fuses much smaller matrices representing networks constructed over patients (i.e., samples), which makes the convergence faster. SNF is shown to be robust to noise and when applied on five different cancer types from TCGA database, it was shown to be effective in prediction of patient survival outcomes131.
A majority of studies are based on analysing mRNA expression data from RNA sequencing and microarrays, and DNA copy number alteration data. Because of noisiness of these data, the patient stratification studies for cancer types often do not produce patient subgroups that agree well with any clinical, or survival data113. To overcome these shortcomings, Hofree et al133 recently proposed the use of somatic mutation data as a new source of information for cancer patient stratification. However, highly heterogeneous somatic mutation profiles between different patients make the use of somatic mutations for patient stratification into subtypes much harder115,133,134. Namely, two clinically identical tumors rarely have a large set of common mutated genes. Moreover, very few genes are frequently mutated across tumor samples. However, despite this genetic diversity between tumor samples, the perturbed pathways are often similar134. Therefore, Hofreeet al.133 proposed to address this problem by integrating somatic mutations with molecular networks that contain pathways. Their method, called Network-based Stratification (NBS), is based on network-regularised non-negative matrix factorization135. Namely, they factorize patient-gene binary matrix, encoding patients’ somatic mutation profiles, into a product of two low-dimensional, non-negative matrices; the second of which being the cluster indicator matrix. The non-negativity constraint provides an easier interpretation of clustering assignment of tumor samples. They further incorporate molecular networks into the clustering procedure by constraining the construction of the cluster indicator matrix to respect the local network connectivity. This semi-supervised approach uses molecular networks as prior knowledge about clusters, ensuring that the patients are grouped not only based on the similarity of their somatic mutation profiles, but also based on the proximity of their mutated genes in the molecular network. Using the consensus clustering method118applied on the final cluster indicator matrix, the authors stratify patients into different
subgroups. The method was applied on ovarian, uterine and lung cancer patients from TCGA database, and it yielded cancer subtypes with different clinical outcomes, response to therapies and tumor histologies.
MF-based methods are promising for mining heterogeneous datasets. These methods have a potential to incorporate any number and type of heterogeneous data and to perform comprehensive analyses. We recently made a step towards this goal and extended the NBS method to incorporate drug data into the framework136. Unlike the previous, our method is more comprehensive because it can simultaneously perform three tasks: cancer patient subtyping, drug repurposing and biomarker discovery (driver gene identification). We used Graph-regularized Non-negative Matrix Tri-Factorization (GNMTF)111(see Fig.3(B) for an illustration)approach to integrate somatic mutation profiles of ovarian cancer patients, molecular networks, drug-target interactions and drug chemical similarity data. We simultaneously tri-factorize patient-gene and drug-target matrix by sharing common low-dimensional matrix factors representing cluster indicator matrices. We compute three different cluster indicator matrices used for clustering assignment of genes, patients and drugs, respectively. The computation of the gene cluster indicator matrix is constrained byconnectivity of integratedmolecular network, whereas the computation of the drug cluster indicator matrix is constrained by drug chemical similarities.The integrated network is composed of three different
molecular networks, namely, PPI, genetic and metabolic interaction networks.Given that GNMTF is both a co-clustering and
dimensionality reduction approach, we use GNMTF to perform the following three tasks; 1) we use the patient cluster indicator matrix to stratify ovarian cancer patients into different subgroups with different clinical outcomes; 2) we use the gene cluster indicator matrix to uncover gene modules enriched in driver mutations and postulate new genes as drivers of tumor progression; and 3) we use the matrix completion property of the drug-target matrix to predict novel drug-target interactions and discover new drug candidates that can be repurposed to treat ovarian cancer patients.
Challenges and open questions. Identification of disease subtypes has been shown to be both data and method dependent. Moreover, there is no consensus in the literature about the number of subtypes of a particular cancer type. Depending on the methods and data types they use, different studies report different numbers of subtypes of a particular cancer type (e.g., breast cancer). Also, unsupervised methods require the number of subtypes to be predetermined. Determining the number of subtypes is not a straightforward task and different approaches can be used to discover the correct number of clusters in the data. For example, iCluster uses a cross-validation technique124, while NBS determines the number of subtypes based on the stability of the consensus clustering133. Furthermore, there is an urgent need for a reference data set that should be used in future studies for systematic evaluation and comparisons of methods.
Moreover, many of the above mentioned integrative methods for subtyping are incapable of simultaneously considering different data types. For example, SNF method can only integrate data types given by continuous variables (e.g., mRNA expression levels), as they can be easily used for construction of similarity networks. However, SNF cannot incorporate somatic mutation profiles, as it cannot construct a similarity network from highly heterogeneous somatic mutation profiles. Namely, due to the small overlap between somatic mutation profiles across different patients, it is difficult to define a proper similarity measure between patients. Approaches such as NBS and GNMTF are more convenient for integration of somatic mutation profiles. Very few studies integrate somatic mutation data with mRNA and methylation data, due to the difficulty in integrating binary with continuous data types137.
A proper normalisation of different data types is another issue in integrative data analyses. If not properly accounted for it often results in cases where the largest data set wins. Unlike iCluster, JIVE properly takes into account the data normalisation problem130.
3.2 Computational methods for drug repurposing and personalised treatments
Various computational methods for drug repurposing have been proposed and they can be classified under different criteria. For example, from the data viewpoint, Dudleyet al.148suggested classification intodrug-basedanddisease-basedmethods. The first group of methods uses some notion of similarity between drugs (e.g., chemical similarity149, similarity between gene expressions induced by drug actions74, or drug-side effect similarity150) to group drugs and infer a novel drug candidate for repurposing from the group that can perform the same action as other drugs in the group. The second group of methods uses similarities between diseases (e.g., phenotype similarity151, or similarity between disease symptoms152) to group diseases and to infer a novel drug for repurposing by expanding known associations between the drug and some members of the group to the rest of the group. Other approaches usetarget-basedsimilarities153, i.e., protein sequence similarity154, or 3D structural similarity155, to infer novel drugs. On the other hand, all three approaches can be classified assimilarity-based approaches153. They often use either machine-learning, or network-based methods in the drug inference process. Other computational approaches includemolecular docking simulationapproaches that deal with prediction of a binding place of a drug within protein 3D structure156. However, the biggest limitations of these methods are the lack of knowledge of 3D structures for many protein targets and extensive computational costs for testing a single drug-target interaction.
A full review of similarity-based and molecular docking approaches for single data type analyses is beyond the scope of this article and we refer the reader to recent review articles by Liet al.157 and Dinget al.153. Here, we focus on integrative
Method name Description Underlying method Learning strategy PSDF127 Patient stratification by integrating DNA copy number variation and mRNA
expression data.
Bayesian model unsupervised KeyPathwayMiner120 Identification of aberrant sub-networks by integrating PPI network with gene
expression and DNA methylation data.
Network-based semi-supervised PARADIGM121 Inference of patient-specific pathways and patient stratification by integrating
DNA copy number variations and mRNA expression data.
Network-based unsupervised iCluster124 Cancer patient stratification by integrating copy number variation and mRNA
expression data.
Matrix factorization unsupervised Joint Bayesian factor129 Driver genes identification by integrating mRNA expression and methylation
data.
Matrix Factorization unsupervised JIVE130 Cancer patient stratification by integrating mRNA expression and miRNA
expression data.
Matrix factorization unsupervised SNF131 Patient subtyping by integrating patient similarity networks constructed from
mRNA expression, DNA methylation and miRNA expression data.
Network-based unsupervised NBS133 Cancer patient stratification by integrating somatic mutation data with
molecular networks.
Matrix factorization semi-supervised GNMTF136 Patient stratification, drug repurposing and identifications of driver mutations
by integrating of somatic mutations, molecular networks, drug-target interactions and drug chemical similarity data.
Matrix factorization semi-supervised
Joint kernel matrices138 Drug repurposing by integrating of drug chemical structures, PPI network and drug induced gene expression data.
Kernel-based supervised PreDR139 Drug repurposing and prediction of novel drug-disease associations by integrating
drug chemical structures, drug side-effects and protein target structures.
Kernel-based supervised MSCMF140 Drug-target interaction prediction by integrating known drug-target interactions
along with multiple drug and target similarities.
Matrix factorization semi-supervised DDR141 Drug-disease association prediction by integrating known drug-disease association
along with multiple drug and target similarities.
Matrix factorization simi-supervised PREDICT142 Inference of novel drug indications by integrating multiple drug and target
similarities.
Logistic regression supervised Coupled network
propagation143
Drug-disease network inference by integrating drug, disease and gene interaction network, as well as drug-gene and gene-disease association network
Network-based unsupervised Network completion144 Drug repurposing by integrating drug-target, drug-disease and disease-target
networks.
Network-based unsupervised SMirN145 Inference of drug-miRAN network by integrating cancer related miRNA target
gene expression and transcriptional responses to drug compounds.
Kolmogorov-Smirnov unsupervised HGLDA146 Inference lncRNA-disease network by integrating miRNA-disease associations
and lncRNA-miRNA interactions.
Hyper geometric test unsupervised Regularised NMF147 Disease causing lncRNA prioritisation by integrating lncRNA-disease associations,
along with lncRNA and coding gene expression data and lncRNA-coding gene association data.
Matrix factorization semi-supervised
Table 2.Summary of methods for integrative analyses in precision medicine. The first group of methods is used for
sub-typing and biomarker discovery; the second group is used for drug repurposing and therapy prediction. Some methods can be belong to both categories (e.g., GNMTF).
methods capable of integrating various similarities from different data types containing complementary information, such as pharmacological, chemical, genetic and clinical data. Namely, due to heterogeneity and complexity of many diseases characterised with different subtypes, drugs are not always equally efficient in treatment of the same disease. Thus, the overarching goal of precision medicine is to take into account molecular diversity between individuals when diagnosing patients and prescribing drugs specific to each individual158. With the Big Data initiative (see Section2), integrative computational approaches have started attracting more attention due to their ability to address this goal.
For example, Napolitanoet al.138used a kernel-based (KB) method106to integrate drug chemical similarity, PPI network and drug induced gene expression data after a patient treatment. Each data is represented by a kernel matrix in a drug-centered feature space. Particularly, the three kernel matrices represent drug-drug similarities based on: 1) drug chemical structures from DrugBank; 2) proximity of their targets in the PPI network; and 3) correlations between gene profiles under the drug’s influence retrieved from CMap database. After combining these kernel matrices into a single kernel matrix, the authors applied a Support Vector Machine (SVM), a supervised machine learning method for classification. They trained the SVM on the existing drug classification achieving 78% of classification accuracy and they used the top scoring misclassified drugs as new candidates for repurposing138. A similar approach was used by Wanget al.139, who developed a PreDR (PredictDrugRepurposing) method where drug-centered kernel matrices represent: 1) drug chemical similarities obtained from PubChem database; 2) target (protein) sequence similarities retrieved from KEGG BRITE and DrugBank; and 3) drug side-effect similarities for
SIDER database. The disease-centered kernel matrix represents disease similarities measured by their semantic similarity of disease phenotypes retrieved from OMIM database. The authors trained the SVM classifier on the combined kernel matrix and reported accuracy in identifying novel drug-disease interactions.
Zheng et al.140 developed an integrative framework called Multiple Similarities Collaborative Matrix Factorization (MSCMF) for drug-target prediction. It takes as an input a matrix representing drug-target interactions, as well as multiple matrices representing different types of similarities between drugs and targets constructed from various databases. MSCMF projects drugs and targets into a common low-dimensional feature space by factorizing the drug-target matrix into a product of two low-dimensional matrices representing drug and target low-dimensional feature vectors, respectively. The computation of low-dimensional matrices of drugs and targets is done in a semi-supervised manner by constraining their values to be consistent with drug-drug and target-target similarity matrices, respectively. Namely, the similarity between two drugs is approximated by the inner product of their corresponding feature vectors. The same is applied on target feature vectors. The authors mathematically formulated the factorization condition and constraints within the same objective function, which they minimise by applying the Alternating Least Squares (ALS) algorithm159. After convergence, they reconstructed the drug-target matrix from the obtained low-dimensional matrices (i.e., from matrix completion) and extracted new, previously unobserved entries representing predicted drug-target interactions. MSCMF is shown to perform better than the previous state-of-the-art methods for drug-target prediction. Moreover, the big advantage of MSCMF over the previous methods is the fact that it can integrate similarities from multiple data sources over the same set of drugs or targets and estimate their influence onto the quality of the drug-target prediction.
Similar to MSCMF, Zhanget al.141proposed DDR (Drug Disease Repositioning), a semi-supervised, matrix tri-factorization-based framework for novel drug-disease association prediction. It takes as input known drug-disease associations, as well as multiple drug and multiple disease similarity networks and generates new drug-disease associations. In particular, it constructs three drug similarity matrices based on their chemical structures, side-effects and target proteins and three disease similarity matrices based on their phenotypes, Disease Ontology and disease genes. The predicted associations are validated in clinical trial databases. Unlike MSCMF, DDR factorizes drug-disease associations into a product of three low-dimensional matrices, where the first and the last matrices can be interpreted as cluster assignment matrices of drugs and diseases, respectively. These matrices can be used to identify subgroups of highly correlated drugs and diseases, thus providing additional insights for drug repurposing by identifying a group of similar drug candidates that can be used in clinical trials.
Gottliebet al.142developed a supervised method, called PREDICT (PREdictingDrugIndiCaTions). First, it computes drug-drug and disease-disease similarity measures from five and six different drug and disease data sources, respectively. Second, based on these similarities, it constructs an overall similarity for each drug-disease pair. Finally, based on the drug-disease similarity, it trains a logistic regression classifier on correctly classifying known drug-disease associations. The authors demonstrated a great accuracy of PREDICT in identifying novel indications of drugs with Area Under the ROC curve (AUC)160of 0.92. Moreover, they propose PREDICT as a general framework that can be used in future personalized drug treatments by incorporating gene expression data of disease patients into the framework.
All previous methods use either supervised, or semi-supervised strategy in predicting drug-target, or drug-disease asso-ciations and thus, they require a gold standard (i.e., a set of known assoasso-ciations) to train their models. For many specific diseases, that data set is unknown, or incomplete, which makes the use of the methods more difficult. To overcome this, Huang et al.143 proposed a completely unsupervised integrative method that can infer drug-disease associations without any prior associations. They used coupled network propagation161on drug-drug chemical similarity, disease-disease phenotype similarity and gene-gene co-expression similarity homogeneous networks, connected by drug-gene and gene-disease heterogeneous networks. They applied their method on data for prostate and colorectal cancer patients. They identified top scoring drugs predicted to be used in treatment of these groups of patients.Another unsupervised, network-based method for heterogeneous network integration and drug repurposing was introduced by Daminelliet al.144. They predicted novel drug-target associations by completing incomplete bi-cliques in the integrated drug–target–disease network. They demonstrate the power of their method by predicting novel drugs for cardiovascular and parasitic diseases, as well as by predicting novel drugs for cancer-related kinases. For other network-based methods for drug repurposing we refer a reader to a recent review paper by Wuet al.162.
Non-coding RNAs, in particular microRNAs (or miRNAs) and long non-coding RNAs (lncRNAs), have recently started attracting attention due to their involvement in various diseases, including cancer and autoimmune disorders163and thus, have been proposed as potential biomarkers146,164and drug targets165,166. Due to large collections of transcriptional and drug data being available, new computational methods for identification of miRNAs as potential drug targets have recently been proposed. For example, Jianget al.145 proposed a framework for construction of a network, SMirN, of interactions between small drug molecules (compounds) and miRNAs using data from different human cancers. Specifically, they used transcriptional responses to compounds and differentially expressed miRNA target genes in 23 different human cancers. For each miRNA, they partitioned their target genes into GO modules, and for each GO module they evaluated the association between its differentially expressed target genes and the transcriptional response to the compound by using Kolmogorov-Smirnov test. If
these associations are confirmed for a significant number of GO modules of a particular miRNA, then the authors hypothesized a link between the miRNA and the corresponding drug compound. They analysed the SMirN network and separately grouped miRNAs and compounds into modules, based on which they infer novel potential miRNA targets, as well as novel drug compounds that can be used in drug repurposing for cancer therapy. Chen167developed a novel model of HyperGeometric distribution for lncRNA-Disease Associations (HGLDA) inference. The model integrates known miRNA-disease associations and lncRNA-miRNA interactions and without a gold standard data set, it infers a network of lncRNA-disease associations with AUC of 0.76 in the leave-one-out cross validation. Based on the top 19 predicted associations, they reported novel lncRNAs involved in breast, lung and colorectal cancer that can be used as novel biomarkers for diagnosis of these cancers. A more sophisticated integrative method, based on non-negative matrix factorizaton, was recently proposed by Biswaset al.,147. They factorize lncRNA-disease association matrix into a product of two non-negative, low-dimensional matrices specific to lncRNAs and diseases, respectively. The non-negativity of the obtained, low-dimensional matrices allows for easier extraction of lncRNA and disease subgroups in the data. They can also be interpreted as cluster assignment matrices for lncRNAs and diseases, respectively. The factorization of the lncRNA-disease association matrix was done in a semi-supervised way, by constraining the construction of the low-dimensional matrices with additional data, including coding gene and lncRNA expression data, as well as lncRNA-coding gene association network. The authors identified several biologically relevant lncRNA and disease groups. Based on the membership scores in the lncRNA low-dimensional matrix, they ranked disease causing lncRNAs for each particular disease. They identified a prominent group of lncRNAs associated with heart diseases, as well as a group of lncRNAs strongly associated with neurological disorders that can be used in future experimental testing as biomarkers of these disorders.
Challenges and open questions. Many of the methods presented in this section require different data types to be represented in common feature space. For example, KB methods (e.g., PreDR) require the matrices of all data types to be constructed over the same set of entities (e.g., drugs, or diseases). This often requires transforming the data that may lead to information loss. On the other hand, MF-based methods (e.g., MSCMF) can handle these heterogeneous data without any data transformation and thus, without any information loss. Also, many methods require choosing an appropriate similarity measure to integrate various data types. This is not always a straightforward task and different measures may results in different final conclusions. Similar to the methods described in section 3.1, the methods for drug-target (and drug-disease) prediction and drug repurposing are lacking a reference corpus of data for comparing their performances.
4 Challenges and perspectives
As presented in Section2, biomedical data are increasingly becoming available and dealing with their “three V” components will impose many challenges and open questions. For example, in addressing Big Data’s volume (i.e., high dimensionality), many dimensionality reduction techniques have been devised, reviewed in Sections3.1and3.2. However, they are all computationally intensive on large-scale data sets and devising techniques that are both efficient and accurate in revealing hidden substructures in them is still an open question. One of the possible solutions to addressing this question might be Topological Data Analysis methods (TDAs)168,169. TDAs use mathematical concepts developed in algebraic topology. TDAs analyse Big Data by converting them into low-dimensional geometric representations from which they extract shapes (patterns) and obtain insight into them. These methods have been shown to be more efficient in finding substructures in large-scale data sets than standard methods, such as clustering, or principal component analysis methods. Moreover, they succeed in finding hidden structures in the data that standard methods failed to discover169.
Dealing with Big Data’s velocity (i.e., coping with its growth over time) is particularly challenging and poorly addressed in the literature on precision medicine. One of the possible future directions in addressing this challenge is the utilisation of so-called “anytime algorithms”170that can learn from streaming data (e.g., time-dependent Bayesian classifiers)171and that still return a valuable result if their execution is interrupted at any time. Moreover, in the future, we will have access to more and more time series data. At the moment, such times series are either pre-processed to find patterns, e.g., time series of expression data are either used to find genes with time-correlated expression (co-expression network), or used to study the effect of drugs on short time scales by differential expression analysis. With the increasing number of measured features and the increasing time span of the measurements, a key challenge will be to find a data integration model that will directly mine time series measurements for which the time spans and frequencies of measurements vary greatly.
The Big Data’s variety (i.e., heterogeneity) has been addressed by many methods as presented in Section3.2. MF-based methods are promising for mining heterogeneous datasets. Although GNMTF is a versatile data integration framework136, its computational complexity increases with the number of data types to be integrated. Thus, integrating large numbers of heterogeneous data types within the MF-based framework necessitates novel algorithmic improvements.
Extracting complementary information conveyed in data of different formats and types is another challenge that is partially addressed by the presented integrative methods. For example, proteomics data have been shown to be a good complement to other omics data. Namely, many studies have confirmed that proteins having physical interactions in a PPI network are more
likely to have correlated co-expression profiles of their corresponding genes172. On the contrary, protein physical interactions are less likely to coincide to genetic interactions (GI) of the their corresponding genes173. Thus, integrating GI network with PPI network and other molecular networks has been shown to be beneficial in many biological problems133,136,174.
Moreover, many data types including exposomics and metagenomics data are yet to be analysied and their integration with other data will be a focus of future studies. For example, much of an individual’s health data, such as demographic data, personal and family medical history, vaccination records, laboratory tests and imaging results are systematically being collected and stored in Electronic Health Records (EHR). EHR data are increasingly becoming available for academic research purposes and they present numerous computational challenges that are yet to be addressed. Two major computational challenges include developing algorithms for: 1) individualphenotyping(i.e., annotating patient records with disease conditions)175and 2) integration of EHR data with omics data for better understanding of disease mechanisms and treatments176. The biggest obstacles of the first challenge are nosiness and incompleteness of the EHR data that needs to be properly taken into account. On the other hand, the biggest obstacles of the second challenge are heterogeneity and different format types of EHR and genomic data. Some steps towards addressing these challenges have been made175,176, but developing methods that can overcome these obstacles are yet to come.
Finally, while we focus on the four challenges of precision medicine, big data integration also opens novel opportunities in bioinformatics and in other data sciences. For example, it can be used to reprocess raw data in more coherent way, or with novel research questions in mind177.
References
1. Hood, L. & Friend, S. H. Predictive, personalized, preventive, participatory (p4) cancer medicine. Nature Reviews Clinical Oncology8, 184–187 (2011).
2. Mirnezami, R., Nicholson, J. & Darzi, A. Preparing for precision medicine. New England Journal of Medicine366, 489–491 (2012).
3. Table of blood group systems v4.0 (2014).
4. Smits, J., De Meester, J., Persijn, G., Claas, F. & Vanrenterghem, Y. Long-term results of solid organ transplantation. report from the eurotransplant international foundation.Clinical transplants109–127 (1995).
5. Takemoto, S., Terasaki, P. I., Cecka, J. M., Cho, Y. W. & Gjertson, D. W. Survival of nationally shared, hla-matched kidney transplants from cadaveric donors.New England Journal of Medicine327, 834–839 (1992).
6. Thorogood, J. et al. The effect of hla matching on kidney graft survival in separate posttransplantation intervals. Transplantation50, 146–149 (1990).
7. Mitsuishi, Y. & Terasaki, P. Hla matching effect on five-year graft survival and half-life in the cyclosporine era.Kidney international. Supplement38, S172–5 (1992).
8. Beyer, M. A. & Laney, D. The importance of ‘big data’: a definition.Stamford, CT: Gartner(2012).
9. Consortium, I. H. G. S.et al. Finishing the euchromatic sequence of the human genome.Nature431, 931–945 (2004).
10. McDermott, J. E.et al. Challenges in biomarker discovery: combining expert insights with statistical analysis of complex omics data.Expert opinion on medical diagnostics7, 37–51 (2013).
11. Kato, H., Takahashi, S. & Saito, K. Omics and integrated omics for the promotion of food and nutrition science.Journal of traditional and complementary medicine1, 25 (2011).
12. Cho, I. & Blaser, M. J. The human microbiome: at the interface of health and disease. Nature Reviews Genetics13, 260–270 (2012).
13. Yuan, Y.et al. Quantitative image analysis of cellular heterogeneity in breast tumors complements genomic profiling. Science translational medicine4, 157ra143–157ra143 (2012).
14. Kumar, V.et al.Radiomics: the process and the challenges. Magnetic resonance imaging30, 1234–1248 (2012).
15. Lambin, P.et al.Radiomics: extracting more information from medical images using advanced feature analysis.European Journal of Cancer48, 441–446 (2012).
16. Ahrens, M. B., Orger, M. B., Robson, D. N., Li, J. M. & Keller, P. J. Whole-brain functional imaging at cellular resolution using light-sheet microscopy.Nature methods10, 413–420 (2013).
17. Mardis, E. R. The 1,000genome,the100,000 analysis.Genome Med2, 84 (2010).
18. Margolis, R.et al.The national institutes of health’s big data to knowledge (bd2k) initiative: capitalizing on biomedical big data. Journal of the American Medical Informatics Association21, 957–958 (2014).
19. L¨otvall, J.et al. Asthma endotypes: a new approach to classification of disease entities within the asthma syndrome. Journal of Allergy and Clinical Immunology127, 355–360 (2011).
20. Boland, M. R., Hripcsak, G., Shen, Y., Chung, W. K. & Weng, C. Defining a comprehensive verotype using electronic health records for personalized medicine. Journal of the American Medical Informatics Association20, e232–e238 (2013).
21. Schulam, P., Wigley, F. & Saria, S. Clustering longitudinal clinical marker trajectories from electronic health data: Applications to phenotyping and endotype discovery. InTwenty-Ninth AAAI Conference on Artificial Intelligence(2015).
22. Verhaak, R. G.et al.Integrated genomic analysis identifies clinically relevant subtypes of glioblastoma characterized by abnormalities in pdgfra, idh1, egfr, and nf1.Cancer cell17, 98–110 (2010).
23. Lewis, S.et al.Heterogeneity of parkinson’s disease in the early clinical stages using a data driven approach.Journal of Neurology, Neurosurgery & Psychiatry76, 343–348 (2005).
24. Gutman, S. & Kessler, L. G. The us food and drug administration perspective on cancer biomarker development.Nature Reviews Cancer6, 565–571 (2006).
25. Davis, J. C.et al. The microeconomics of personalized medicine: today’s challenge and tomorrow’s promise.Nature reviews Drug discovery8, 279–286 (2009).
26. Ashburn, T. T. & Thor, K. B. Drug repositioning: identifying and developing new uses for existing drugs.Nature reviews Drug discovery3, 673–683 (2004).
27. Wheeler, D. A.et al.The complete genome of an individual by massively parallel dna sequencing.nature452, 872–876 (2008).
28. Ng, S. B.et al.Targeted capture and massively parallel sequencing of 12 human exomes. Nature461, 272–276 (2009).
29. Choi, M.et al. Genetic diagnosis by whole exome capture and massively parallel dna sequencing.Proceedings of the National Academy of Sciences106, 19096–19101 (2009).
30. Owens, B. The single life.Nature491, 27–29 (2012).
31. Shapiro, E., Biezuner, T. & Linnarsson, S. Single-cell sequencing-based technologies will revolutionize whole-organism science.Nature Reviews Genetics14, 618–630 (2013).
32. Lupski, J. R. Genome mosaicism–one human, multiple genomes.Science341, 358–359 (2013).
33. Ziller, M. J.et al.Charting a dynamic dna methylation landscape of the human genome. Nature500, 477–481 (2013).
34. Rivera, C. M. & Ren, B. Mapping human epigenomes.Cell155, 39–55 (2013).
35. Dawson, M. A. & Kouzarides, T. Cancer epigenetics: from mechanism to therapy.Cell150, 12–27 (2012).
36. Suv`a, M. L., Riggi, N. & Bernstein, B. E. Epigenetic reprogramming in cancer.Science339, 1567–1570 (2013).
37. Vishwanathan, N., Le, H., Le, T. & Hu, W.-S. Advancing biopharmaceutical process science through transcriptome analysis.Current opinion in biotechnology30, 113–119 (2014).
38. Marian, A. sequencing your genome: What does it mean? Methodist DeBakey cardiovascular journal10, 3 (2014).
39. Allocco, D. J., Kohane, I. S. & Butte, A. J. Quantifying the relationship between co-expression, co-regulation and gene function.BMC bioinformatics5, 18 (2004).
40. DeRisi, J.et al. Use of a cdna microarray to analyse gene expression patterns in human cancer. Nature genetics14, 457–460 (1996).
41. Volinia, S.et al.A microrna expression signature of human solid tumors defines cancer gene targets.Proceedings of the National academy of Sciences of the United States of America103, 2257–2261 (2006).
42. Van’t Veer, L. J.et al.Gene expression profiling predicts clinical outcome of breast cancer. nature415, 530–536 (2002).
43. Jensen, O. N. Modification-specific proteomics: characterization of post-translational modifications by mass spectrometry. Current opinion in chemical biology8, 33–41 (2004).
44. Ong, S.-E. & Mann, M. Mass spectrometry–based proteomics turns quantitative.Nature chemical biology1, 252–262 (2005).
45. Fields, S. & Song, O. K. A novel genetic system to detect protein-protein interactions.Nature340, 245–246 (1989).
46. Ho, Y., Gruhler, A., Heilbut, A., Bader, G. D.et al. Systematic identification of protein complexes in saccharomyces cerevisiae by mass spectrometry.Nature415, 180–183 (2002).