Bandwidth Management using Load Balancing
Ashok Singh Sairam
Dept. of CSE, IIT Guwahati, Guwahati 781039, India
Email:[email protected]
Gautam Barua
Dept. of CSE, IIT Guwahati Guwahati 781039, India
Email:[email protected]
Abstract— In order to bridge the speed disparity at the LAN-WAN interface, enterprises install a number of policy-based de-vices to enforce administrative policies over the WAN access. The conventional techniques of bandwidth management concentrate only on the outgoing traffic from the local network. Regulating the outgoing traffic is easy given that the user has full control over it. However, controlling the incoming traffic is difficult since the user has no control on the traffic sent by an Internet agent. This paper proposes a simple load balancing approach to optimize the use of WAN links in a multihomed environment. By distributing the user traffic among the various WAN links we try to optimize the utilization of incoming bandwidth on the access links thereby giving an indirect measure to control the incoming traffic. We deploy a prototype implementation of our approach on a campus network with high incoming traffic, to evaluate the performance benefits. Using a large collection of network traces, we find that even with a subnet-level of load balancing there can be significant increase in performance. The proposed load balancing approach can be used as a first step toward controlling the incoming traffic, before other actual bandwidth management techniques are applied.
I. INTRODUCTION
With the advent of fibre optics the bandwidth of LANs have increased immensely. Today 1 Gigabit is the standard for LANs and 10 Gigabit is being standardized. However, WAN bandwidth has not increased at the same pace thus creating a bottleneck at the LAN-WAN interface. This speed disparity at the LAN-WAN interface has prompted many an enterprise to install policy based devices to enforce administrative policies over the WAN access.
From an enterprise’s viewpoint the benefits of bandwidth management can be evaluated from two distinct perspectives - high volume content providers like data centres which transmit large volume of data to many distributed clients and enterprises which primarily receive data from the network. The general bandwidth management techniques like traffic shaping, traffic policing etc chiefly control the outgoing traffic and hence are suited for the first type of enterprises, high content providers. A survey of bandwidth management techniques is given in [23] and [19]. Commercial bandwidth managers are also available from many vendors though not much is known about the techniques and algorithms used. A comparative study of some of the commercial bandwidth managers have been made by webtorials.com in a white paper ([21]).
Our research focus is to manage the bandwidth for those enterprises where the incoming traffic far outweighs the outgoing traffic. Hence we focus our work on the second type of enterprise, high content receivers. There have already been some early attempts to control the flow of incoming traffic. A. Giovanardi et. al. ([12]) propose an architecture based on a network agent which intercepts all packets addressed to a gateway, prioritizes the packets and forwards only those packets that meet the priority requirements. Though this strategy controls only the outgoing IP traffic it also acts on the acknowledgments (outgoing), thereby giving an indirect control to the incoming TCP traffic. Anurag Kumar et. al. ([20]) use ICMP Source Quench messages to reduce the rate of transmission onto the network. However, Source Quench messages are ignored by many IP implementations. The other ways of controlling the incoming traffic is to manipulate the TCP protocol to control the behavior of a TCP sender ([16], [22], [17]).
Bandwidth management techniques cannot create additional bandwidth; they give preferential treatment to some packets while restricting other packets. In a multihomed site all the external links may not be fully utilized at any given instant. While one link is congested a second link may be lightly loaded. The goal of this paper is to suggest that in such a scenario, the first steps toward bandwidth management would be to use the un-utilized bandwidth on the second link.
The use of load balancing techniques for bandwidth management has been fueled by the fact that most enterprises in recent days have more then one external link either to a single ISP or to different providers (multi-homed) to provide better resilience. Though multihoming has been traditionally used for fault-tolerance and high availability, the advent of cheap but not very reliable ADSL links have led to the growth of a number of devices which can leverage multihoming for performance benefits ([8], [14], [7], [13]).
However, during high traffic condition, all the external links will be saturated and multihoming techniques will prove ineffective. Thus this paper aims to stimulate further research work in the development of more positive measures to control the flow of incoming traffic.
surveys the different multihoming load balancing techniques available. Section III presents the design of our multihoming load balancing approach. Section IV details the implemen-tation issues of our approach and reports the result of a performance study based on a prototype implementation using real time traffic. Section V discusses the practical aspects for deployment of our scheme, etc. Section VI concludes with a summary of the contribution of this paper and an outline of future work.
II. RELATEDWORK
Given a site x an ideal multihoming load balancing
algorithm will select an access link such that latency to
access the site x is the least through that link. However, in
practice always selecting a link that has the least latency is very difficult if not impossible. The existing load balancing techniques aim to achieve this ideal scenario.
S. Seshan et. al. ([8]) propose a load balancing scheme by monitoring the volume of traffic to destinations (top 100 sites). Based on the monitoring their scheme associates a particular destination with a provider using network address translation. A destination is switched from one provider to another if the latter will provide substantially better performance. However, such a switch will drop active TCP connections due to the change in the source address.
F. Guo et. al. ([14]) analyze the different aspects of load balancing techniques. The assignment of traffic to the WAN links can be done using two approaches - stateless or stateful. In the stateless approach the connection id (Source Address, Source Port, Destination Address and Destination Port) is hashed to get the link id. This approach is straight forward but it does not take into account dynamic traffic load characteristics. A detailed analysis of hashing based schemes is also given in ([10]). In the stateful approach, factors such as latency, availability etc are taken into account but it requires a lookup table to record the dispatch decisions so that all subsequent packets can follow the same link.
Packet-wise assignment of traffic to the WAN links can give the finest granularity of load balancing but it requires that the internal hosts have public addresses which are covered by the BGP routers of ISP ([9]). Connection-by-connection link assignment requires the IP addresses and ports numbers of source and destination. Connection-wise assignment can be set up using NAT but in practice it may not work because certain applications require setting up several connections that should have the same end-point IP addresses. Determining all the connections of a session is very difficult if not impossible. Session level assignment requires only the source and destination addresses but the granularity is coarse.
A. Akella et. al. in [7] attempt to quantify the best performance achievable when a site is multihomed to k
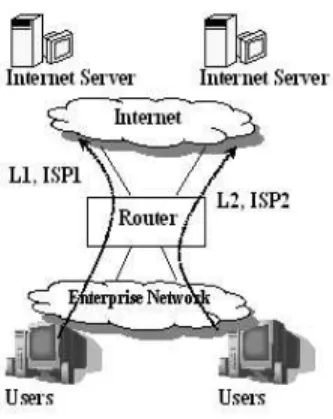
Fig. 1. A typical enterprise network connected to two ISPs. The user traffic is assigned to the two ISPs using static routing.
available providers.
J. M. Klienberg et. al. ([18]) consider the problem of selecting the links so as to provide a bandwidth allocation that is as fair as possible in the max-min sense.
There are different models an ISP may use to charge the users for using its service - percentile-based charging, total-volume based charging or a flat rate. D. K. Goldenberg et. al. in [13] propose a number of algorithms to optimize the cost and performance for a multihomed site.
There are also a large number of commercial load balancing tools available but very little is known of their design and performance ([3], [5], [1], [6], [4]).
For Internet initiated connections, DNS cycling technology ([8]) is widely used to direct the connection to the least loaded. However, the study of such technology is beyond the scope of our present work.
III. DESIGNSPACE
A. Problem Statement
An enterprise network usually connects to one or more ISPs through a router, (see Figure 1). The bandwidth manager is installed just before this router (LAN side), thus acting as a router for the internal users. Each internal host simply sets its default gateway to the IP address of the bandwidth manager. In the remaining part of the paper the use of the term router means this bandwidth manager.
Given an enterprise with K number of ISPs (we use K as an index), the research issue addressed by this paper are:
Control incoming traffic by distributing user traffic among the K ISPs such that the Incoming Bandwidth (IBW) is
fully utilized.
means Incoming Bandwidth of the
link provided by .
Improve average latency.
Provide different Quality of Service depending on the priority of users.
B. Assumptions
TCP un-aware packets need to be dealt using a separate TCP un-aware bandwidth manager. LAN bandwidth is so large that latency and loss rate in a LAN are negligible compared to those in WANs. The main congestion is in the Incoming bandwidth and there is always sufficient Outgoing bandwidth available. Encryption/decryption of packets are performed after/before bandwidth management respectively, so that the bandwidth manager can differentiate traffic from different users. The ISP charging model is based on a flat rate and does not depend on usage.
C. Monitoring the Connecting Link
The first step toward load balancing is to monitor the access links, but what parameters do we monitor? In bandwidth management a metric of great significance is available bandwidth. The performance of an access link also depends on several other Quality Of Service (QoS) parameters like delay, jitter etc. However, to select a network path that optimizes more then one QoS parameter is known to be a NP-complete problem. Bandwidth being one of the most prominent QoS parameters, we monitor the (incoming) available bandwidth of the access links.
There are a number of open tools available for measuring Available Bandwidth ([15]). All these tools measure the end-to-end available bandwidth. In an end-end-to-end measurement the congestion link in the path may be outside the user’s and provider’s domain or it may be because of a slow Internet server. The end user does not have any control in either of the case. We do not want to limit our resource usage due to such constraints, so we monitor the available bandwidth only on the path between the local network and the provider. This is the path that the end user has subscribed to and has full
control over it, and we call such a path the connecting path
or connecting link.
Connecting Link is a network path (L) between a provider (P) and a customer (C) such that any external traffic, originating from the customer will use this path L. That is, all outgoing traffic from the local network using the services of the provider P will follow this path. Conversely, all incoming traffic to the local network directed through the provider P will follow this path. Apparently it may seem that the connecting link is the network path between the egress router of the provider to the egress router of the customer. However, the provider (and the customer) can have more then one egress router. Moreover the route followed by the traffic will depend on the destination address and the current load scenario.
The connecting link, , for incoming traffic can be defined as: where
is the path from j, any source not in the local network, to the router R, the edge router of the local network.
Most of the tools used in the measurement of available bandwidth usually requires cooperation at both the ends ([11], [15]). This means, in order to monitor the available
bandwidth of the connecting link we require access both at
the provider’s end as well as on the router. However, the user does not have any control at the provider’s end. Hence, we require a tool which can measure the bandwidth at the router without cooperation from the other end. The number
of hops in theconnecting link will be relatively less and can
be easily determined. To get more accurate results we look for a tool which incorporate the number of hops between the two end-points , while computing the available bandwidth. Our studies have shown that an open available bandwidth measuring tool, Pathrate ([11]), can be tailored to measure
the
of theconnecting link.
There are two approaches of monitoring a WAN link, active monitoring and passive monitoring. Passive monitoring rely on past observations to estimate the performance of a link. In active monitoring probe packets are send to measure the performance of a link. Active monitoring usually give more accurate results, but the probe packets can hog the limited resource during periods of congestion. The use of Pathrate will require that we send probe packets for measuring the available bandwidth. However, unlike the general approach, probe packets will be sent only up to the provider and not up
to the remote destination, since we monitor the connecting
link only. Hence the effect of the probe packets will be
relatively much less.
A practical but less accurate approach to measure the
bandwidth of the connecting link is to SNMP probe the
edge router, get the ”In Octets” and ”Out Octets” and then calculate the bandwidth usage.
Another issue in monitoring is the interval between succes-sive probes. If the interval is large it may lead to the use of stale information to estimate the provider performance. Small intervals on the other hand will cause additional bandwidth and processing overhead in the case of active monitoring. Our heuristics show that a probing interval of less then 5 minutes do not give useful results for a mid-sized enterprise.
D. User and User Class
The second step is to assign the network traffic to a provider based on the monitored results. A fine granularity of assignment will lead to better load balancing and performance, but with more overheads. The main concern of our approach,
link.
The basic granularity of assignment in our load balancing approach is a user (IP address). Initially the users are assigned access links as per the policy of the organization. Based on
the monitoring of the connecting link, if the utilization of
an access link exceeds a predefined threshold, then a user is moved from the congested link to another link which is below its threshold. Users are moved one at a time from the congested link, for each time we probe the connecting link. The process of moving the users continue until the utilization of the link goes below threshold, or there are no other links with utilization below threshold available. The users are again moved back to their default link when the available bandwidth of the link goes above the threshold. The threshold value of a link indicate its incoming bandwidth utilization.
In our routing scheme we broadly try to ensure to users, that the utilization of its default assigned link will not be congested. Hence, in the case of the link getting congested (i.e. utilization exceeds upper threshold), we select the user with the lowest priority as the candidate for being moved from the link so as to bring its utilization below threshold.
Users with similar priority are grouped into User Classes. This grouping makes the management of users and routing tables easier. However, selecting the maximum size of a user class is not easy. If the size is very small it will lead to a finer granularity of load balancing. On the downside, the size being small the traffic generated is likely to be less. Thus during congestion we may need to move several users, to bring down the link utilization below threshold. In other words our algorithm is likely to take more time to converge. The number of entries in the routing table is also likely to become large and unmanageable for a network with a huge user population.
On the other hand if the user class size is big, it will lead to a small, efficient routing table but it may cause users to ping-pong between two links. For instance consider an organization with two external links - L1 and L2. Suppose L1 is congested and we need to move a user class (U1) from L1 to link L2, which is not congested. However, if the number of users in U1 is very large it is likely to generate more traffic, thus causing congestion in L2 while L1 will go below its threshold. This will prompt the router to move back a user from L2 to L1 again. The other problem with a large user class size is that it may lower the performance benefits due to the very coarse granularity.
In order to address this issue ofping-pong, two thresholds
are defined for each link - a upper threshold and a lower threshold. When a link exceeds its upper threshold then it signals congestion on that link and if it is below its lower threshold then it means there is bandwidth available on the link and a user can be accommodated. If the utilization of the
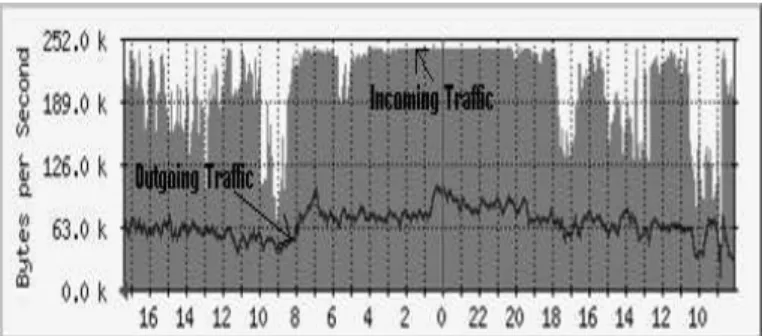
Fig. 2. Incoming Traffic Vs. Outgoing Traffic
link is between the upper and lower threshold, then it means that the link is in a steady state and so no user will be moved from the link but it will not accommodate any new users either. The upper and lower threshold for a link are so defined such that if a link is below its lower threshold and a user is moved to the link, its utilization should not exceed the upper threshold.
E. Dispatching traffic through selected providers
The network traffic can be initiated in two ways - internally by an user or by an external client. Both the types of connection need to be handled differently. A connection initiated by an user will usually result in a higher volume of Incoming traffic vis-a-vis Outgoing traffic. Figure 2 shows a MRTG (Multi Router Traffic Grapher) ([2]) graph of a campus network, where most of the connections are initiated from within the local network. The only service hosted by the campus network is its web page and the number of hits is relatively much less. As can be seen from the graph, the Incoming traffic is more then double of the Outgoing traffic.
The main focus of our work being to control the Incoming traffic, we focus only on the connections initiated by internal users. A simple source-based routing policy is used in the router to direct the traffic from a user to one of the providers (see Figure 3). Such a routing control scheme allow users to be moved from one ISP to the other with minimal changes in the routing table of the router.
In order to preserve the limited IP addresses provided by an ISP, the internal users are assigned private IP addresses. Network address translation (NAT) is used to translate a private IP address to the appropriate ISP address.
F. Handling active connections
A prominent downside of switching a user between ISPs is that all the active connections of the user will fail due to the change in the source address. Most of the work on load balancing ignore such active connections with the assumption that Internet connections are short-lived. While it is true that most of the Internet flows are short-lived, majority of the packets and bytes belong to long-lived flows, and this property persists across several levels of aggregation. Thus ignoring the active connections may adversely effect the
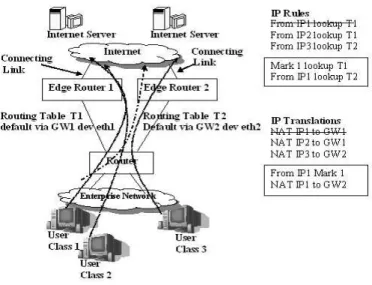
Fig. 3. Multihoming Implementation on a Linux machine. The IP address of the three user class are IP1, IP2 and IP3. GW1 and GW2 are the IP address of the two edge routers.
average throughput.
In order to preserve the active connections of a user, we allow the established connections of the user to continue undisturbed on the present link while all new connections initiated by the user are routed through the second ISP link. This is done by identifying all active connections of the user and marking them. The marked packets are then routed through the first link while unmarked packets are routed through the second link.
However, some of the new (unmarked) connections of the user directed over the second link may be part of a previous active session continuing on the first link. This could cause the session continuing on the first link to fail. Identifying all the connections of a session is very difficult, if not impossible. We propose to use a protocol specific approach to handle active sessions. For example in the HTTP protocol we can use session identifiers stored in cookies to identify all the connections that belong to a session. This, however, will require that we probe packets at the application layer.
IV. PERFORMANCEEVALUATION
A. Experiment Setup
A prototype implementation of our Multihoming approach is deployed on a real-time network. The actual routing functions are implemented on a Linux machine (router) using source policy routing.
Figure 3 illustrates the implementation of our scheme with three user classes and two providers. There is a routing table, T1 and T2 for each of the access links. The default assignment of the users are - User Class 1 and 2 on ISP1 and User Class 3 on ISP2. The IP rules and network address
translations required for this default setup are shown in the figure. In order to move user class 1 from ISP1 to ISP2 we first track its active connections, mark these packets, then we add the new rules and translations (shown encircled in a box) for user class 1 and delete its previous rules.
The manipulation of the routing table of the router,
moni-toring of the connecting link and the algorithm to select the
access link for a user are implemented using a Perl program. We use SNMP probes to compute the link utilization of the connecting links.
B. Comparison Metric
In order to evaluate our approach we use the response time of connections from the enterprise to Internet servers as the yard stick. Let the latency to access a site x through link y
be
. Then the ideal latency ! !"$#&%
to access the site x
can be defined as ')(+*
,
where -.- is the total number of
access links. If
/0%2143
is the latency achieved by applying the proposed multihoming approach, then the performance of a multihoming load balancing algorithm can be measured by comparing
/0%2143 with
,! !"$#&% .
The primary aim of our work is to utilize the total bandwidth at our disposal and not load balancing. Hence the comparison metric for load balancing will not fully highlight the benefits of our scheme.
The idea is to assign the users their default link as per the policy of the enterprise, collect the network trace and
extract the response time (say 5,6"87#90,%:1
) from the trace. Next we repeat the experiment with the same setup but with our route control scheme in place and get
5;/<0%2143 . Thus our comparison metric is =?>$@BA "BCD" FEHGI-JK-MLHN ;/<0%2143 G 6"$7;#!0%21 (1).
where -JO- is the total number of transfers.
One of the main problems when working with real-time traffic is the inability to reproduce the traffic conditions at a later stage, to repeat the experiment with a different set of parameters. In order to evaluate our work we need to perform the same experiment twice - once without load balancing and a second time with load balancing. To ensure that the experiments are comparable we collect the traces for a sufficiently long period and try to ascertain that the user activity is more or less the same during both the periods.
C. Experimental Results
The prototype implementation is deployed on a campus network connected to two upstream providers, ISP1 and ISP2. Link L1 of ISP1 is a dedicated 2 Mbps link up to the international gateway of the ISP. Link L2 of ISP2 is also a 2 Mbps link but it is a shared link. Thus L1 is the better of the
TABLE I
PROPERTIES OFNETWORKTRACE COLLECTED FROM FIRST EXPERIMENT
Period Size Complete TCP connections ISPs Used
PQSR8T Feb 496 MB 132320 2 U QSR8V Feb 532 MB 161400 1 0 100 200 300 400 500 600 700 800 900 1000 1100 1200 1300 1400 1500 1600 128 130 132 134 136 138 140 142 144 146 148 150 152 154 156
Average RTT (in msecs)
Users Using 2 ISP Using 1 ISPs 0 100 200 300 400 500 600 700 800 900 1000 1100 1200 1300 1400 1500 1600 128 130 132 134 136 138 140 142 144 146 148 150 152 154 156
Average RTT (in msecs)
Users
Using 2 ISP Using 1 ISPs
Fig. 4. Comparison of Average Latency of a user class using a single ISP and two ISPs. The X-axis show the last Octet of each user IP address.
two.
1) Experiment 1: There are several reports in the literature that show the performance benefits of multihoming relative to using the single best provider. Our first experiment is to show a similar result but with a very coarse-grained level of load balancing, subnet level load balancing.
We created a user class of size 32 (IP address X.X.X.X/27), and assigned the user class to link L1, the best ISP and then collected the network trace for a period of 1 week. Next we added link L2 and subjected the user class to our routing control scheme for another week. The meta properties of both the collected trace are given in Table I.
A comparison of the average latency experienced by each user of the classes for both the cases is given in Figure 4. The overall performance improvement of using 2 ISPs relative to using a single ISP is greater then a factor of 2, similar to results obtained in [7].
2) Experiment 2: In our second experiment we considered the entire user population of the campus network. The network has about 1800 users, divided among various proxy servers for accessing the Internet. In this experiment we considered two proxy servers - Proxy1 and Proxy2 with a user size of 500 and 150 respectively. We choose such a coarse granularity of load balancing to reduce the overheads and keep our prototype implementation simple.
The default routing policy of the organization was to assign Proxy1 to link L1 and Proxy2 was assigned to link L2. The
other proxy servers were assigned links as per the policy of the organization. With the default setting we collected 8-hour traces for both the proxies for a period of 5 days. Subsequently we used our routing approach and collected 8-hour traces for a similar period. The reason for using 8-hour traces is because the users of Proxy2 are office staff with working hours - 8 hours in a day and 5 days in a week. Accordingly, the traces were only collected on working days when the office staff were present. The users of Proxy1 are students hence, they are likely to use the Internet for most part of the day.
The characteristics of the traces collected for our second experiment are given in Table II. The performance comparison of both the proxy servers are given in Figure 5. In spite of all our efforts we cannot guarantee that the traffic condition will be the same during both the periods. Hence to get a more realistic view we compare each
/0%2143
with all values of
,6"$7;#!0%21
. Thus the resulting comparison metric becomes:
= >$@BA "BCD" FEHGI-JK-MLHN ;/<0%2143 G,WX 6"$7;#!0%21$Y (2). The graph in Figure 5 has been plotted using the comparison metric given by equation (2). The round-trip time of each trace collected using ”load balancing” is compared with the round-trip of all the traces collected using ”without load balancing”. Hence, if the vertical lines are below 1 it indicates an improvement in performance. In the case of Proxy1 there is a performance improvement of nearly fifty percent whereas in the case of Proxy2 there is a degradation in the performance. The results indicate the link L2 is under utilized whereas link L1 is congested, thus moving a user class from L1 to L2 is beneficial but moving from L2 to L1 is detrimental. In an ideal case if the size of the user class and the threshold values are correctly defined, then our route control scheme will either show an increase in the performance or the performance will remain unchanged. The performance ”without load balancing” will be the same as with ”load balancing” if all the external links are saturated.
The performance degradation of Proxy2 may be either because of a very conservative estimate of threshold for L2 or because of a large user class size.
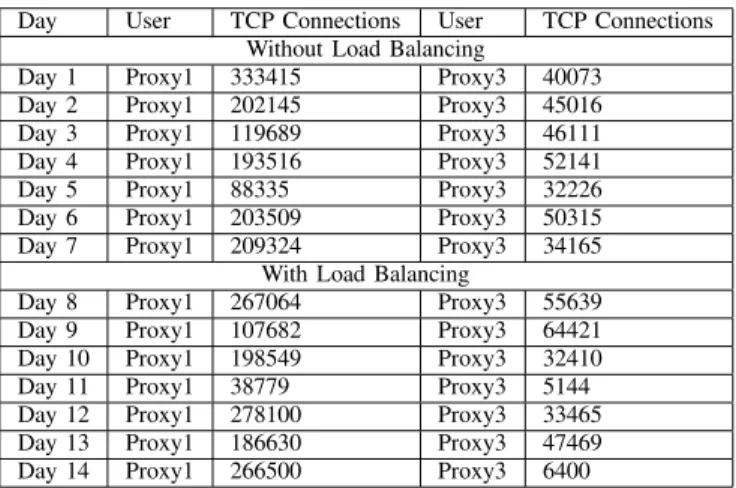
3) Experiment 3: We repeated the second experiment but changed Proxy2 with another proxy server, Proxy3. Proxy3 is a student server with a user size of 200 users. The default assignment of Proxy1 was L1 as before, and that of Proxy3 was L2. The idea behind changing Proxy2 with Proxy3 was to ensure that the user behavior of both the proxies were the same. We also increased the threshold values of link L2 while that of link L1 was kept the same. We collected 12-hour traces for a 7-day period without load balancing and another 7-day period with load balancing. The traces were collected during night-time(4:00 pm - 4:00am), the period
TABLE II
PROPERTIES OFNETWORKTRACE COLLECTED FROM SECOND EXPERIMENT
Day User TCP Connections User TCP Connections
Without Load Balancing
Day 1 Proxy1 56878 Proxy2 23700
Day 2 Proxy1 55413 Proxy2 8486
Day 3 Proxy1 44642 Proxy2 30166
Day 4 Proxy1 48712 Proxy2 13100
Day 5 Proxy1 116383 Proxy2 13795
With Load Balancing
Day 6 Proxy1 40303 Proxy2 32536
Day 7 Proxy1 70075 Proxy2 5459
Day 8 Proxy1 13156 Proxy2 29628
Day 9 Proxy1 127014 Proxy2 30224
Day 10 Proxy1 117280 Proxy2 28366
TABLE III
PROPERTIES OFNETWORKTRACE COLLECTED FROM THIRD EXPERIMENT
Day User TCP Connections User TCP Connections
Without Load Balancing
Day 1 Proxy1 333415 Proxy3 40073
Day 2 Proxy1 202145 Proxy3 45016
Day 3 Proxy1 119689 Proxy3 46111
Day 4 Proxy1 193516 Proxy3 52141
Day 5 Proxy1 88335 Proxy3 32226
Day 6 Proxy1 203509 Proxy3 50315
Day 7 Proxy1 209324 Proxy3 34165
With Load Balancing
Day 8 Proxy1 267064 Proxy3 55639
Day 9 Proxy1 107682 Proxy3 64421
Day 10 Proxy1 198549 Proxy3 32410
Day 11 Proxy1 38779 Proxy3 5144
Day 12 Proxy1 278100 Proxy3 33465
Day 13 Proxy1 186630 Proxy3 47469
Day 14 Proxy1 266500 Proxy3 6400
when Internet usage by students is the highest.
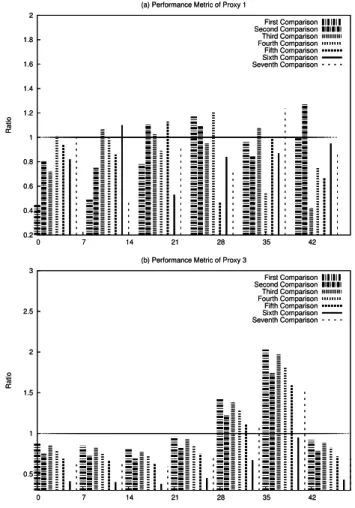
The characteristics of the trace collected are given in Table III. In the table the traces are shown day-wise, however, the traces were not collected on consecutive days. During vacation or exam-time the Internet access of the students are greatly reduced due to obvious reasons. Thus the traces were collected only on such dates when students were present in the campus attending their normal classes. The performance comparison of both the proxy servers is given in Figure 6.
There is an overall performance improvement by more then ten percent for both the proxy servers. With the default assignment of Proxy1 on link L1 and Proxy3 on link L2, it has been observed that the utilization of both the links hovers around our predefined threshold values. The traffic in both the access links are sufficiently high during our period of observation, thus the performance improvement ”with load balancing” is not as significant as in the previous experiment.
D. Defining Thresholds
The most important issue in our work is to correctly define the thresholds. The performance of our algorithm will depend
0 0.2 0.4 0.6 0.8 1 1.2 1.4 0 5 10 15 20 Ratio
(a) Performance Metric of Proxy 1
First Comparison Second Comparison Third Comparison Fourth Comparison Fifth Comparison 0 0.2 0.4 0.6 0.8 1 1.2 1.4 0 5 10 15 20 Ratio
(a) Performance Metric of Proxy 1
First Comparison Second Comparison Third Comparison Fourth Comparison Fifth Comparison 0.6 0.8 1 1.2 1.4 1.6 1.8 2 0 5 10 15 20 Ratio
(b) Performance Metric of Proxy 2
First Comparison Second Comparison Third Comparison Fourth Comparison Fifth Comparison 0.6 0.8 1 1.2 1.4 1.6 1.8 2 0 5 10 15 20 Ratio
(b) Performance Metric of Proxy 2
First Comparison Second Comparison Third Comparison Fourth Comparison Fifth Comparison
Fig. 5. Performance Comparison using two User Class Proxy1 and Proxy2.
on the correct definition of the lower threshold and upper threshold for each link. The threshold of a link can depend on a number of factors - time of the day, type of service agreement with the provider, behavior of the users etc. The threshold values are highly dynamic and can fluctuate wildly, but the change in their values are expected to be gradual. In order to define the thresholds we correlate the link utilization with the communication latency. Figure 7 gives a correlation between the link utilization (incoming) and latency. Each point in the graph denotes the latency observed for the corresponding value of link utilization in a 1-hour period duration. The latency was computed by collecting 1-hour traces for the various proxy servers and aggregating them. In order to get the link utilization we probed an access link six times in a hour and then took its average.
The general observation is that the communication latency increases (degrades) as the link utilization increases. The other observation is that the link utilization cannot go above a certain point. Once this point is reached, as more and more packets are pumped into the network, the link utilization will remain static but latency will increase. In other words the link has reached its saturation value. Thus the resultant
0.2 0.4 0.6 0.8 1 1.2 1.4 1.6 1.8 2 0 7 14 21 28 35 42 Ratio
(a) Performance Metric of Proxy 1
First Comparison Second Comparison Third Comparison Fourth Comparison Fifth Comparison Sixth Comparison Seventh Comparison 0.2 0.4 0.6 0.8 1 1.2 1.4 1.6 1.8 2 0 7 14 21 28 35 42 Ratio
(a) Performance Metric of Proxy 1
First Comparison Second Comparison Third Comparison Fourth Comparison Fifth Comparison Sixth Comparison Seventh Comparison 0.5 1 1.5 2 2.5 3 0 7 14 21 28 35 42 Ratio
(b) Performance Metric of Proxy 3
First Comparison Second Comparison Third Comparison Fourth Comparison Fifth Comparison Sixth Comparison Seventh Comparison 0.5 1 1.5 2 2.5 3 0 7 14 21 28 35 42 Ratio
(b) Performance Metric of Proxy 3
First Comparison Second Comparison Third Comparison Fourth Comparison Fifth Comparison Sixth Comparison Seventh Comparison
Fig. 6. Performance Comparison using two User Class Proxy1 and Proxy3.
identify for each of the links, the point at which this plateau
is reached. The threshold values are so defined such that the link utilization does not hit this plateau.
We study the performance of the two links for a sufficiently long period (months) under different traffic load. Based on the observation we try to define a mean value when thresholds will be reached for both the links. The lower and upper thresholds of link L1 are defined as 90 and 93 respectively. This means that a user class will be moved from link L1 if the (incoming) bandwidth utilization is more then 93 percent. Similarly the lower and upper threshold values of L2 are defined as 8 and 10 respectively. We use the same threshold value for the entire duration of the experiment. The threshold values that we have defined are very conservative estimates. That is probably the reason for the degradation in performance of Proxy2 in our second experiment.
For a dedicated link (raw bandwidth like L1), the plateau
is usually observed around a single point. However, in the case of a shared link like L2, the plateau may be formed at different points. This is because the link is a shared one and the actual bandwidth available at a given instant will depend on the usage of other users outside our network.
0 10 20 30 40 50 60 70 80 90 100 600 800 1000 1200 1400 1600 1800 2000
Utilization (in percent)
Latency (in milli-secs) (a) Latency Vs. Utilization of link L1
0 10 20 30 40 50 60 70 80 90 100 600 800 1000 1200 1400 1600 1800 2000
Utilization (in percent)
Latency (in milli-secs) (a) Latency Vs. Utilization of link L1
0 5 10 15 20 25 200 400 600 800 1000 1200 1400 1600 1800
Utilization (in percent)
Latency (in msecs) (b) Latency Vs Utilization for link L2
0 5 10 15 20 25 200 400 600 800 1000 1200 1400 1600 1800
Utilization (in percent)
Latency (in msecs) (b) Latency Vs Utilization for link L2
Fig. 7. Comparison of Communication Latency versus Utilization for links L1 and L2.
In our third experiment we increased the lower and upper threshold value of L2 to 13 and 15 but kept the user class same or rather increased it. Figure 7 shows that for link L2
the firstplateauis observed in the range between 8 to 10. In
spite of this observation we took a higher value of threshold in our experiment and we got an increase in the performance. Correctly predicting the threshold values for different periods of the day based on past observation can be very difficult. In this work we defined the threshold of the two links on the basis of our observations of the performance of the links for a sufficiently long period. We then further fine-tune the values based on the result of our experiments. Another way of defining the thresholds would be to use a weighted moving average with more weight-age given to current observations. However, studies have shown ([8]) that estimation based on historical samples (eg. EWMA), to measure the performance of an ISP do not give accurate results.
In order to make a general statement regarding the threshold of a WAN link we need to have case studies of a wide range
of such links.
V. DISCUSSION
A. Practical Consideration
ISPs usually use an OSPF cloud to connect its various nodes. Let us consider the implementation of our scheme in such an environment where the local network is considered a part of the cloud (leaf node). The internal users will be directly able to connect to the Internet without directing their traffic through our router. A user needs to contact the router only when a new connection is to be initiated, in order to select one of the access links. If each user is alloted multiple IP addresses, one for each ISP, then such an arrangement will allow active connections to continue unaffected by the load balancing. However, it may fail active sessions since all the connections that belong to a session cannot be identified.
The obvious drawback of this approach is that it will require a large number of public IP addresses. If the user population is large the scheme is not feasible, considering the fact that ISPs usually allot a limited number of IP addresses to its users. To overcome this drawback we may allow only the proxy servers and some privileged users to directly connect to the Internet. Other users will connect to the Internet using the proxy server. A second and a major drawback of this approach is that it requires modification at the user end. This can be a major deterrent for actual deployment of the scheme. In order to avoid making any changes to the end user, we direct all the user traffic to the router. The logic to select the correct access link is implemented on the router. The only change required at the user end is to set the default gateway, to the IP address of the router. In case the end users are assigned multiple public IP addresses, one for each ISP, then NAT is not required. Outgoing traffic will be directed to the router and then the router will route it through one of the ISPs. The incoming traffic will follow the path from the destination, to the edge router of the local network and then directly to the user without going through our router.
NAT is usually used for most practical purposes in order to preserve the limited IP address supplied by the ISPs. Our routing scheme has been implemented using NAT and we show that even with using NAT we are able to preserve the active connections.
Given that we have evaluated the performance benefits of our approach on a real network, we have taken into consid-eration the practical implications that will be encountered for actual deployment of our routing scheme.
B. Bandwidth Guarantee
In this work we do not provide any QoS guarantees to the users. The only guarantee we try to provide is that, the congestion of the default link of each user, will be below our defined thresholds. We select the user with the lowest priority
as the candidate for being moved during congestion. This will ensure that the higher priority users, which remain on the default link, do not face congestion.
An alternate way of looking at it would be to select the user with the highest priority as the candidate for being moved. This will ensure that the highest priority user is moved from a congested link to another link which is not congested. However, the second link may be an inferior link, in terms of QoS parameters, hence we will not be able to ensure the same QoS to the user. This can be handled by storing the QoS parameters of each link on a look-up table. We will move the highest priority user if the QoS parameters of the second link is comparable to that of the first link, otherwise we move the lowest priority user. This, however, will require that we consult the lookup table every time we need to move a user.
C. Scalability
The load balancing approach discussed in this paper is for a multihomed site where the access links are directly connected to the local network. However, large enterprises and ISPs have offices at various locations and some or each of this office may have a WAN link. Such enterprise network are usually covered with an OSPF cloud. Thus load balancing in a domain where the WAN links are geographically at different places needs a different approach.
The problem here is the same as in the multihoming case. Our effort is to route the packets of the users independently among the different external links of the domain. The other issue is to move the traffic of a user from one external link to another in order to balance the traffic among the external links.
VI. CONCLUSION
The goal of this paper is to fully utilize the incoming bandwidth of all the access links in a multihomed environment.
In this work we experimented with a subnet-level or
proxy-based load balancing technique to distribute the user traffic among the various WAN links. The evaluation was done by deploying a prototype implementation of our route control scheme on an actual network. Our evaluation reveal that there can be a significant performance benefit even with such coarse granularity of load balancing.
The switching of user traffic between the providers is based on the utilization level of the WAN link. The utilization is computed by SNMP probing the edge routers. Such a method of calculating the link utilization is straight forward but the results are approximate.
As for further work we plan to experiment with smaller user class and more accurate methods of calculating the link utilization. The use of smaller user class, however, will mean more number of classes. Thus it will result in larger routing table and more overheads on the routing algorithm.
Moreover, the routing control scheme is likely is likely to take more time to converge. In order to accurately calculate
the utilization level of the connecting link we will need to
use a tool like pathrate. This means that we will need to
send probe packets on theconnecting link. We need to study
whether these approaches make a significant difference in the overall performance, considering the overheads involved.
The second contribution of this paper is that our routing
control scheme mark the active connections of a user when
the user is switched from one provider to other. The marked
connections are allowed to continue uninterrupted, thus the active connections of a user does not fail when the user is switched from one access link to the other. In order to handle the active sessions of a user we propose a protocol specific approach.
The performance benefits of our scheme depends largely on the correct definition of the link utilization threshold of the WAN links. In this paper we have shown that based on past measurements we can reasonably predict the threshold value of a dedicated link. However, to give a general definition of the threshold value of a link we need to have more case studies.
The other observation made in this paper is that as the links reach their saturation value the performance benefits decrease since there is no scope for load balancing. This paper suggests that a more pro-active approach must be adopted to control the incoming traffic in such a situation and attempts to stimulate further research in this direction.
REFERENCES
[1] FatPipe. "http://www.fatpipeinc.com".
[2] MRTG: The Multi Router Traffic Grapher. "http://people.ee. ethz.ch/˜oetiker/webtools/mrtg/".
[3] Nortel Networks. "http://www.nortelnetworks.com". [4] Radware. "http://www.radware.com".
[5] Rether Networks Inc. "http://www.rether.com". [6] RouteScience. "http://www.routescience.com".
[7] A. Akella, B. Maggs, S. Seshan, A. Shaikh, and R. Sitaraman. A
Measurement-Based Analysis of Multihoming. In SIGCOMM ’03:
Proceedings of the 2003 Conference on Applications, Technologies, Architectures, and Protocols for Computer Communications, pages 353– 364, New York, NY, USA, 2003. ACM Press.
[8] Aditya Akella, Srinivasan Seshan, and Anees Shaikh. Multihoming Per-formance Benefits: An Experimental Evaluation of Practical Enterprise Strategies. USENIX Annual Technical Conference, 2004.
[9] T. Bates and Y. Rekhter. Scalable Support for Homed Multi-Provider Connectivity. RFC 2260.
[10] Zhiruo Cao, Zheng Wang, and Ellen Zegura. Performance of Hashing-Based Schemes for Internet Load Balancing. InProc. of IEEE INFO-COM, 2000.
[11] C. Dovrolis, P. Ramanathan, and D. Moore. What do Packet Dispersion Techniques Measure? InINFOCOM 2001, Jan 2001.
[12] A. Giovanardi and G. Mazzini. Analysis and Implementation of A Transparent Priority Mechanism for LAN Internet Access. In IEEE Globecom, Dec 1999.
[13] David K. Goldenberg, Lili Qiuy, Haiyong Xie, Yang Richard Yang, and Yin Zhang. Optimizing Cost and Performance for Multihoming. In
SIGCOMM ’04: Proceedings of the 2004 Conference on Applications, Technologies, Architectures, and Protocols for Computer Communica-tions, pages 79–92, New York, NY, USA, 2004. ACM Press.
[14] F. Guo, J. Chen, W. Li, and T. Cker. Experiences in Building A Multihoming Load Balancing System. InINFOCOM 2004., 2004. [15] Ningning Hu and Peter Steenkiste. Evaluation and Characterization of
Available Bandwidth Probing Techniques. IEEE Journal on Selected Areas in Communications, 21(6), August 2003.
[16] L. Kalampoukas, A. Varma, and K.K. Ramkrishnan. Explicit Window Adaptation: A Method to Enhance TCP performance. In Proc. IEEE INFOCOM ’98, April 1998.
[17] Shrikrishna Karandikar, Shivkumar Kalyanaraman, Prasad Bagal, and Bob Packer. TCP Rate Control. InSIGCOMM Comput. Commun. Rev., volume 30 (1), pages 45–58, 2000.
[18] Jon M. Kleinberg, Yuval Rabani, and Eva Tardos. Fairness in Routing and Load Balancing. InIEEE Symposium on Foundations of Computer Science, pages 568–578, 1999.
[19] J.P. Knight. Review of Bandwidth Management Technologies, Avail-ability, and Relevance to UK Education, December 2003.
[20] Anurag Kumar, Malati Hedge, S.V.R. Anand, B.N.Bindu, Dinesh Thiru-murthy, and Arzad A. Kherani. Non-Intrusive TCP Connection Admis-sion Control for Bandwidth Management of an Internet Access Link. In
IEEE Communication Magazine, May 2000.
[21] Edwin E. Mier, Vincent J. Battistelli, and Alan R. Miner. Bandwidth Managers: Going With The Flow.
[22] N.T.Spring, M. Chesire, M. Berryman, and V. Sahasranaman. Receiver Based Management of Low Bandwidth Access Links. InProc. INFO-COM ’00, April 2000.
[23] H.Y. Wei and Y.D. Lin. A Survey and Measurement-Based Comparison of Bandwidth Management Techniques. IEEE Communications Society, Surveys & Tutorials, October 2003.