DESALINATION BY REVERSE OSMOSIS POWERED WITH PHOTOVOLTAICS
* * *
A prototype for Jordan on the Example of California
Course: LoCal Renewable Energy Summer Research Program Professor: Ali Shakouri
Date: August 20, 2009 Students: Eirini Skouloudi
Elisabeth de Saint-Aubain Ingwersen Mona Hammoudeh
Yazeed Nsairat
Table of Content 1 Abstract ... 3 2 Introduction ... 4 3 Research Questions ... 5 4 Methodology ... 5 5 Technology Overview ... 6
5.1 Renewable Energy Powered Desalination ... 7
5.2 Solar Desalination ... 8
5.3 Multiple-Effect Boiling ... 10
5.4 Electromechanical Desalination Processes ... 11
5.5 PV-RO Desalination System ... 12
6 Pilot Plants in California Case Studies... 14
6.1 Marin Municipal Water District ... 14
6.2 Carlsbad Desalination Project ... 15
6.3 Santa Cruz RO Desalination Pilot Test Project... 15
6.4 Baja, California ... 18
7 Overview of Pilot Plant Implementation... 19
8 Market Analysis California ... 21
8.1 Strengths... 21
8.2 Weaknesses ... 24
8.3 Opportunities ... 27
8.4 Threats ... 29
9 Market Analysis Jordan... 30
9.1 Strengths... 30
9.2 Weaknesses ... 31
9.3 Opportunities ... 32
9.4 Threats ... 33
10 Comparative analysis of the Californian and Jordan Markets ... 33
11 Financing Structure ... 34
11.1 Methods of Financing Energy Projects ... 35
11.2 Funding Options ... 35
11.3 Estimated Project Cost ... 36
12 Conclusion... 36
14 Reference List ... 38
14.1 Journals... 38
14.2 Reports ... 39
14.3 Web Pages ... 40
15 Appendix ... 42
15.1 Jordan’s Yearly Irradiation... 42
15.2 Distribution of Desalination Capacity by Type of Technology ... 42
15.3 Energy Consumption for Various Desalination Technologies... 43
15.4 Distribution of Renewable-Powered Desalination Technologies ... 43
15.5 Recommended Renewable Energy-Desalination Combinations... 43
15.6 Renewable Energy Driven Desalination Processes and Energy Sources... 44
15.7 Schematic diagram of a typical SWRO desalination process ... 44
15.8 California Renewable Energy Policy Drivers ... 45
15.9 Budget for the California Solar Initiative... 45
15.10 Trends in Desalinated Seawater Cost in California ... 45
15.11 Currently Operating and Planned Desalination Facilities in California... 46
15.12 Permits / Approvals Likely for a Coastal Desalination Facility in California ... 46
15.13 Jordan’s 2009 Energy Mix and Sectoral Distribution ... 48
15.14 Division of Investment Cost in Jordan’s Energy Sector from 2007 - 2020 ... 48
15.15 Jordan’s Projected Energy Mix 2007 - 2020... 49
1 Abstract
The aim of this project is to compare California and Jordan in terms of implementing a desalination pilot plant powered by renewable energy. From the technology review the most promising technology to replace the conventional one is the reverse osmosis powered by photovoltaic. This has also been proven from the Californian existing plants that were investigated. California’s institutional context of photovoltaics and desalination is very developed. It is to Jordan to develop its own industry in a sustainable and feasible way by looking at the example of California and by closely investigating the development and implication of the suggested pilot plant.
2 Introduction
On August 2009, 252,810,000 people were living under exceptional drought world wide (UCL Department of Space and Climate Physics 2009). Adding the number of people who live under extreme and severe drought, one can estimate the severeness of a situation that has yet so often been mentioned, but only little improved. This project has chosen to look into a role model of what can be done and to pass the message on to another place that needs a solution even more.
California discovered desalination as an industrial source of water supply during a period of extreme drought in the late 80s. However, as the drought was over, the high cost of desalinated water could no longer be justified. Desalination first started to re-emerge during the late 90s as water demand again increased and technology improvements significantly reduced the cost of desalination. Ever since, desalination in California has seen much legislative support and is today a leader in the development and manufacture of desalination membrane technologies (Department of Water Resources 2003, page 9, 11).
This paper aims at proposing the construction of a pilot desalination plant in Jordan by taking advantage of California’s rich experience in the field. The project is expected to be located in the city of Aqaba as it is the only major Jordanian city having access to the Red Sea. Further, Aqaba is blessed with an abundance of solar energy, which is evident from the total annual irradiance of 1,600 – 2,300 kWh / m² - one of the highest in the world as seen in Appendix 15.1 (Mohsen and Jaber 2001). Specific site selection will be determined based on an optimal balance of solar radiation, proximity to the Gulf of Aqaba, and transmission lines.
Three reasons have let to suggesting the use of renewable energy as the main power source for the desalination process: 1. the international climate discussion to shift away from conventional to sustainable emission free energy. 2. Jordan’s energy dependence by importing 96 % of its energy. 3. the need to avoid nuclear power plants for political reasons.
The suggested pilot plant will hence employ reverse osmosis using photovoltaics.
The ultimate goal of this plant is first to prove the regulatory, environmental, and financial feasibility of the technology; secondly, to provide for big-scale projects to serve the local market in Aqaba with potable water; and finally to incorporate related activities such as an international solar energy research centre with possible international support to enhance the attractiveness of desalination for the whole of Jordan.
3 Research Questions
1. Which combination of solar energy and desalination technologies provide the greatest output at the lowest cost?
2. How do California and Jordan compare as to developing and implementing solar energy and desalination?
4 Methodology
This paper has an interpretative epistemology. That is, the research design has taken an inductive approach as no hypotheses were initially given. 2 analytical research questions have been chosen which will guide the project discussion.
A mostly quantitative but to some extend also qualitative analysis looks at a comparative case study of renewables and desalination development and implementation in California and Jordan. This very part takes an ideographic inductive approach as the empirical data to shape the market analysis were gathered unprejudiced and by taking many factors such as political, economic, socio-cultural, and technological variables into account. The reason to analyze the specific case of setting up a pilot plant in Jordan instead of performing a cross-sectional analysis has been to provide an in-depth and dynamic understanding of the variables explained rather than a context-less deduction.
The research method has taken advantage of various academic databases, especially the Business & Company Resource Center. Further, lectures with Professors from The University of California in Santa Cruz, Merced, and Davis such as several field trips to companies
operating in the field of renewables in California have come in handy for the theoretical part of the project. Quantitative information was mainly derived from reports, for example executive orders and other governmental publications. Finally, a few carefully chosen web pages have delivered supporting data.
5 Technology Overview
Commercial desalination was first explored in the 20th century with the appearance of water shortage in many of regions around the world. Historically, desalination was invented by ancient Greek sailors who applied it in the 4th century BC by evaporating seawater. Aristotle has described in a very scientific way the properties and differences between brackish and seawater as well as the water cycle in nature (Kalogirou 2005).
Nowadays, several techniques can be used for desalination. They can be divided into: a) phase change or thermal processes, and b) membrane or single-phase processes. All processes require a chemical pre-treatment of raw seawater to avoid scaling, foaming, corrosion, biological growth, and fouling. Finally, they also require a chemical post treatment (Kalogirou 2005).
In the thermal process, a thermal source is needed to achieve the distillation. The feedwater is first heated and then evaporated to separate out dissolved minerals. The most common methods of distillation include multistage flash (MSF), multiple-effect boiling (or multi-effect distillation) (MEB), and vapor compression (VC).
The most common membrane processes are the reverse osmosis (RO) and the electrodialysis (ED). Electricity is required either to drive the pump that increases the pressure of saline solution to that required (RO) or for the ionization of water which is cleaned by two charged electrodes (ED) with the use of proper membranes. Both of them, RO and ED are used for brackish water desalination, but only RO competes with distillation processes in seawater desalination (Kalogirou 2005).
The dominant desalination processes worldwide are MSF and RO. MSF has a capacity of 44 % and RO of 42 %, divided into 32 % of units in the United States, followed by 21 % in Saudi Arabia, 8 % in Japan, and 8.9 % in Europe. Some 23 % of RO units are manufactured in United States, 18.3 % in Japan, and 12.3 % in Europe (Al-Karaghouli et al. 2009).
From the figure in Appendix 15.2 can be seen that the MSF process represents more than 93 % of the thermal process production, while the RO process represents more than 88 % of the
membrane process production (Garcia-Rodriguez 2003). Spang (2006) presents a table comparing RO technology to MSF and multiple-effect boiling (MEB) technologies. According to this source, RO technology has a comparative advantage to the other methods relating to total energy requirements, low capital costs, and high potential for further improvement.
5.1 Renewable Energy Powered Desalination
The desalination process uses a high amount of energy Appendix 15.3). It has been estimated by Kalogirou (2005) that the production of 1,000 m3 per day of freshwater requires 27.4 tons of oil per (a total of 10,000 tons per year). Hence, using RE desalination, two separate and different technologies are involved: energy conversion and desalination systems.
Over the past decades, great effort has been made in implementing renewable energy sources to desalination techniques and various desalination systems utilizing renewable energy have been constructed. As evidenced by the figure in Appendix 15.4, photovoltaic-powered RO systems make up approximately 32 % and wind-powered RO systems make up approximately 19 % of total RES desalination facilities (Spang 2006). Almost all of these systems have been built as research or demonstration projects and were consequently of a small capacity. Accordingly, they represent 0.02 % of the total desalination capacity. The reasons are high investment costs and large land requirements for renewable energy facilities compared to using conventional fossil fuels (Mathioulakis et al. 2007).
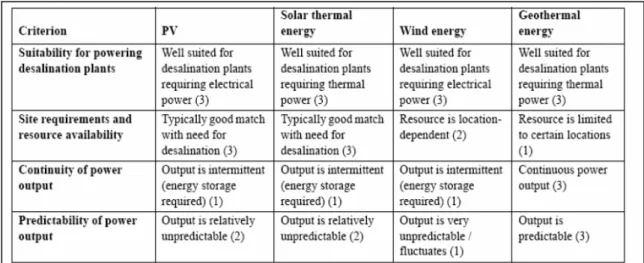
There are several combinations of RES-desalination systems but which of them is the most suitable one is case-by-case dependent. The optimum technology combination must be studied in connection to various local parameters such as geographical / topographical conditions, capacity and type of energy available on site, plant size, feed water salinity, and availability of local infrastructure. Table 1 below summarizes the relationship between various energy inputs and criteria for desalination technologies.
Table 1. Evaluation of renewable energy technologies (Spang 2006)
Further, the table in Appendix 15.5 presents the most suitable RES-desalination techniques in terms of feed water type, RE source type, and system size. A general rule is to combine thermal energy technologies (solar thermal and geothermal energy) with thermal desalination processes and electromechanical energy technologies with desalination processes requiring mechanical or electrical power. The most commonly options of desalinating with renewable energy are: PV or wind-powered RO, electrodialysis or vapor compression, and solar thermal or geothermal energy distillation processes for which either multi-stage flash (MSF), multiple-effect boiling (MEB), or vapor compression (VC) are used (Spang 2006). Jordan belongs to a region where average insolation intensity is 5 - 7 kWh/m2 per day - one of the highest in the world (Mohsen and Jaber 2001). Hence, this project only investigates solar energy technologies and not wind or geothermal energy technologies.
This project asks for low-to-medium scale RE-powered desalination technology applications. From the literature review above it seems that the two promising coupling options with the highest potential are 1. the multiple-effect boiling process driven by advanced low temperature solar thermal collectors such as evacuated tubular collector (ST/MEB) and 2. the reverse osmosis process powered by photovoltaic modules (PV/RO) (Fiorenza et al. 2003). However, it is to be remembered that there are many criterions for which technology is the most appropriate one depending on a specific location.
5.2 Solar Desalination
There are primarily two methods for producing solar power. The first is concentrated solar power (CSP) that collects thermal energy and converts it to power through mechanical power
generators. The second is photovoltaics (PV) and semiconductor materials that convert the sun’s rays directly into electricity.
Concentrated Solar Power
Thermal solar energy is suitable for arid and sunny regions. A thermal solar distillation system consists of two main parts: the collective devise and the distiller. Solar thermal desalination processes are characterized as “direct processes” when all parts are integrated into one system, while the case of “indirect processes” refers to heat coming from a separate solar collecting device, usually solar collectors or solar ponds. Direct systems use solar energy to produce distillated water directly in the solar collector. In indirect collection systems, two sub-systems are employed, one for solar energy collection and the other one for desalination. The direct solar energy method uses a variety of simple stills which are appropriate for very small water demands. Indirect methods use thermal or electrical energy and can be classified as “distillation methods using solar collectors” or “membrane methods using solar collectors and / or photovoltaic for power generation” (Spang 2006).
All of the above mentioned combinations have been tested in various geographical regions. A list of plants worldwide can be found in the journal by Garcia-Rodriguez (2003): Renewable Energy Applications in Desalination: State of the Art. Multi stage flushing (MSF), an indirect solar thermal system, is the most widely used desalination process in terms of capacity (Appendix 15.6). This is due to the simplicity of the process, performance characteristics, and the scale control (Kalogirou 1997). A disadvantage of MSF is that precise pressure levels are required in the different stages and therefore some transient time is required to establish the normal running operation of the plant. This feature makes the MSF relatively unsuitable for solar energy applications unless a storage tank is used for thermal buffering.
A crucial factor which will adjust the most promising technique is each technology’s total energy consumption per product produced. This is important especially when combine desalination with renewable energy, since the total investment cost will rise dramatically depending the total energy needed. According to Kalogirou (2005), the most promising desalination techniques are the multiple-effect boiling (MEB) and for membrane techniques the reverse osmosis. According to Table 2, which shows the energy consumption of desalination systems, MEB requires 149.4 kJ / kg of the product and RO requires 120 kJ / kg
of the product. Compared to the other techniques mentioned in the table, these two have a smaller energy demand.
Table 2. Energy Consumption of Desalination Systems (Kalogirou 2005)
In the following parts 5.3 and 5.4 will focus on these two technologies. 5.3 Multiple-Effect Boiling
Like all phase-change processes driven by solar thermal energy, the operation principle of the MEB process involves reusing the latent heat of evaporation to preheat the feed while at the same time steam is condensed to produce fresh water. The MEB process is composed of a number of elements, called effects. The steam from one effect is used as heating fluid in another effect, which while condensing, causes evaporation of a part of the salty solution. The produced steam goes through the following effect, where, while condensing, it causes some of the other solution to evaporate and so on. For this procedure to be possible, the heated effect must be kept at a pressure lower than that of the effect from which the heating steam originates. The solutions condensed by all effects are used to preheat the feed (Kalogirou 2005). An illustration of the MEB process is shown in Figure 1.
Unlike an MSF plant, the MEB process usually operates as a once through system without a large mass of brine re-circulating around the plant. This design reduces both pumping requirements and scaling tendencies (Mohsen and Jaber 2001). The main difference between this and the MSF process is that the steam of each effect just travels to the following effect where it is immediately used for preheating the feed. This process requires more complicated circuit equipment than the for MSF. However, it has the advantage that it is suitable for solar energy utilization because the levels of operating temperature and pressure equilibrium are less critical (Kalogirou 2005).
5.4 Electromechanical Desalination Processes
Reverse osmosis and electrodialysis are the two main PV driven membrane technologies.
The electricity produced from PV systems for desalination applications can be used for electro-mechanical devices such as pumps or in direct-current (DC) devices. As mentioned before, ED is more efficient with brackish water, and RO has a higher efficiency when the feed water salinity is higher than 2,000 parts per million (ppm) (Spang 2006). Further, the RO process is effective for removing total dissolved solid (TDS) concentrations of up to 50,000 ppm, which can be applied for both brackish-water (1,500 – 10,000 ppm) and seawater (33,000 – 45,000 ppm) (Kalogirou 1997). The fact that the salinity of water in the Red Sea near Jordan ranges between 36,000 – 41,000 ppm, is one of the reasons why this report focuses on reverse osmosis. Another reason is shown in Appendix 15.6: The use of PV with reverse osmosis is the most popular combination. From a technical point of view, PV as well as RO are mature and commercially available technologies. Further, the feasibility of commercially available stand alone PV-powered RO systems as a valid option for desalination at remote sites has also been proven (VARI-RO Solar Powered Desalting Study 2000). These have the advantage to be independent from the grid. At the same time though, their main problem is their high cost due to the energy storage system (batteries) and for the time being the availability and the cost of PV cells.
RO is a pressure driven membrane process where a feed stream under pressure flows through a semi-permeable membrane as the applied pressure is higher than the osmotic pressure. At the same time salt is retained. In the end, a low salt concentration permeate stream is obtained and a concentrated brine remains at the feed side. A typical RO system consists of four major subsystems: pretreatment system, high-pressure pump, membrane module, and post-treatment system. 1. Feedwater pretreatment is a critical factor in operating an RO system because
membranes are sensitive to fouling. Pretreatment commonly includes sterilizing feedwater, filtering, and adding chemicals to prevent scaling and bio-fouling.
2. The required pressure depends on the salt concentration of the resource of saline solution. Normally, it is around 70 bar for seawater desalination. A schematic of the seawater RO desalination process can be found in Appendix 15.7. The energy efficiency of seawater RO depends heavily on recovering the energy from the pressurized brine. In large plants, the rejected brine pressure energy is recovered by a turbine (commonly, Peloton-wheel turbines are used), recovering 20 % - 40 % of the consumed energy (Kalogirou 1997).
3. There are two different types of membranes used for RO: spiral-wound (SW) and hollow-fiber (HF). Both can be used for seawater desalination. The decision on which one should be used is based on cost, feedwater quality, and the product water capacity.
4. The post-treatment system consists of sterilization, stabilization, and mineral enrichment of the product water. In general, the selection of proper pretreatment and proper membrane maintenance are critical for the efficiency and life of the system.
5.5 PV-RO Desalination System
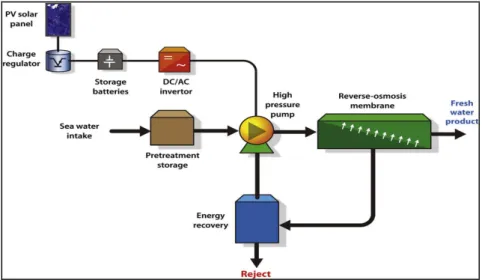
The photovoltaic system converts solar radiation into direct-current (DC) electricity. Apart from the PV panels, the system consists of charge controller, batteries, inverter, and other components in order to provide the electric power output suitable to operate the different systems coupled with the PV system. Energy storage is a concern and batteries are used for PV output power to smooth or sustain system operation when solar radiation is insufficient. Where the use of batteries is too expensive or the system doesn’t operate 24/7, the option of employing a larger water storage tank should be considered.
RO usually uses alternating current (AC) for the pumps, which means that DC/AC inverters must be used. Figure 2 illustrates a schematic diagram of a PV-RO system.
Figure 2. A schematic diagram of a PV-RO system (Kalogirou 1997)
A techno-economic evaluation of solar powered water desalination plants by Fiorenza et. al (2003) analyses production cost of fresh water using both solar driven systems (PV/RO and ST/MEB) and a conventional RO driven system where the power is taken from the grid. The results obtained show that water production cost of a solar desalination plant having a capacity of 5,000 m³ a day is around $2 / m³ by using both ST/MEB and PV/RO. The technology can be used for low-to-medium scale applications, i.e. up to few thousands of m³ a day.
The article also shows that solar systems cannot compete with conventional plants on a competitive economically basis. However, with the expectation of a reduction in the cost of PV panels and a deeper market penetrations of solar technologies in general, the water cost for PV/RO system not connected to the grid is expected to fall to around $1,3 / m3 and will hence be in line with that of a standard systems having access to the electric grid.
For Jordan, both PV/RO and ST/MEB seem to be potential technologies for future RE-desalination plants. The main selection procedure in order to implement a new pre-pilot plant is described by several authors like Kalogirou (2005) and Garcia-Rodriguez (2003). This includes factors as mentioned above, such as: Availability and type of water, type of RES available on site, geographic location / morphology of site, capacity of clean water needed, and storage needs. These factors combined with the Californian examples of renewable powered desalination plants as presented in the following will help us make an estimation of the future suggested pre-pilot plant.
6 Pilot Plants in California Case Studies
The following presents an overview of various desalination test pilot plants within California. The conclusions discussed will be used as a model for the potential desalination test pilot in Aqaba, Jordan.
All examples in California using RO have proved the success of advanced membrane technology used to separate solids and the pre-treatment system of water intake. Results have demonstrated that the California test pilots have met regulatory water quality and environmental standards. The following addresses the reason why a desalination pilot program was initiated, what is learned from each pilot plant, the type of testing conducted to operate, and the type of technology used.
6.1 Marin Municipal Water District
Marin Municipal Water District (MMWD) is assessing to expand its water supply in order to ensure sufficient supply of water during drought years. The objective is to provide a seawater desalination plant to treat Northern San Francisco Bay water. A pilot conducted in 1990 demonstrated that desalination could produce safe drinking water. A yearlong follow-up using newer technologies was then conducted by MMWD.
Energy Requirements for Desalination Decreasing in Marin
The test pilot from MMWD demonstrates the energy required to desalinate water is a gathering of the temperature and salinity of the water. Higher salinity and colder water requires more energy to desalinate than lower salinity warmer water. In the case of the San Francisco Bay, the highest salinity happens in late summer and peaks in droughts when the temperatures are the highest. The lowest is in the winter when the salinity drops due to local rainfall and snowmelt from the Sierra (Marin Municipal Water District n.d.).
Production from the desalination plant would be low in wet and normal years, produce at maximum during droughts and would operate at partial capacity for average weather.The average requirement for this plant is 5 million gallons per day (MGD) and requires 10-kilowatt hours (kWhr) per 1000 gallons to desalinate water from the Bay and deliver it to the customers. In drought season, the plant would operate at full capacity, which is at 10 MGD, requiring 14 (kWhrs) per 1000 gallons.
The proposed Desalination Project includes a 5 MGD to 15 MGD expandable facility, which would increase water supply from 19.3 % to 500 % depending on operation scheme, compared to an 11.4 % deficit identified in the District planning documents. Average energy use annually of MMWD would increase from 43.4 % to 124.3 % and annual use could peak at 295.8% with a 15 MGD facility run at full capacity. Under the MMWD operational scheme, the marginal cost of desalination goes from about $3,600 to $4,400 per acre-foot for a 5 MGD facility and $2,900 to $3,540 per acre-foot for a 10 MGD facility. According to a review of the desalination pilot project, the marginal cost projections of construction a 5 MGD facility is about $104 to $111 million in capital cost and $3.8 million in normal years to operate and $6.5 million to operate in drought years. Scaling up to a 10 MGD facility would have a capital cost of $163 to $173 million and an operating cost of $6.3 million in normal years to operate and $12.4 million operating in drought years (Sustaining Our Water Future: A Review of the Marin Municipal Water District’s Alternatives to improve Water Supply Reliability by James Fryer.”
6.2 Carlsbad Desalination Project
Poseidon is the name of the plant and it consists of a 50 million gallon per day (56,000 acre-feet per year) seawater desalination plant associated water delivery pipelines located at the Encina Power Station in Carlsbad City. The site was chosen to be a suitable location due to its close proximity to the ocean, compatible land use and the availability of existing intake and outfall. The proposed plant is a 4-acre parcel and operates under the Coastal Commission, Regional Water Quality Control Board. It has produced over 20 million gallons of high-quality potable water and about 40,000 gallons of desalinated water per day. When fully operations, it will have the capacity to deliver 50 million gallons per day of RO product water to the water district. The source water is pre-treated and filtered through an RO membrane to produce high-quality drinking water. The byproduct is water with twice the salt concentration and will be diluted with the return flow from the lower plant cooling water system before discharge to the Pacific Ocean. It is operational 24 hours a day and 7 days a week. Poseidon is funding $300 million via capital markets and will contribute equity to the project.
6.3 Santa Cruz RO Desalination Pilot Test Project
Santa Cruz Water Use and Demand: The primary supply is from surface water by rainfall, which is adequate in most years but insufficient in drought years. Future demand for next 30 years will exceed supply available from current sources. CA Dept of Health Services required
the desalination pilot test prior to design of large-scale plant, providing twelve months of pilot testing. It includes source water quality monitoring at source water intake. Monterey Bay Aquarium’s onsite RO unit produces 0.040 MGD for the aquariums non-potable water needs. The key objectives of the pilot is to demonstrate innovative and cost-effective desalination technology, evaluate treatment alternatives, assess process alternatives based on expected life-cycle costs and provide data for regulatory approval for permitting (City of Santa Cruz Water Department-Soquel Creek Water District 2007).
Pilot Facility Description
The Plant is 2,400 square-foot building and incorporates up to 50 gallons per minute flow treatment. The intake seawater is from Long Marine Laboratory’s current seawater intake.
Pilot Testing Results and Findings
It has been thirteen months of testing (March 2008 - April 2009) to assess the most cost efficient and suitable desalination technologies and has demonstrated performance information used to plan for the full-scale seawater desalination plant. It included the following studies according to the Santa Cruz Water Department Pilot Test Program Update of April 2009:
Pretreatment Technology Comparison
Reverse Osmosis Technology Performance Evaluation
Water Quality Testing o Boron Rejection
o CDPH and EPA Water Quality Standards o Algal Toxins (Red-tide Events)
Operation and Equipment Performance Investigations
o New on-line method to test RO Membrane Integrity o Disinfection By-products Formation
o Distribution System Water Quality Corrosion Control
Four pre-treatment processes tested at pilot plant: slow sand filtration, conventional treatment using granular media filters, pressurized ultra filtration (UF) filters and submerged UF filters. Each of which have different implications for life-cycle costs, energy consumption, land requirements, chemical use, and reliability to handle challenging variations in seawater quality. Pre-treatment is necessary to remove organic matter and particulates that can damage the desalination RO equipment.
RO Technology Performance: The RO membranes remove the dissolved solids from water via a pressure driven process. Four membranes were tested for energy requirement, cleaning intervals and verification of salt rejection for each membrane.
Water quality testing: Making sure desalinated drinking water meets health standards set by USEPA and CDPH. Pilot testing for contaminants such as lead and arsenic conducted.
Operation and Equipment Performance: To assess new on-line method to monitor integrity and functionality of RO membrane efficiency, disinfection by-products by adding chlorine to desalinated water. Also investigated post-treatment of desalinated water to enhance taste and limit the corrosion of pipelines.
Results:
Four pretreatment systems performed well in clarifying the seawater and removing suspended solids and met the goals for pretreated water quality.
The RO process showed filtering the desalinated water with a second system improved boron removal and showed a minor reduction in energy usage however it did not remove sufficient levels of boron to reach current standards in California water treatment. However, it does meet seawater treatment from a beach well or brackish water.
Within the last six months of testing, seawater from Santa Cruz showed low levels of suspended solids except during storm events. Increased organic growth and algae were observed in the fall and winter. Source water quality was correlated with increased cleaning intervals for the filtration systems. All in all, quality standards were met. Strategies to enhance boron removal were evaluated. In terms of algal toxins or (red-tide events), RO membranes have shown to reject greater than 99.95% of toxins (Soquel Creek Water District n.d.)
Environmental Impact: Electricity use
Energy usage: pumps need to achieve pressure of 800 to 1100 pounds/sq inch to drive water through a membrane, leaving salt behind (SCWD). Equivalent to fire hydrant pressure of 50 pounds/sq in.
Electricity consumed: 75 gallons/Kw-hour 1.4 MW at peak operation of 2.5million gal/day (CA Desalination Task Force Energy White Paper)
o Plant load at peak operation = 1.4million watts o Output of solar panel: 150 watts
o = 9,333 panels required
“PV Cells operate at 15-20% capacity based on sunlight hours (CA Desalination Task Force Energy White Paper)
o Therefore, plant could produce only 15-20% of intended maximum output if operated on solar power alone.
Land requirements for solar panels: according to Energy Options White Paper, California Desalination Task Force, PV generation including support facilities requires five to ten acres to produce 1 MW of peak power
Cost of Solar Panels:
o $5000/kw – massed power plant $7 million o $900/kw – separate rooftops $12 million
Cost of plant construction: $40million
Cost to transmit and treat water from Loch Lomond: $120/million gallons
Estimated cost for desalination: $1800/million gallons (SC Water Dept. Integrated Water Plan 2003)
6.4 Baja, California
Baja California Sur in Northwest Mexico consist of half a million inhabitants making it the least populated state in Mexico and has the lowest population density (6.9 inhabitants/km2), it has the largest coastline of 2131 km and receives the least rainfall in the country (174 mm a year). Out of 2400 settlements varying in size, 17 are urban with 2500 or more inhabitants (Bermudez-Contreras et al., Desalination 2008). Water scarcity is the biggest problem making freshwater per capita extremely low. According to Contreras et al. “estimates predict that BCS’ freshwater supplies will only cope with increasing demand for u to 5 years in a business-as-usual scenario.”
Most abundant renewable energy source is solar radiation. Annual solar irradiation varies between 5 and 6 kW h/m2/day, with a low of 3 kW h/m2/day in winter and highs of 7 kW h/m2/day in summer (Bermudez-Contreras et al. 2008).
Sandia National Laboratories managed the Mexico Renewable Energy Program, and with collaboration installed 47 solar and solar-hybrid systems with a total of 140 kW of PV modules in Baja California Sur alone.
Desalination in BCS currently uses large solar PV array and battery bank to power seawater RO and can produce up to 19m3/day of freshwater with a total of dissolved solids content of less than 250 ppm (Bermudez-Contreras et al. 2008). The conclusions they have found from Baja California Sur are the same for many of the desalination plants around the world. Advances in membrane technology have improved the process. There are no electricity or water networks within the area, so small communities with brackish or seawater sources have small systems generating electricity and producing freshwater where they are required.
Findings: With advances in membrane technology, RO desalination is economically viable and very competitive however; energy recovery and storage are two issues affecting the performance of the applications used. According to Bermudez-Contreras et al. even though PV systems with energy recovery systems are more efficient, the key problem with small-scale energy devices is that there is no device suitable for land-based applications producing up to 50 m3/day (Bermudez-Contreras et al. 2008).
7 Overview of Pilot Plant Implementation
From the case studies discussed and literature examined thus far, the suggested pilot plant will be a photovoltaic powered reverse osmosis plant for Aqaba, Jordan. The total capacity of the pilot will be 13,200 gallons (50 m3 / day). The amount proposed is taken from California’s test pilots and adjusted for a small-scale pilot. In the case for California, a fifty million gallon per day seawater desalination plant would need about 28 to 35 MW of generating capacity (white paper).
The proposed amount is based on the average water usage requirement within California. Note: 1 cubic meter per day supplies 20-50 people in the developing world (Thomas 1997). The plant facility will be 2,400 square feet.
The proposed test period in Aqaba will be for duration of 12 months for water quality monitoring: 6 months during winter and 6 months during summer.
Drawing from the Santa Cruz Water District’s test pilot, seawater desalination treatment will consist of:
A pretreatment facility
Flocculation and Sedimentation Basins
Two pressure granular media filters to remove remaining particulates
Ultra filtration membrane system as well as submerged ultra filtration membrane system
Two custom designed RO systems: each system can test two different membranes, producing four RO alternatives for the pilot.
Brine Disposal
The brine volume in the Santa Cruz water district for example would be almost equal to production of fresh water. Brine would be twice as salty as ocean source water, which is about 64,000 ppm (Santa Cruz Water District).
In the case for Aqaba Jordan, brine would be blended with effluent from Aqaba municipality. Blending the brine with low-salt effluent reduces salt toxicity releasing it back into the ocean.
In the case for California, improvements in RO technologies have reduced the amount of electricity needed to desalinate water. Newer systems operating at lower pressures require less electricity to produce potable water. California seawater is processed using approximately 13,215-kilowatt hours per million gallons of output (Energy Options White Paper, 2003).
According to the Energy Options White Paper on California Desalination Task Force, it states that renewable generation is possible through the electricity transmission/distribution system, or may be directly connected to a desalination plant. If the renewable power is sent through the grid, the generating equipment may be sited in any of a wide variety of locations, depending on access to properly configured distribution lines. For this discussion, Aqaba is a coastal location for the test pilot. This limits the technologies that are available. The White Paper further states, “A desalination plant may operate directly from the renewable generation, so that it is “off the grid”. In this case, the renewable source should be close to the desalination facility to avoid the cost of a dedicated electricity transmission line to bring the power to the plant.”
Self-standing RE plants at sites near desalination facilities would require significant areas in which to operate. Photovoltaic generation, including support facilities, requires five to ten acres to produce one megawatt of peak power.
8 Market Analysis California
8.1 Strengths Political Factors
Governor of California, Arnold Schwarzenegger, has called his State “a world leader in efforts to reduce global warming and greenhouse gas emissions [and] increase renewable energy production” (2008). Specifically, the energy bill deals with two major energy policies: To increase energy efficiency and further develop renewable energies (Randy Chinn 2009, pers. comm., 05 Aug).
First advances towards renewables were launched with the Renewable Portfolio Standard (RPS) in 2002, which requires California's electricity retail sellers to serve 20 % of their load with renewable energy by 2010. But it was not before 2008 that this aim gained a foothold (Hunt 2009). Hence, the 2010 goal has been postponed by some years (Randy Chinn 2009, pers. comm., 05 Aug) and to some extend been replaced by Executive Order S-14-08: “All retail sellers of electricity shall serve 33 % of their load with renewable energy by 2020. State government agencies are hereby directed to take all appropriate actions to implement this target in all regulatory proceedings, including siting, permitting, and procurement for renewable energy power plants and transmission lines” (Schwarzenegger 2008). For an overview of renewable energy policy drivers in California see Appendix 15.8.
The RPS has taken the form of specific solar energy programs such as PV panels, a number of wind turbine farms, and building large geothermal plants. Hydropower is not considered a renewable energy as there are many environmental problems connected to it. Still, California encourages new high dam projects (Randy Chinn 2009, pers. comm., 05 Aug).
During recent years, desalination has gained major political attention in California. The main legislative body in this context is the California Department of Water Resources (DWR) as it administers the California Water Plan. The goal of this plan is to meet the requirements set about in the California Water Code. Among other things, this Code defines legislative bodies, financing methods, standards and regulations, and development procedures associated with all water issues in California (Department of Water Resources n.d., California Law n.d.).
In 2002, the DWR was directed to convene a Desalination Task Force to “make recommendations related to potential opportunities for the use of seawater and brackish water
desalination […] and what role, if any, the State should play in furthering the use of desalination technology”. The Task Force’s Findings and Recommendations concluded that “economically and environmentally acceptable desalination should be considered as part of a balanced water portfolio to help meet California’s existing and future water supply and environmental needs” (Department of Water Resources 2003, page 9, 10). Subsequently, desalination was added to the Water Code as an alternative to be considered as part of a region’s water supply portfolio (known as Cobey-Porter Saline Water Conversion Law) (California Law n.d., Division 6, Part 6, Chapter 9).
The primer recommendation by the Task Force was that desalination projects must be evaluated individually based on possible environmental impacts, cost, siting, and growth-inducement (Department of Water Resources 2003, page 15). However, many concerns had not yet been addressed. The California Desalination Planning Handbook prepared by the California State University examined those issues by building on the recommendations from the Task Force. It addresses engineers, government, and public officials to make water resource decisions concerning siting, regulations, technical issues, environmental impact, and financing (California State University 2008, page 8). As the Task Force and the following Planning Handbook are important milestones in the development of desalination in California, much of the information in this market analysis is based on them.
Summing up, generating energy from renewable sources, especially from PV panels, and desalination attract major political attention in California. However, no policies could be identified that specifically support efforts to combine renewable energy sources with desalination facilities.
Economic Factors
California receives more investment funding in clean technology than any other State in the U.S. (Schwarzenegger 2008). The Energy Commission provides $70 million a year for supporting research into renewable energies under the Public Interest Energy Research Program (PIER). Further, The California Public Utilities Commission allows for trading Renewable Energy Credits (REC) under the RPS program. The credits represent the environmental and renewable attributes of electricity from renewable sources. With each purchased REC, 1000 lbs of carbon dioxide is offset. It is traded either with the energy or as a separate commodity (Division of Ratepayer Advocates n.d.).
The California Public Utilities Commission also oversees the Go Solar California Campaign, of which the California Solar Initiative (CSI) is a part. The CSI gives solar incentives to facilities in investor-owned utility territories. The total CSI budget is $2.167 billion over the span of the next 10 years, whereof $50 million are dedicated to R&D, deployment, and demonstration. The goal of the Go Solar California campaign is to create 3,000 MW of new solar-produced energy until 2016 (California Public Utilities Commission n.d.). The total CSI budget is outlined in Appendix 15.9.
California employs three different subsidy programs for PV panels:
1. The Californian government subsidizes the cost of PV panels with 15 %. The money comes from a tariff paid by electricity users that don’t use PV panels.
2. Any electricity produced in excess of the one used will let PV owners’ power meter turn backwards (“net meter”). Hence, owners save the full retail price of that extra power.
3. No extra property taxes, that is, a solar panel that increases a property’s value is not taxed.
The cost of desalination has decreased substantially during recent years while the cost of many other water supplies continues to rise (Department of Water Resources 2003, page 10). Appendix 15.10 gives an overview.
Proposition 50, formally known as “Water Security, Clean Drinking Water, Coastal and Beach Protection Act of 2002”, was put down in the Water Code, Division 26.5 Chapter 6 (a), to grant $50 million for desalination research, feasibility studies, pilot projects and construction of new facilities in California (California Law n.d., California State University 2008, page 8).
Further, an important recommendation by the Task Force was that “State funding should give high priority to those desalination projects that provide the greatest public benefits, such as: […] 2) demonstrate long-term environmental benefits; 3) avoid or reduce environmental impacts to the extent possible; […] 5) […] include feasible mitigation for any environmental justice impacts” (Department of Water Resources 2003, page 18). To provide desalination plants with energy from renewable sources hence implies a financial advantage in this regard.
California sees a lot of immigration. Many people come from everywhere and bring new ideas. The Silicon Valley has for many years been a cluster of diverse know-how which is shared and lead to a greater outcome. California has been more liberal to change than other places have. Liberalism goes hand in hand with education and California is a highly educated State. The percentage of collage degrees is much higher than in many other States. Further, California puts efforts in employing its leaders in environmental areas (Kip Wiley 2009, pers. comm., 05 Aug).
Natural increase in California’s population is projected to be 600,000 per year. Further, parts of California see groundwater overdraft problems adding pressure on the water supply. Employing water desalination as part of a balanced water portfolio is thus meeting California’s existing and future water supply needs and is must be extended (Department of Water Resources 2003, page 10).
Technological Factors
California holds 44 % of all U.S. patents in solar technologies (Schwarzenegger 2008). And already in 2002 when the Task Force investigated, California was identified as a leader in the development and manufacture of desalination membrane technologies (Department of Water Resources 2003, page 11). As a result, desalination facilities in California can provide water of equal or higher quality compared to other drinking water sources (Department of Water Resources 2003, page 10).
California’s current peak load energy demand is 52,000 MW. Since projected desalination facilities would require around 200 MW, energy generation capacity does not constrain the implementation of new desalination projects (Department of Water Resources 2003, page 10). This provides an energy provision security as there are still many issues with the reliability of renewable energy sources.
8.2 Weaknesses Political Factors
To this day there are a number of legislatures that don’t believe in climate change, don’t believe that it is manmade, and don’t believe that there is anything government can do about it. They are resistant to programs that are putting an effort in the field. The vote on the biggest climate change bill, 8032, showed that 1/3 was against, a number that has decreased but is still surprisingly high (Randy Chinn 2009, pers. comm., 05 Aug).
On the contrary, some are concerned that the State does not put enough focus on the renewable energies programs as other policy discussions such as the financial crisis, education, or public transportation take the show. According to Chief Consultant to the Senate Committee on Energy, Utilities and Communications, Randy Chinn, there has not been much action by the energy commission and the utilities commission to meet the energy goals. One reason comes from the recent financial turbulent which makes it difficult to set up next year’s budget. During the ongoing financial crisis, California sees the largest drop in revenues among all the States. Over the last two fiscal years, around $65 billion have been cut from the State budget, and as recently as at the end of July 2009, an additional $483 million were cut. Hence, it is still unclear where resources for moving towards the energy goals are going to come from (Kip Wiley 2009, pers. comm., 05 Aug).
Despite legislative efforts to develop desalination, there is still a lack of effective public involvement and a lack of effective, ongoing interaction with permitting agencies in this process. As such, regulatory uncertainty arises from differing requirements among regulatory agencies (California State University 2008, page 24).
Concluding, one can see many good political intentions for developing renewables and desalination in California. The State now has to resolve its economic and bureaucratic weaknesses to be able to efficiently move about.
Economic Factors
Renewables imply a significant cost to the government. It is estimated that reaching the year 2020 goal will imply a cost of around $1 billion a year above the cost of not having the goal. However, the extra cost is assumed to outweigh the natural gas benefit and the fuel diversification benefit. Further, one also has to take into account that the cost of renewable energy itself will decrease over the years to come (Randy Chinn 2009, pers. comm., 05 Aug).
There is a big growth in solar panel investments, but the percentage of already installed panels in California is less than 1%. One reason is that solar panels have a payback time of 10 – 12 years (Randy Chinn 2009, pers. comm., 05 Aug) and in a financially uncertain environment businesses don’t risk such high capital cost.
Energy is a major cost component of desalination. The availability of low-cost power is a critical factor of the economic feasibility of desalination projects. The average total energy rate that PG&E provides to customers with a maximum demand of 1,000 kW or more is $0.100488 / kWh (PG&E 2009). Further, current desalination systems using reverse osmosis require 30 % more energy than interbasin supply systems delivering to South California. As a result, the Bureau of Reclamation, U.S Desalination Coalition, and the National Water Research Institute have joined efforts to improve energy efficiency through better membrane, dual pass processes, and additional energy recovery systems technologies (Department of Water Resources 2003, page 10 - 12).
To provide energy at a large scale and at a low cost is a challenge when the objective is to provide power through renewable sources as renewables such as solar power have not reached the bottom of the cost curve yet. The most costly way that one can generate renewable energy is around 5 – 6 the cost that it cost to generate electricity from a conventional gas power plant. Germany and Spain are very developed in renewable energy sources as the countries have a remarkable feed-in-tariff of around 40 % (Randy Chinn 2009, pers. comm., 05 Aug). This proves that California in order to move down the learning curve should further subsidy renewables initiatives and r&d in the field.
Socio-Cultural Factors
With a projected increase in California’s population of 600,000 per year the State is facing major supply challenges. Major concerns have now appeared that the development of desalination plants will not meet existing supply needs, but instead increase demand by facilitating population growth as another source of water is added (California State University 2008, page 66).
Technological Factors
The main technological weakness of renewable sources is that they are not predictable. This is a problem as large scale storage for energy has not yet been fully developed. Further, renewable power stations must be built in specific locations according to where the renewable power can be generated. This requires a substantial number of new transmission lines to be built, often constituting billion-dollar projects. To execute such projects is even harder in California as property owners in projected transmission locations have the chance to object to
lines being built. On average, it takes 8 years from the first transmission line proposal to finalising the construction (Randy Chinn 2009, pers. comm., 05 Aug).
Concerning solar energy, California has put its focus on PV panels as individual homeowners can participate in using them (Randy Chinn 2009, pers. comm., 05 Aug). However, the payback side on efficiency is four times bigger than on electricity (Ben Fineklor 2009, pers. comm., 07 Aug). Individuals would hence benefit more from investing in upgrading their houses to be more energy efficient rather than in PV panels. The subsidy money could then go to R&D or implementation of other forms of solar technologies that can be used on a large scale and hence more efficiently by utility providers. A PV panel solar plant is already functional in the Mojave Desert but California has just started venturing in concentrated photo voltaics (CPV). No such projects have been constructed yet due to concerns about the current stage of the technology which does not suit desert conditions (Randy Chinn 2009, pers. comm., 05 Aug).
As the process of developing desalination moves along a steep learning curve this implies limited capabilities to support developing large-scale desalination facilities (California State University 2008, page 24). Further, several advantages have been identified of co-locating desalination facilities with plants using once-through cooling (Department of Water Resources 3003). Due to the location dependence of renewable sources this implies a disadvantage for desalination plants that want to use renewable energy but cannot position a renewable source as part of their plant.
8.3 Opportunities Political Factors
Backup for the development of renewable sources comes from the U.S. Department of Energy’s Office of Energy Efficiency and Renewable Energy (EERE). So far States have been on their own in promoting sustainability, but a closer working relationship between the EERE and State organizations has begun to pursue R&D in renewables technologies (U.S. Department of Energy n.d.).
On an international renewables agenda organizations such as the International Energy Agency (IEA) provide opportunities for knowledge exchange. The IEA works between governments as energy adviser to 28 countries including the U.S. The aim is to provide for reliable, affordable, and clean energy provisions among members (International Energy Agency n.d.).
The International Desalination Association (IDA) is a United Nations’ NGO. With more than 2,000 members from 58 countries it is the leading international organization for sharing knowledge about desalination and desalination technologies. Further, it encourages research into desalination (IDA n.d.).
As many countries are venturing in renewable energies and desalination, international organizations are an important way to learn from each other in order to create a greater global outcome. California should keep a close eye on the American participation and promote for its companies to acquire memberships.
Economic Factors
The EERE’s Solar Energy Technologies Program (SETP or Solar Program) aims at developing financially competitive solar technology systems. The Program spends more than $170 each year on R&D for photo voltaics and concentrated solar power. The goal is to reach cost competitiveness by 2015. Further, the SETP has a portfolio of not less than 8 different funding opportunities for solar projects depending on technology and scale employed (Energy Efficiency and Renewable Energy n.d.). For example, the federal government subsidises 30% of the cost of installing PV panels (Randy Chinn 2009, pers. comm., 05 Aug).
Further economic opportunities for California come from the American Recovery and Reinvestment Act (ARRA). The ARRA’s $787 billion package is designed to boost the U.S. economy through spending and tax measures. As for renewable energy such as solar, the program only has an indirect impact through stabilizing the Californian economy. However, one of its program areas is called Drinking Water State Revolving Fund and provides $159 million to California for upgrading its drinking water system, of which desalination facilities providing potable water are an example (California Budget Project 2009).
Socio-Cultural Factors
Today more than ever before, one can see a worldwide change in lifestyle towards sustainability. This change heavily increases the demand for renewables among countries and as a result one will see an increased research and development into technologies. Opportunities hence arise from skilled people being attracted from all over the world to bring new know-how to California.
Technological Factors
As world wide research in renewables and desalination goes about and know-how is exchanged on a country and international basis, technologies move down the lifecycle. In taking advantage of lower costs and increased efficiency, this opens up for new technical opportunities such as venturing in combining desalination with renewables.
As of 2008, California saw 40 desalination facilities in various stages of operation or planning (for details please see Appendix 15.11). There is hence plenty of opportunity to integrate renewable energy as the main energy provider to upcoming new plants.
8.4 Threats Political Factors
Challenges to desalination come especially from environmentalists. They highlight the cumulative impacts from the increased numbers of desalination facilities. Examples are the ecological impacts associated primarily with seawater intakes, and the environmental and ecological impacts associated with brine discharge (California State University 2008, page 23). Already meeting these challenges is the need for desalination facilities to undergo a comprehensive environmental review under the California Environmental Quality Act (CEQA), most likely through the Environmental Impact Report (EIR) process (California State University 2008, page 54).
This kind of screening is important in many ways. However, an official working for the DWR expressed his concerns: “My main concern is every single agency under the sun has a piece of the review process, making it a bureaucratic nightmare. It would be great if they could find a way to consolidate that process” (Cited in California State University 2008, page 66). The table in Appendix 15.12 highlights this point as it is a comprehensive but still incomplete list of permits and approvals likely needed for a coastal desalination facility.
Economic Factors
Desalination costs have decreased over the last 10 years. A decade ago the cost of producing water through desalination was $2,000 / acre-foot. Depending on prevailing energy costs, the price is around half that today. Nevertheless, in South California desalinated saltwater is still twice as expensive as conventional water supplies (DWR official, cited in California State University 2008, page 64). Another official went as far as stating: “A lingering dispute over
water rates has apparently become the latest threat to […] dreams of turning ocean water into drinking water” (Cited in California State University 2008, page 65).
Socio-Cultural Factors
Many people doubt that renewables are an efficient way to provide energy to a world population soon to reach 8 billion. Instead they advocate for more nuclear power plants to be build. Hence, if the population proves to grow at the rate anticipated and renewables don’t become much more efficient than they are today, these people may gain increasingly more supporters and the concept of renewables as we know it today be threatened.
Technological Factors
Several cities in California run their own electric systems, for example through private companies providing electricity services rather than relying on mega corporations such as CAISO (Randy Chinn 2009, pers. comm., 05 Aug). This constitutes a threat to desalination plants as they risk not being able to take advantage of large scale low-cost power provided by the public grid. Even if such a plant was co-located with a renewable energy source, this would constitute a reasonable uncertainty as renewables are still unpredictable and plants need to rely on conventional energy in case of breakdowns.
9 Market Analysis Jordan
9.1 Strengths Political Factors
The Jordanian constitution provides the primary framework for safeguarding basic freedoms based on the principle of separation of powers, independence of the judiciary, accountability of the executive branch, and rotation of authority. This provides the basis for recommendations of how to implement renewable energy sources such as solar power and desalination plants based on the example of California.
Economic Factors
Jordan has almost no indigenous energy reserves and hence imports 96 % of its energy resources. Due to economic growth and an increasing population, it is expected that energy demand will increase annually by at least 5.5 % over the next 15 years and electricity demand will double within the next 12 years. Further, increasing energy prices are a major weakness to this situation. This can be seen on the energy bill which accounted for 19.1 % of GDP in 2006, 20.3 % of GDP in 2007 (JD 3.2 billion), and 22 % of GDP in 2008.
Hence, the development of a source providing reliable energy at a reasonable cost by diversifying the country’s energy supply mix is a crucial element of Jordan’s economic development. According to the government, the required investment in developing the energy sector is $14 – 18 billion (an average of $1.2 billion per year) over the period 2007 - 2020. As of today, Jordan’s energy mix only sees 2 % of renewable energy and further development into this direction is hence a given necessity. The governments has dedicated $1,415 - 2,115 million of the total energy development budget to renewables and thereby aims at increasing the percentage of renewables in the energy mix to 7 % by 2015 and 10 % by 2020 (Ministry of Energy and Mineral Resources 2007). For further details, please see Appendix 15.13, 15.14, and 15.15.
Socio-Cultural Factors
The development and execution of the energy sector and water infrastructure will entail large scale planning and engineering challenges, involving technology transfer, enhanced local know-how, and encouraging research and development in the field.
Jordan has a considerable mismatch between qualifications and job market requirements. For example, the amount of engineers outweighs the number needed in the field. To create new engineering sector such as renewables and desalination provide great opportunity for these unemployed people.
Technological Factors
Jordan’s aim is to build a national science and technology base aimed at fasten the economic, social, and cultural development within the kingdom. For this reason, the government has established a Science and Technology Council. Science and technology are tools to enhance the capacity in all fields of comprehensive development in coordination among the different sectors involved. The council builds national scientific and technological capabilities and continuously develops increasing awareness of applied scientific research, providing financial support needed for scientific and technological activities.
9.2 Weaknesses Political Factors
Jordan faces a strong negative impact from the open or frozen conflicts in the region.
The Electricity sector consists of a central transmission network company, The National Electric Power Company (NEPCO), and regional generation and distribution companies who sell or purchase electricity, to or from, NEPCO. This disadvantage of being dependent on a monopoly puts many constraints to electricity provision.
Jordan does not employ any specific financial support for water desalination. This is a major threat as to realize projects that may not be able to receive other funding in a globally hit economy.
Technological Factors
As can be seen from the worldwide insulation map in Appendix 15.16, Jordan is located in one of the most sun abundant regions of the world. With an annual daily average solar irradiance between 5 - 7 kWh / m² and 297 sunny days annually it is a very attractive place for employing solar technologies. And still, so far only a negligible amount of solar power is produced. For example, about 15 % of households use solar water heaters. Further, solar energy is also used for a variety of agricultural purposes (greenhouses, drying, and water heating), minerals extraction at the Dead Sea Works, and water heating production in many educational and commercial buildings.
Similar is true for desalination. No plants have been built yet and only one other nuclear driven plant option for Aqaba has been investigated so far. Foreign start-up companies in the solar and desalination industry hence face big pioneering costs until a general technical know how base for large scale solar projects has been implemented.
Does the same count for desal? Are there already desal plants? 9.3 Opportunities
Political Factors
Due to the complex political issues of building nuclear power plants in the region, the ability to employ renewable energy such as solar power with desalination is a welcomed opportunity.
Economic Factors
Economic opportunities derive from the growing role of energy flows in the region, the increased importance of the red sea in the global oil market, and the potential of bright young exchanges as part of the educational development and cultural dialogue.
Socio-Cultural Factors
The developments in the urban regeneration and renewables’ programs aim to put Jordan on the map for business.
Technological Factors
As Jordan proves to be efficient in the development of its renewable energy and desalination sector, this will create incentives for foreign organizations to start business in Jordan and hence provide for technological knowledge transfer.
If proved feasible, developing desalination in Aqaba has opportunity to be developed on a large scale to provide northern cities with potable water. The reason is the downward sloping surface of the country from the sea towards the north. A pipe transferring seawater to desalination plants in the north would not even need pumps as the water flows by itself. 9.4 Threats
Political Factors
A major threat comes from the growth in the illegal migration flows which increases the population unnaturally. This is a threat to renewable energy and desalination as the amount of energy and water that they can produce is limited. To burden them with an extra output requirement that they were not designed for may let them appear inefficient and their feasibility may be questioned.
Economic Factors
Jordan’s scarce natural resources are vulnerable. They face various pressures, the most current one being the weak global economy.
Socio-Cultural Factors
The low income in rural areas puts pressure on urban and coastal areas as many people move to the cities. This in term puts increased pressure onto the cities infrastructure that is not designed for a very large scale.
10 Comparative analysis of the Californian and Jordan Markets
As can be seen from the above market analysis, Jordan employs funding for the development of solar energy but doesn’t do so for desalination. The most important message to be learned from California and that should be given on to Jordan is that the development of renewables
![Figure 1. Principle of operation of multiple-effect boiling (MEB) system [1]](https://thumb-us.123doks.com/thumbv2/123dok_us/9828873.2869963/10.892.110.576.864.1108/figure-principle-operation-multiple-effect-boiling-meb.webp)