FCS SLAG FOR CONTINUOUS
COPPER CONVERTING
A thesis submitted in fulfilment of the requirements for the
degree of Doctor of Philosophy (PhD)
Rajneet Kaur
B.Eng (Chemical Engineering, Hons.)
School of Civil, Environmental & Chemical Engineering
Science, Engineering & Technology (SET) Portfolio
RMIT University
July 2007
Declaration
I, Rajneet Kaur, certify that the work presented in this thesis comprises only my original work. The experiments were carried out by me in the laboratories at the School of Civil, Environmental and Chemical Engineering, RMIT University. This research has not been previously submitted to any other university or institute for a degree or an award. Due acknowledgements have been made throughout this thesis to all materials used.
Rajneet Kaur July 2007
Acknowledgements
I wish to thank my supervisors, A/Prof Doug Swinbourne (Head of the School of Civil, Environmental & Chemical Engineering, RMIT University) and Dr. Colin Nexhip (Rio Tinto Technology and Innovation) for their constant supervision and guidance during the course of this research project and for their thoroughness in editing this thesis. I would like to thank the Department of Civil and Chemical Engineering, RMIT University as well as Rio Tinto Technology and Innovation for the provision of their laboratories and other facilities needed to carry out the experimental work. My appreciation is extended to the Mineralogy team at Rio Tinto Technology and Innovation for their help in sample preparation, in using the QEM SEM and for their assistance in data analysis.
This work was financially supported by an Australian Government APAI scholarship and by Rio Tinto Technology and Innovation.
T
ABLE OF
C
ONTENTS
LIST OF FIGURES VII
LIST OF TABLES XIII
ABSTRACT 1
1.0 INTRODUCTION 2
2.0 LITERATURE REVIEW 5
2.1 COPPER SMELTING & CONVERTING 7
2.1.1 Introduction 7
2.1.2 Copper Smelting 9
2.1.3 Copper Converting 9
2.1.4 Batch Converting 10
A) Peirce-Smith Converter 10
2.1.5 Pressures on Batch Converting Practices 12
2.1.6 Moving towards Continuous Converting Practices 14
2.1.7 Mitsubishi Process 15
2.1.8 Kennecott/Outokumpu Oy Flash Converting Process 17
2.2 THERMODYNAMIC DESCRIPTION 19
2.2.1 Physical Chemistry and Thermodynamics 19
A) Physical Chemistry of Smelting 19
B) Physical Chemistry & Thermodynamics of Converting 22
2.2.2 Yazawa Chemical Potential Diagram 26
A) Smelting 26
B) Effects of Magnetite on Converting 30
C) Batch Converting 31
D) Continuous Converting 32
2.3 COPPER SMELTING SLAGS 33
2.3.1 Phase Equilibria 34
A) The FeO-Fe2O3-SiO2 and FeO-Fe2O3-CaO systems 34
B) The Effects of Copper on the Liquid Region of both Iron
Silicate & Calcium Ferrite Slags 35
C) The Fe3+/Fe2+ ratio of Iron Silicate and Calcium Ferrite
Slags 37
1) Iron Silicate Slag 37
2) Calcium Ferrite Slag 39
2.4 FURNACE REFRACTORIES 41
2.4.1 Silicate-Bonded Magnesia-Chrome Refractory Bricks 43
2.4.2 Direct-Bonded Magnesia-Chrome Refractory Bricks 44
A) Phases present in Direct-Bonded Magnesia-Chrome
Refractory Bricks 45
1) Periclase 47
2) Chromite Spinel 47
3) Voidage 48
B) Properties of Direct-Bonded Magnesia-Chrome Refractory
Bricks 49
2.4.3 Fused-Cast Magnesia-Chrome Refractory Bricks 50
2.5 REFRACTORY WEAR BY SLAG 52
2.5.1 Refractory Wear by Iron Silicate Slag 53
2.5.2 Refractory Wear by Calcium Ferrite Slag 59
2.5.3 Refractory Wear by Calcium Ferrite Slag vs. Iron Silicate Slag 66
2.6 REFRACTORY WEAR ALLEVIATION 67
2.7 MINOR ELEMENT DISTRIBUTION 70
2.7.1 Distribution Thermodynamics 71
2.7.2 Distribution Behaviour of Typical Minor Elements between
Slag and Liquid Copper 74
2.7.3 Regular Solutions Model and its Application to Ternary
FeOx-SiO2-CaO Slag System 78
2.7.4 Predicted Distribution Behaviour of Minor Elements in FCS Slag 84
2.8 MINOR ELEMENT DISTRIBUTION- A REVIEW OF EXPERIMENTAL DATA 85
2.8.1 Distribution of Lead between Slag and Copper Metal 85
2.8.2 Distribution of Antimony between Slag and Copper Metal 92
2.8.3 Distribution of Nickel between Slag and Copper Metal 101
2.8.4 Summary 109
2.9 FERROUS CALCIUM SILICATE SLAG 111
2.9.1 Phase Equilibria and Liquidus Surface of FCS Slag 111
2.9.2 Dissolution of Copper and Other Neutral Minor
Elements in FCS Slag 120
2.9.3 Dissolution of Basic and Acidic Minor Elements in FCS Slag 127
2.10 SUMMARY TO LITERATURE 132
4.0 EXPERIMENTAL SECTION 135
4.1 INTRODUCTION 136
A) Slag/brick Experiments 136
B) Minor Element Distribution Experiments 136
4.2 SCOPE & LIMITATIONS 137
4.3 FURNACE SET-UP 138
4.3.1 Experimental Apparatus 138
4.3.2 Hot Zone Calibration 141
4.3.3 Temperature Control 142
4.3.4 Furnace Atmospheric Control 142
4.4 MATERIALS 143
4.4.1 Slag 143
4.4.2 Saturation of NiO, PbO and SbO1.5 in FCS slag 146
4.4.3 Metal 147
4.4.4 Refractory Brick 147
4.5 EXPERIMENTAL PROCEDURE 148
4.5.1 Slag/Brick Experiments 148
4.5.2 Minor Element Distribution Experiments 150
4.6 ANALYSIS OF SAMPLE 151
4.6.1 Slag/brick Experiments 151
4.6.2 Minor element distribution Experiments 152
4.7 ERROR ANALYSIS 152
4.7.1 Furnace Temperature 152
4.7.2 Gas Composition 153
4.7.3 Slag & Alloy Composition 154
5.0 RESULTS & DISCUSSION 155
5.1 BRICK WEAR EXPERIMENTS 156
5.1.1 Virgin Magnesia-Chrome Refractory 156
A) Periclase 158
B) Chromite Spinel 159
5.1.2 Initial Slag Composition 161
5.1.3 Mechanism of Refractory Wear- Reacted Samples 161
A) Experiments 161
1) 8 Hours Contact Time 165
2) 32 Hours Contact Time 166
3) 1400oC and FCS slag 167
C) Microstructure 168
1) 8 Hours Contact Time 168
2) 32 Hours Contact Time 174
3) 1400oC and FCS slag 176
D) EDX Analysis 177
1) Chromite Spinel at 1300oC, oxygen partial pressure of 10-6 atm 178
2) MgO-Cr2O3-Fe2O3 system at 1300oC 186
3) Periclase at 1300oC, oxygen partial pressure of 10-6 atm 188
4) MgO-FeO-Fe2O3 system at 1300oC 195
5) FCS Slag Composition - 8 hours of contact, 1300oC and
oxygen partial pressure of 10-6 atm 198
5.1.4 Comparison of the Refractory Wear by FCS, Calcium Ferrite
and Iron Silicate slags at 1300oC 200
5.1.5 Attack of Magnesia-Chrome Refractory by FCS Slag at 1400oC 202 1) Chromite Spinel at 1400oC, oxygen partial pressure of 10-6
atm., for 8 hours 202
2) Periclase at 1400oC, oxygen partial pressure of 10-6 atm.,
for 8 hours 205
5.1.6 Suitability of FCS slag for Continuous Copper Converting 208
5.2 MINOR ELEMENT DISTRIBUTION 209
5.2.1 Distribution of Lead, Nickel and Antimony between
FCS slag and Copper 212
A) Lead Distribution 212
B) Nickel Distribution 214
C) Antimony Distribution 216
5.2.2 Comparison of the distribution of ratios 218
5.2.3 Activity Coefficients of PbO, NiO and SbO1.5 in Iron Silicate,
Calcium Ferrite and FCS slag at 1300oC and oxygen partial
pressure of 10-6 atm. 221
5.2.4 Comparison of the experimental distribution behaviour
with thermodynamic predictions 223
5.3 COMMERCIAL ASPECTS OF FCS SLAG 229
6.0 CONCLUSIONS 231
7.0 REFERENCES 234
L
IST OF
F
IGURES
Figure 2.1.1: Flow sheet of the typical processing of copper ore viapyrometallurgical operations (Fahey, 2002) 8
Figure 2.1.2: Peirce-Smith Converter (Boldt and Queneau, 1967) 11
Figure 2.1.3: Charging, Blowing and Skimming action of the PS converter (Boldt
and Queneau, 1967) 11
Figure 2.1.4: Mitsubishi Process (Shibasaki and Kanamori, 1989) 15
Figure 2.1.5: Kennecott-Outokumpu Flash Converting technology (Fahey, 2002) 19 Figure 2.2.1: Effect of silica upon matte/slag separations (Biswas and Davenport,
1980) 21
Figure 2.2.2: Ellingham Diagram at Standard Conditions (Swinbourne, 2003) 23
Figure 2.2.3: Cu-S phase diagram (Biswas and Davenport, 1980) 24
Figure 2.2.4: Yazawa Chemical Potential Diagram (Yazawa, 1980) 28
Figure 2.2.5: FeS-FeO-Cu2S System (Swinbourne, 2003) 29
Figure 2.3.1: Liquidus region and iso-equilibrium oxygen potential lines at 1300oC for the systems of FeO-Fe2O3-CaO (solid lines) and FeO-Fe2O3-SiO2 (dashed lines)
(Yazawa, Takeda and Waseda, 1981)
34 Figure 2.3.2: Effects of Cu2O on the liquid region of FeO-Fe2O3-SiO2 at 1300oC
and an oxygen partial pressure of 10-6 atm. (Kongoli, McBow and Yazawa, 2006) 36
Figure 2.3.3: Liquid region of calcium ferrite slag at 1300oC and an oxygen partial
pressure of 10-6 atm. (Kongoli, McBow and Yazawa, 2003). 36
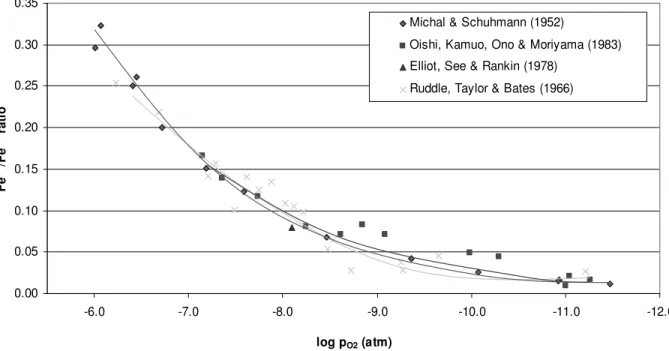
Figure 2.3.4: Fe3+/Fe2+ ratio in iron silicate slag at 1300oC and various oxygen
potentials 39
Figure 2.3.5: Fe3+/Fe2+ ratio in calcium ferrite slag at 1300oC and various oxygen
potentials 40
Figure 2.4.1: Phase Diagram of the System MgO-Cr2O3-Fe2O3 at 1300oC (Levin
and McMurdie, 1975) 45
Figure 2.4.2: SEM backscattered electron image showing periclase phase existing in a commercial magnesia-chromia refractory brick at ambient temperature (Fahey, 2002).
46 Figure 2.4.3: SEM backscattered electron image showing spinel phase existing in a commercial magnesia-chromia brick at ambient temperature (Fahey, 2002). 48
Figure 2.4.4: SEM backscattered electron image showing voidage in a commercial magnesia-chromia refractory brick microstructure at ambient temperature (Fahey, 2002).
48 Figure 2.5.1: The three-dimensional model of the FeO-Fe2O3-MgO-SiO2 system as
compiled by Muan and Osborn (Slag Atlas, 1995) 54
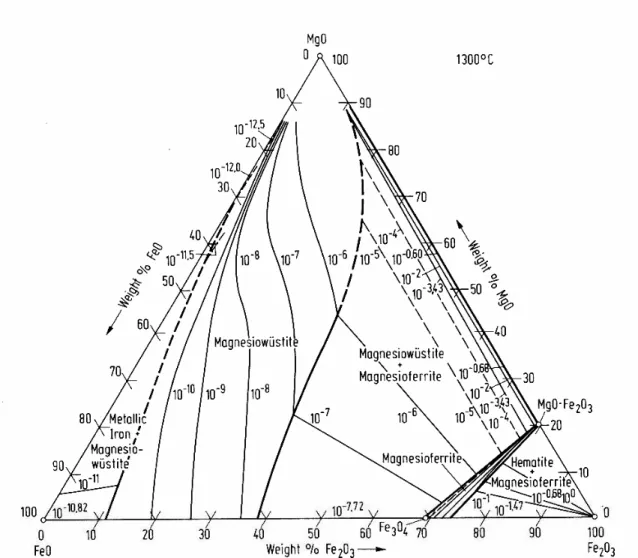
Figure 2.5.2: Phase diagram of the FeO-Fe2O3-MgO system at 1300oC and various
Figure 2.5.3: Phase diagram of the FeOx-MgO-SiO2 system in air (Slag Atlas,
1995) 57
Figure 2.5.4: Phase diagram of the FeOx-MgO-SiO2 system at 1 atm (Slag Atlas,
1995) 58
Figure 2.5.5: Magnesia-chrome refractory wear caused by calcium ferrite slag at
1300oC and 3.7 x 10⁻⁴ atm (Fahey, 2002) 63
Figure 2.5.6: The solubilities of MgO and Cr2O3 (from synthetic MgCr2O4 bricks)
in calcium ferrite slag for various copper oxide contents in slag at 1300oC and 3.7 x 10⁻⁴ atm (Yan, Sun and Jahanshahi, 2001)
65 Figure 2.6.1: Arrangement of refractory brick and cooling jackets in the C-furnace
(Ajima, Hayashi, Nishiyama and Shimizu, 1993) 68
Figure 2.7.1: Relationship between the activity coefficients of oxides and the mole
fraction of oxides in slag at 1250oC (Yazawa, Nakazawa and Takeda, 1983) 72
Figure 2.7.2: Total moles of constituents in 100g of slag and copper phases
(Yazawa, Nakazawa and Takeda, 1983) 73
Figure 2.7.3: Distribution ratios of Zn, Pb, Cu, Bi and Ag between slag and liquid
copper in sulphur free systems at 1250oC (Yazawa, 1984) 74
Figure 2.7.4: Distribution ratios of Co, Sn, Sb and As between slag and liquid
copper in sulphur free systems at 1250oC (Yazawa, 1984) 75
Figure 2.7.5: Isobars of activity and activity coefficients of neutral oxides in AO-BO-MO ternary derived from α values of –9, 0 and –1 for each binary (Yazawa, 1994)
81 Figure 2.7.6: Isobars of activity and activity coefficients of basic oxides in AO-BO-MO ternary derived from α -values of –9, 2 and –5 for each binary (Yazawa, 1994) 82
Figure 2.7.7: Effects of CaO contents in slag on distribution ratio between calcium
ferrite slag and liquid copper (Yazawa, 1984) 83
Figure 2.8.1: Relationship between oxygen partial pressure and the activity coefficient of PbO in both iron silicate and calcium ferrite slags and copper at 1250oC (Takeda, Ishiwata and Yazawa, 1984)
89 Figure 2.8.2: Distribution of antimony between copper and iron silicate slag as a
function of oxygen partial pressure at 1250oC (Yazawa, 1980). 93
Figure 2.8.3: Distribution of antimony in copper and iron silicate slag as a function
of oxygen partial pressure at 1250oC (Kim and Sohn, 1998). 93
Figure 2.8.4: Distribution of antimony in calcium ferrite slag and copper as a function of oxygen partial pressure at 1250oC (Takeda, Ishiwata and Yazawa, 1984).
94 Figure 2.8.5: Activity coefficient of antimony oxide in calcium ferrite slag as a
function of oxygen partial pressure at 1250oC (Takeda, Ishiwata and Yazawa, 1984).
97 Figure 2.8.6: Distribution of antimony in calcium ferrite slag and copper as a
function of oxygen partial pressure at 1250oC (Eerola, Jylha and Taskinen, 1984). 98
Figure 2.8.7: Distribution of nickel between iron silicate slag and copper as a
Figure 2.8.8: Relationship between (Ni wt%)/aNi(l) and pCO2/pCO ratio (Grimsey
and Biswas, 1976) 103
Figure 2.8.9: Distribution of nickel in calcium ferrite slag and copper as a function
of oxygen partial pressure at 1250oC (Takeda, Ishiwata and Yazawa, 1984). 104
Figure 2.9.1: Liquid region in the FeOx-SiO2-CaO system at 1300oC and oxygen
partial pressure of 10-6 atm (Kongoli, McBow and Yazawa, 2006) 111
Figure 2.9.2: Liquid region of FeOx-SiO2-CaO slag at 1300oC and oxygen partial
pressure of 10-8 atm according to model predictions and available experimental data (Kongoli, McBow, Yazawa, Takeda, Yamaguchi, Budd and Llubani, 2006)
113 Figure 2.9.3: Liquid region of FeOx-SiO2-CaO slag at 1300oC and oxygen partial
pressure of 10-7 atm according to model predictions and available experimental data (Kongoli, McBow, Yazawa, Takeda, Yamaguchi, Budd and Llubani, 2006)
113 Figure 2.9.4: Liquid region of FeOx-SiO2-CaO slag at 1300oC and oxygen partial
pressure of 10-6 atm according to model predictions and available experimental data (Kongoli, McBow, Yazawa, Takeda, Yamaguchi, Budd and Llubani, 2006)
114 Figure 2.9.5: Effects of oxygen partial pressure on the homogenous liquid region of
‘FeO-Fe2O3’-SiO2-CaO system at 1300oC (Kongoli, McBow and Yazawa, 2006)
115 Figure 2.9.6: Effects of temperature on the homogeneous liquid region of
‘FeO-Fe2O3’-SiO2-CaO system at oxygen partial pressure of 10-6 atm (Kongoli, McBow
and Yazawa, 2006)
116 Figure 2.9.7: Liquid region of FeOx-SiO2-CaO slag with 0% Cu2O at 1300oC and
oxygen partial pressure of 10-6 atm (Kongoli, McBow and Yazawa, 2006) 117
Figure 2.9.8: Liquid region of FeOx-SiO2-CaO slag with 10% Cu2O at 1300oC and
oxygen partial pressure of 10-6 atm (Kongoli, McBow and Yazawa, 2006) 118
Figure 2.9.9: Effects of Cu2O on the liquidus temperature at oxygen partial
pressure of 10-6 atm and Fe/SiO2 ratios of 2.3 (Kongoli, McBow and Yazawa, 2006) 119
Figure 2.9.10: Comparison of the slag compositions employed by Vartiainen et al.,
Takeda, Ojima et al. for experimentation. 121
Figure 2.9.11: Activity coefficient of CuO0.5 (solid lines) and total dissolution loss
function f(Cu)T (dashed lines) in FeOx-SiO2-CaO system (Takeda, 1994) 123
Figure 2.9.12: %Cu in slag as a function of oxygen partial pressure in blister
copper for various slag systems (Vartiainen, Kojo and Rojas, 2003). 124
Figure 2.9.13: Activity coefficient of PbO (solid lines) in slag (Takeda and
Yazawa, 1989) 128
Figure 2.9.14: Distribution coefficient of Pb as a function of %S in blister copper.
(Vartiainen, Kojo and Rojas, 2003) 129
Figure 2.9.15: Activity coefficient of AsO1.5 (solid lines) in slag (Yazawa, Takeda
and Nakazawa, 1999) 130
Figure 2.9.16: Distribution coefficient of As, LAss/m, in FeOx-SiO2-CaO system at
constant copper content in slag. AA’ = Iron silicate slag (Vartiainen, Kojo and Rojas, 2003)
131 Figure 4.3.1: Vertical tube furnace used in the slag/brick and minor element
Figure 4.3.2: Experimental apparatus including gas sources, flow-meters, gas
cleaning units and furnace 140
Figure 4.3.3: Temperature profile of the vertical tube furnace 141
Figure 4.4.1: Heating curve for master slag preparation 144
Figure 4.4.2: Liquid region of FeOx-SiO2-CaO slag with 10% Cu2O at 1300oC and
an oxygen partial pressure of 10-6 atm with experimental slag compositions (Kongoli, McBow and Yazawa, 2006).
145 Figure 4.4.3: Dimensions of the magnesia-chrome refractory crucibles used in the
slag/brick experiments (not to scale). 147
Figure 4.5.1: Heating curve for the slag/brick and minor element distribution
experiments 149
Figure 4.5.2: Arrangement of the crucible for the minor element distribution
experiments 150
Figure 4.6.1: Sectioning of the slag/brick sample 151
Figure 5.1.1: SEM backscattered electron image showing the periclase phase (dark
grey) in a direct-bonded magnesia-chrome refractory brick 157
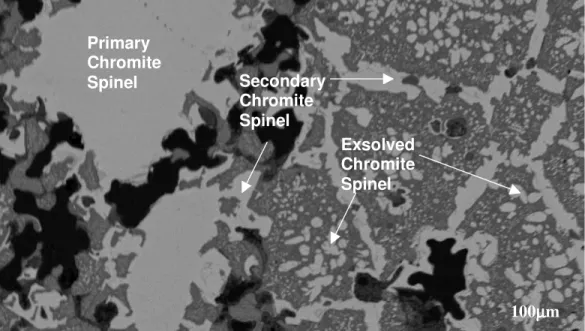
Figure 5.1.2: SEM backscattered electron image showing the primary
chromite-spinel phase in a direct-bonded magnesia-chrome brick 157
Figure 5.1.3: SEM backscattered electron image showing the secondary and
exsolved chromite-spinel phase in a direct-boned magnesia-chrome brick 158
Figure 5.1.4: Comparison of composition of the three different forms of chromite
spinel in a magnesia-chrome brick at ambient temperature. 160
Figure 5.1.5: Magnesia-chrome brick in contact with FCS slag at 1300oC, an
oxygen partial pressure of 10-6 atm. for 32 hours. 166
Figure 5.1.6: Attack by calcium ferrite slag at 1300oC, an oxygen partial pressure
of 10-6 atm. for 32 hours. 167
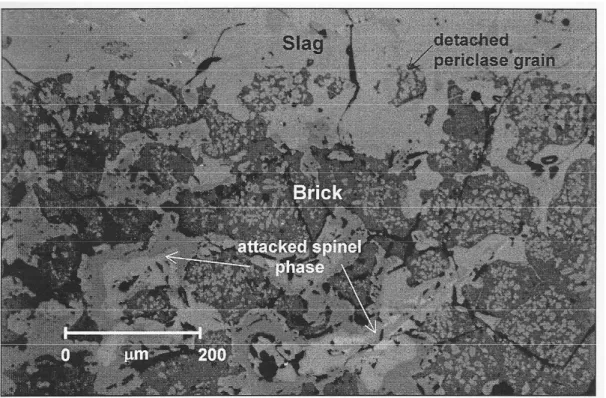
Figure 5.1.7: BSE image showing the microstructure at the slag/brick interface of
FCS slag at oxygen partial pressure of 10-6 atm, 1300oC for 8hrs 169
Figure 5.1.8: BSE image showing the microstructure at the slag/brick interface for
calcium ferrite slag at oxygen partial pressure of 10-6 atm, 1300oC for 8hrs. 170
Figure 5.1.9: Elements scans (Al, Ca, Cr, Cu, Fe, Mg, Si) of the constituents of slag and brick to show their location after brick contact with FCS slag at 1300oC and oxygen partial pressure of 10-6 atm for 8 hours
172 Figure 5.1.10: Elements scans (Al, Ca, Cr, Cu, Fe, Mg) of the constituents of slag
and brick to show their location after brick contact with calcium ferrite slag at 1300oC and oxygen partial pressure of 10-6 atm for 8 hours
173 Figure 5.1.11: SEM (backscatter electrons) image showing the microstructure at
the slag/brick interface of the FCS slag experiment at oxygen partial pressure of 10-6 atm, 1300oC for 32hrs.
174 Figure 5.1.12: SEM (backscatter electrons) image showing the microstructure at
the slag/brick interface of the calcium ferrite slag experiment at oxygen partial pressure of 10-6 atm, 1300oC for 32hrs.
Figure 5.1.13: BSE image showing the microstructure at the slag/brick interface of
the FCS slag experiment at oxygen partial pressure of 10-6 atm, 1400oC for 8hrs. 177
Figure 5.1.14: Comparison of composition of chromite spinel grains before and after reaction with calcium ferrite slag at oxygen partial pressure of 10-6 atm., 1300oC for 8hrs
179 Figure 5.1.15: Comparison of composition of chromite spinel grains before and
after reaction with FCS slag at oxygen partial pressure of 10-6 atm., 1300oC for 8hrs 179
Figure 5.1.16: Line scan of chromite spinel at interface of brick contacted with
molten FCS slag at 1300oC, oxygen partial pressure of 10-6 atm., 8 hours 182
Figure 5.1.17: Comparison of composition of chromite spinel grains before and after reaction with calcium ferrite slag at oxygen partial pressure of 10-6 atm., 1300oC for 32hrs
184 Figure 5.1.18: Comparison of composition of chromite spinel grains before and
after reaction with FCS slag at oxygen partial pressure of 10-6 atm., 1300oC for 32hrs
185 Figure 5.1.19: Line scan of chromite spinel at interface of refractory contacted with
molten FCS slag at 1300oC, oxygen partial pressure of 10-6 atm., 32 hours. 185
Figure 5.1.20: Phase Diagram of the System MgO-Cr2O3-Fe2O3 at 1300 o
C (Levin
and McMurdie, 1975) 187
Figure 5.1.21: Comparison of composition of periclase grains before and after reaction with calcium ferrite slag at oxygen partial pressure of 10-6 atm, 1300oC for 8hrs.
189 Figure 5.1.22: Comparison of composition of periclase grains before and after
reaction with FCS slag at an oxygen partial pressure of 10-6 atm., 1300oC for 8hrs 190
Figure 5.1.23: Line scan of periclase at interface of refractory contacted with
molten FCS slag at 1300oC and an oxygen partial pressure of 10-6 atm. for 8 hours 191
Figure 5.1.24: Comparison of composition of periclase grains before and after reaction with calcium ferrite slag at an oxygen partial pressure of 10-6 atm., 1300oC for 32hrs
193 Figure 5.1.25: Comparison of composition of periclase grains before and after
reaction with FCS slag at an oxygen partial pressure of 10-6 atm., 1300oC for 32hrs 194
Figure 5.1.26: Line scan of periclase at interface of brick contacted with molten
FCS slag at 1300oC and an oxygen partial pressure of 10-6 atm., 32 hours 195
Figure 5.1.27: Phase diagram of the FeO-Fe2O3-MgO system along the 1300oC
isotherm at various oxygen partial pressures (Levin and McMurdie, 1975) 197
Figure 5.1.28: Composition of the reacted FCS slag compared to the initial slag composition after 8 hours of contact with refractory at 1300oC and oxygen partial pressure of 10-6 atm.
199 Figure 5.1.29: Comparison of composition of chromite spinel grains before and
after reaction with FCS slag at oxygen partial pressure of 10-6 atm., 1400oC for 8hrs 203
Figure 5.1.30: Comparison of composition of chromite spinel grains taken at the periphery before and after reaction with FCS slag at oxygen partial pressure of 10-6 atm., 1300oC and 1400oC for 8hrs
Figure 5.1.31: Comparison of composition of periclase grains before and after
reaction with FCS slag at oxygen partial pressure of 10-6 atm., 1400oC for 8hrs 206
Figure 5.1.32: Phase diagram of the FeO-Fe2O3-MgO system along the 1400oC
isotherm at various oxygen partial pressures (Levin and McMurdie, 1975) 207
Figure 5.1.33: Comparison of composition of periclase grains before and after reaction with FCS slag at oxygen partial pressure of 10-6 atm., 1300oC and 1400oC for 8hrs
208 Figure 5.2.1: Apparent slag/copper distribution ratio of lead for FCS slag as a
function of time at 1300oC and an oxygen partial pressure of 10-6 atm. 213
Figure 5.2.2: Apparent slag/copper distribution ratio of nickel for FCS slag as a
function of time at 1300oC and an oxygen partial pressure of 10-6 atm. 214
Figure 5.2.3: Apparent slag/copper distribution of antimony for FCS slag as a function of time at 1300oC and an oxygen partial pressure of 10-6 atm. Filled
squares = metal oxide initially in slag, unfilled diamonds = metal initially in copper.
216 Figure 5.2.4: Slag/copper distribution ratio for nickel, lead and antimony for the
three slags; iron silicate, FCS and calcium ferrite at 1300oC and an oxygen partial pressure of 10-6 atm.
218 Figure 5.2.5: Isoactivity coefficients of a neutral oxide (a) and a basic oxide (b) in
SiO2-CaO-MO. (Yazawa, 1994, Reproduced, and modified)
224 Figure 5.2.6: Activity coefficient of AsO1.5 (solid lines) in slag (Yazawa, Takeda
and Nakazawa, 1999) 226
Figure 5.2.7: Distribution ratios of Sb and As between slag and liquid copper at
L
IST OF
T
ABLES
Table 2.7.1: Gibbs free energy and K-values for oxide forming reactions at 1250oC and the distribution ratios of elements between copper and iron silicate and calcium ferrite slags at an oxygen partial pressure of 10-7 atm. and 1250oC. (Source: HSC Chemistry 5.0 for Windows database)
76
Table 2.8.1: Activity coefficients of lead in copper and lead oxide in iron silicate slag
extracted from literature at various conditions 87
Table 2.8.2: Activity coefficients of lead in copper and lead oxide in calcium ferrite
slag extracted from literature at various conditions 88
Table 2.8.3: Calculated distribution ratios of lead between iron silicate slag and copper metal as well as calcium ferrite slag and copper metal at 1300oC and an oxygen partial pressure of 10-6 atm.
91 Table 2.8.4: Activity coefficients of antimony in copper and antimony oxide in iron
silicate slag extracted from literature at various conditions 95
Table 2.8.5: Activity coefficients of antimony in copper and antimony oxide in
calcium ferrite slag extracted from literature at various conditions 96
Table 2.8.6: Comparison of the thermodynamic and experiment data used by Eerola et al. (1984) and Takeda et al. (1984) to calculate the activity coefficient of antimony oxide in calcium ferrite slag.
99 Table 2.8.7: Correlations between activity coefficient of antimony and temperature 100 Table 2.8.8: Calculated distribution ratios of antimony between iron silicate slag and
copper metal and between calcium ferrite slag and copper at 1300oC and oxygen partial pressure of 10-6 atm.
101 Table 2.8.9: Activity coefficients of nickel in copper and nickel oxide in iron silicate
slag extracted from literature at various conditions 105
Table 2.8.10: Activity coefficients of nickel in copper and nickel oxide in calcium
ferrite slag extracted from literature at various conditions 105
Table 2.8.11: Correlations between activity coefficient of nickel in copper and
temperature 108
Table 2.8.12: Calculated distribution ratios of nickel between iron silicate slag and copper metal and between calcium ferrite slag and copper at 1300oC and oxygen partial pressure of 10-6 atm.
109 Table 2.8.13: Summarised data for the distribution of nickel, lead and antimony
between slag and copper at 1300oC and oxygen partial pressure of 10-6 atm. 110
Table 2.9.1: Slag compositions employed by Takeda (A-D), Ojima et al. (E-G) and
Vartiainen et al. (H-J). Q = %CaO/(%CaO + %SiO2) R = %FeOx in slag 122
Table 2.9.2: A comparison of the %Cu in slag for various Q-ratios and %FeOx in slag
at 1300oC and oxygen partial pressure of 10-4.8 to 10-5 atm. 126
Table 4.4.1: Slag composition used in both slag/brick and minor element distribution
experiments 145
Table 4.7.1: Equilibrium constant (K) within the temperature range of 1300±3oC for
oxidation reactions of Sb/SbO1.5, Pb/PbO and Ni/NiO. 153
Table 4.7.2: The flow-rates of CO2 and CO/N2 required for an oxygen partial
pressure of 10-6 atm at 1300oC as well as the bubble flow meter times in seconds. 154
Table 5.1.1: Analysis of periclase in mole per cent 159
Table 5.1.2: Average composition (wt%) of the three different physical forms of
chromite spinel in a magnesia-chrome brick at ambient temperature in weight percent 160
Table 5.1.3: Slag composition (wt%) used in both slag/brick experiments. 161 Table 5.1.4: The experimental conditions of slag/brick experiments 162 Table 5.1.5: Activation energies for solid state diffusion of some oxides in iron
silicate, calcium ferrite and FCS slag and the magnesia-chrome refractories (Kofstad, 1966) at various temperatures
163 Table 5.1.6: Activation energies for viscous flow for iron silicate and calcium ferrite
slags when temperature increases from 1300oC to 1400oC. 164
Table 5.1.7: Average composition (wt%) of chromite spinel grains in a magnesia-chrome refractory in contact with calcium ferrite slag at the slag/refractory interface at oxygen partial pressure of 10-6 atm., 1300oC for 8hrs
178 Table 5.1.8: Average composition (wt%) of chromite spinel grains in a
magnesia-chrome refractory in contact with FCS slag at the slag/refractory interface at oxygen partial pressure of 10-6 atm., 1300oC for 8hrs
178
Table 5.1.9: Ionic radii of selected ions 180
Table 5.1.10: Average composition (wt%) of chromite spinel grains in a magnesia-chrome brick in contact with calcium ferrite slag at the slag/brick interface at oxygen partial pressure of 10-6 atm., 1300oC for 32hrs
183 Table 5.1.11: Average composition (wt%) of chromite spinel grains in a
magnesia-chrome brick in contact with FCS slag at the slag/refractory interface at oxygen partial pressure of 10-6 atm., 1300oC for 32hrs
184 Table 5.1.12: The Fe3+/Fe2+ ratio of iron silicate, calcium ferrite and FCS slag at
1300oC and an oxygen partial pressure of 10-6 atm. 186
Table 5.1.13: Average composition (wt%) of periclase grains in a magnesia-chrome brick in contact with calcium ferrite slag at the slag/refractory interface at oxygen partial pressure of 10-6 atm., 1300oC for 8hrs
189 Table 5.1.14: Average composition (wt%) of periclase grains in a magnesia-chrome
brick in contact with FCS slag at the slag/refractory interface at an oxygen partial pressure of 10-6 atm, 1300oC for 8hrs.
190 Table 5.1.15: Average composition (wt%) of periclase grains in a magnesia-chrome
brick in contact with calcium ferrite slag at the slag/refractory interface at an oxygen partial pressure of 10-6 atm., 1300oC for 32hrs
192 Table 5.1.16: Average composition (wt%) of periclase grains in a magnesia-chrome
brick in contact with FCS slag at the slag/brick interface at an oxygen partial pressure of 10-6 atm., 1300oC for 32hrs.
Table 5.1.17: Composition (wt%) of the reacted FCS slag following compared to the initial FCS slag composition after 8 hours of contact with refractory at 1300oC and oxygen partial pressure of 10-6 atm.
199 Table 5.1.18: Average composition (wt%) of chromite grains in a magnesia-chrome
brick in contact with FCS slag at the slag/brick interface at oxygen partial pressure of 10-6 atm., 1400oC for 8hrs
203 Table 5.1.19: Average composition (wt%) of periclase grains in a magnesia-chrome
brick in contact with FCS slag at the slag/brick interface at oxygen partial pressure of 10-6 atm., 1400oC for 8hrs.
206 Table 5.2.1: Experimental distribution data for FCS slag at 1300oC and oxygen
partial pressure of 10-6 atm. 210
Table 5.2.2: ‘Apparent’ distribution ratios for lead, nickel and antimony between
FCS slag and copper at 1300oC and oxygen partial pressure of 10-6 atm. 211
Table 5.2.3: Accumulated Percent Relative Error from distribution experiments of
each element 211
Table 5.2.4: Slag/copper distribution ratio of lead, nickel and antimony for FCS, iron silicate and calcium ferrite slags at 1300oC and an oxygen partial pressure of 10-6 atm. (Source: Table 2.8.13, Section 2.8.4)
218 Table 5.2.5: Summarised activity coefficient data for lead, nickel and antimony and
their oxides at 1300oC and oxygen partial pressure of 10-6 atm. Liquid reference standard states are assumed for all elements and their oxides.
222 Table 5.3.1: Results from the basic material balance calculations (CF= calcium ferrite
A
BSTRACT
The Peirce-Smith converter has served the copper industry well for over a century, but increasingly stringent environmental regulations and burgeoning energy costs have set the trend towards continuous copper matte converting. A major technical issue with continuous converting is the choice of slag. Iron silicate slags, as used in the Pierce-Smith converter, have many favourable properties including limited wear of the magnesia-chrome refractories and high ability to absorb elements with basic oxides such as lead oxide. Unfortunately, at the high oxygen partial pressures used during copper-making, they have too low a solubility for magnetite and this results in semi-solid viscous slag. Mitsubishi introduced calcium ferrite slag for their continuous converting process because it has high magnetite solubility and high ability to remove elements with acidic oxides such as antimony and arsenic, but it attacks magnesia-chrome refractories severely. Ferrous calcium silicate (FCS) slag has been proposed as a third slag for copper converting. It has been predicted that FCS slag should not be aggressive towards refractories and would have a low copper oxide solubility and suitable solubility for magnetite and both acidic and basic impurity metal oxides. Little is known about the properties of FCS slag, in particular its affect on the wear of magnesia-chrome refractories and the distribution ratio of minor elements between it and copper.
The purpose of this research was to test the potential of FCS slag for application in continuous copper converting. Firstly, refractory wear was investigated and compared to the wear caused by calcium ferrite slag. Secondly, distribution of antimony, lead and nickel between FCS slag and copper was determined. It was found that FCS slag attacks the refractories far less than calcium ferrite slag. The slag/metal distribution ratios for nickel, lead and antimony were determined to be 0.98, 0.93, and 0.54 respectively. These compare very favorably to those for calcium ferrite slag. It was concluded that FCS slag has potential for continuous copper converting and warrants further consideration by industry.
During copper converting the slag is required to have a relatively low viscosity so that it can be tapped easily, and a low rate of attack on the refractory bricks lining the furnace (Biswas and Davenport, 1980). A high solubility for magnetite, Fe3O4, is essential. It is also
required to have a large Cu2O activity coefficient to minimize copper loss and a small activity
coefficient for minor element oxides to maximise their absorption into the slag and therefore the purity of the copper product (Rosenqvist, 1974). Two slag systems, iron silicate slag (FeO-Fe2O3-SiO2) and calcium ferrite slag (CaO-FeO-Fe2O3), are being used for copper converting,
however each slag has its drawbacks. Iron silicate slag has the advantage of high immiscibility with copper and the ability to remove impurities with basic oxides, such as lead. Iron silicate slag is a well established slag for batch converting, however in the case of continuous copper converting where the oxygen partial pressure at which the process operates is much higher, it has some important disadvantages. These include a small composition range within which the slag is fully molten, a low magnetite solubility and a poor ability to remove elements with acidic oxides such as arsenic and antimony. Although some magnetite is desirable as a deposit on the converter walls to protect the refractories, an excessive amount leads to viscous slags, which increases the entrained copper losses to the slag and makes tapping difficult. Mitsubishi Cooperation introduced calcium ferrite slag to overcome the drawbacks of iron silicate slag. The removal of acidic oxides from copper is about of ten times better with calcium ferrite slag than iron silicate slag (Vartianinen et al., 2002). Calcium ferrite also has a much higher magnetite solubility than iron silicate slag. However, due the high basicity and low viscosity of calcium ferrite slag, significant wear to the magnesia-chrome refractories results. Calcium ferrite slag also has limited solubility for silica and a poorer ability to absorb basic oxides, such as that of lead.
Given satisfactory magnetite solubility, the two major issues involving the suitability of a slag for converting are the severity and rate of refractory attack and its ability to absorb minor elements from blister copper. The presence of minor elements such as antimony, arsenic, bismuth, lead and zinc, among others, has a detrimental effect on the physical properties of copper. Arsenic and antimony in copper result in a loss of electrical conductivity whilst the workability of copper is reduced by lead and bismuth. Refractory wear is a major economic and environmental concern. The cost of maintaining and finally replacing refractory bricks as a consequence of slag attack is a significant cost component in copper production. Contact with highly aggressive slags such as calcium ferrite, mechanical stresses and increasingly higher operating temperatures all combine to destroy the refractory bricks lining
the furnace. The most common wear mechanisms include corrosion, erosion and various forms of spalling including mechanical, structural and thermal spalling.
A compromise between calcium ferrite and iron silicate slags offers a possibility to remove both acidic and basic oxides with one slag type whilst retaining a long refractory life. Known as ferrous calcium silicate (FCS) slag, it is located in the FeOx-CaO-SiO2 system. It
was first recognized by Yazawa et al. (1999) as having the potential to become the third copper converting slag, with the ability to solve the difficulties associated with both iron silicate and calcium ferrite slags whilst retaining their merits. It also presents the additional advantage of lower dissolution loss of oxidic copper during the continuous converting process.
The effects of FCS slag on the wear of magnesia-chrome refractories remains unknown, however it could be expected that the ferrous calcium silicate slag would be mild towards refractory bricks (Takeda, 2001). Yazawa et al. (1999) believe that FCS slag should have an optimum viscosity, high enough to limit refractory wear by slag penetration but low enough to reduce entrained copper losses. However any slag used for copper converting must have favorable minor element distribution characteristics, otherwise it will not be used. Whilst calcium ferrite slag is superior in the removal of acidic oxides and iron silicate slag in the removal of basic oxides, FCS slag is expected to perform well in the removal of both acidic and basic oxides. Yazawa et al. (1999) first predicted that for the removal of acidic oxides such as that of antimony, FCS slag will perform similarly to calcium ferrite slag and, whilst the removal of lead from copper is most efficient using acidic iron silicate slag, FCS slag is expected to be two to three times better than calcium ferrite slag. Neutral oxides, such as Cu2O and NiO, are expected to distribute slightly less to FCS slag than both iron silicate and
calcium ferrite slags. While predictions have been made, experimental data is very limited and has been measured under conditions rather different to that applying to continuous copper converting.
This research will provide the first rigorous investigation of the wear mechanisms of magnesia-chrome refractories employed in converting furnaces by FCS slag. It will also provide the first experimentally determined distribution data for a neutral, an acidic and a basic oxide between FCS slag and copper at typical copper converting conditions viz. a temperature of 1300oC and an oxygen partial pressure of 10-6 atm. This information will allow a soundly based assessment of the suitability or otherwise of FCS slag for continuous copper converting.
2.0 LITERATURE
REVIEW
This chapter is a detailed review of the literature relevant to this research. Pertinent background information regarding copper smelting and converting practices as well as the thermodynamics of smelting and converting are highlighted in the initial sections of this chapter. This is followed by a review on the phase equilibria of iron silicate and calcium ferrite slags, used currently in copper converting operations. Due to the importance of understanding magnesia-chrome refractories, which line the converters and the wear caused by iron silicate and calcium ferrite slags to such bricks, the preceding chapters discuss the refractories and refractory wear caused by the current converting slags. The present practices used to alleviate refractory wear are also discussed in this chapter. Following the discussion on refractory wear, this chapter reviews minor element distribution thermodynamics in a slag/metal system as well as reviewing the data available on the distribution of an acidic (SbO1.5), basic (PbO) and neutral (NiO) oxide between iron silicate slag and copper as well as
calcium ferrite slag and copper. This review on refractory wear and minor element distribution is vital to the current research as it allows comparison of the data available on the current two converting slags with the experimental results on FCS slag and be able discuss the benefits of FCS slag, if any, in regards to these two issues. Finally the body of knowledge available at present on the phase equilibria of FCS slag and minor element distribution between FCS slag and copper at converting conditions is discussed. At present there is no information in the literature on refractory wear by FCS slag, so a discussion on refractory wear by FCS slag, using published data, cannot be made.
2.1 COPPER SMELTING & CONVERTING
2.1.1
Introduction
Copper is mainly available for extraction as sulphide mineral ores such as chalcopyrite (CuFeS2). The extraction processes for the recovery of copper metal from these ores are
largely by pyrometallurgical techniques. Initially the copper minerals in the ore are concentrated into high-grade concentrates through physical means of froth flotation, by which copper minerals selectively attach to air bubbles by use of reagents, which render the copper minerals hydrophobic whilst the gangue minerals remain hydrophilic. The high-grade concentrate then undergoes optional roasting, which consists of partially oxidising the sulphides of flotation concentrates and eliminating sulphur as sulphur dioxide. Roasting is accomplished with air at temperatures between 500-700oC, in hearth or fluid bed roasters. The roasting operation is used in smelters, which employ reverberatory or electric furnaces for smelting, where its principal purpose is to dry and heat the furnace charge, using the exothermic heat from the roasting reactions. Roasting also increases the copper concentration of the Cu2S-FeS matte produced during smelting by oxidising some of the FeS to FeO. The
copper concentrate product from roasting undergoes successive stages of smelting, converting and refining, to produce pure copper metal. The process of smelting involves melting and partially oxidising the copper concentrate with air/oxygen to remove most of the FeS as FeO, producing a silicate slag and a Cu2S-rich matte. Converting is the formation of ‘blister’ copper
(99% copper) and slag via the oxidation of iron and sulphur in the copper matte at 1250-1300oC. Figure 2.1.1 illustrates the simplified flow sheet for the typical stages of processing sulphide mineral ores via pyrometallurgical practices to produce copper metal.
Figure 2.1.1: Flow sheet of the typical processing of copper ore via pyrometallurgical operations (Fahey, 2002)
2.1.2 Copper Smelting
The objective of smelting is to form a molten sulphide matte phase, Cu2S-FeS, which
contains 55-75% copper and a discard slag phase with the lowest possible copper content. Smelting is accomplished by melting the copper concentrates or partially roasted concentrates at approximately 1150-1250oC. Silica flux is added to the furnace to separate the copper rich sulphide matte and oxide slag phases as silica addition forms an iron silicate slag with low solubility in the sulphide matte. The effects of silica on matte and slag immiscibility are discussed in Section 2.2.1.
Smelting operations are carried out in bath (blast, reverberatory, electric, Mitsubishi, Ausmelt and Noranda furnaces) and flash furnaces (Outokumpu). The earliest large-scale method of producing copper matte was by blast furnace, which could efficiently treat high-grade (5-20% Cu) sulphide ores to produce matte and slag. As ore high-grades declined, however, it became too expensive to treat ore directly, and concentration by froth flotation became common (Rosenqvist, 1974). The impossibility of using the blast furnace for directly treating fine flotation concentrates led to hearth or reverberatory furnace smelting. Recent developments have led to developments in flash smelting and bath smelting including the electric furnace, Mitsubishi S-furnace as well as the Ausmelt and Noranda furnaces. An in-depth discussion on the smelting furnaces is not offered in this section as the current study addresses only the copper converting processes, in particular, continuous copper converting. The following section gives a detailed review on the current batch and continuous converting practices and the motives behind the growing transitions from batch to continuous converting practices at smelters around the world.
2.1.3 Copper Converting
Molten matte from smelting contains copper, iron and sulphur as its major components. In addition, it contains minor amounts of impurity metals (e.g. As, Bi, Ni, Pb, Sb, Zn and precious metals), present in the original concentrate and not removed during smelting. This matte is charged to a converter for converting to ‘blister copper’. Essentially, converting removes iron, sulphur and other impurities from the matte, thereby producing liquid copper in a crude (98.5-99.5% Cu) form, low in both sulphur and oxygen (0.02-0.1% S and 0.5-0.8% O). Converting proceeds by oxidation reactions at high temperatures of
1250-1300oC where the oxidant is air, oxygen-enriched air or pure oxygen, depending on the technology being implemented. The converting reactions are exothermic and the process is autogenous. The physical chemistry of the converting process as well as the thermodynamics of the process is given in greater detail in Section 2.2.1. The production of blister copper is conducted in two main process types:
• Batch converting, embodied by the traditional PS converters, and
• Continuous converting, including bath converting (Mitsubishi C-furnace and the Noranda converter) and Flash converting.
While batch converting, especially the Peirce-Smith converter, has served the copper industry for over a century, increasingly stringent environmental regulations, rapidly increasing energy costs and a trend towards continuous processing have set the stage for major improvements in this area of copper production.
2.1.4 Batch Converting
A)
Peirce-Smith Converter
Industrial Peirce-Smith (PS) converters (Figure 2.1.2) are typically 4m in diameter and 9m in length (Biswas and Davenport, 1980) and lined with magnesia or chrome-magnesia refractory brick. A smelter normally has three to six converters depending upon its smelting furnace capacity. Air is blown into the converters through a single line of tuyeres, with there being 40-50 tuyeres per converter. Air passes through the matte to achieve oxidation reactions. The converter is provided with a rotating mechanism, which permits it to be positioned for charging, blowing and pouring (Figure 2.1.3).
The Peirce-Smith converter uses a two stage blowing process. In the first step, enriched air blown through tuyeres in the side of the vessel reacts with iron sulphide dissolved in the matte to produce sulphur dioxide gas and FeO. Silica flux is added through the top of the converter and the reaction of FeO with the silica generates an immiscible iron silicate slag phase similar to that produced in the matte smelter. The iron silicate slag is batch removed by skimming from the converter to leave an almost pure Cu2S, ‘white metal’ with less than 2%
blowing stage and is thus recycled back to the smelting furnace to recover the copper from the slag.
The second blow in the PS batch process oxidises the remaining sulphur in the white metal generating blister copper analysing about 0.2% sulphur. No slag is produced at this stage, as very little iron remains to generate an iron silicate slag.
Figure 2.1.2: Peirce-Smith Converter (Boldt and Queneau, 1967)
Figure 2.1.3: Charging, Blowing and Skimming action of the PS converter (Boldt and Queneau, 1967)
2.1.5 Pressures on Batch Converting Practices
The main copper smelting processes in the world today are Outokumpu flash smelting and the Pierce-Smith converting processes. Presently it is estimated that about 50% of the worldwide copper matte production is undertaken by Flash Smelting and 80% of blister copper production is by the PS converting process (Ojima, 2003). Despite its batch operation, the Pierce-Smith converting process has been widely used in many smelters for more than 100 years due to its operational flexibility (Ojima, 2003). Batch treatment of molten copper mattes in rotary Peirce-Smith furnaces has allowed the copper industry to meet increased demands for the metal, brought about by world industrialisation. However, increased awareness of environmental issues and the need to reduce capital and production costs in an increasingly competitive market are forcing the industry to re-examine the Peirce-Smith converting process and evaluate new alternatives to overcome current process limitations.
Over 90% of the world’s primary copper originates in sulphide minerals so that sulphur in some form is a by-product of most copper processing (Biswas and Davenport, 1980). Furthermore, most of the sulphur is emitted as SO2 gas, which is harmful to fauna and
flora if present in the air to even a limited extent. Putting the problem into perspective, a CuFeS2 concentrate produces nearly 1 tonne of sulphur (2 tonnes of SO2) per tonne of copper
extracted (Goto and Hayashi, 2003). The sulphur problem is the most controversial aspect of copper extraction and is forcing smelters to employ more environmentally friendly processes.
Copper smelters are faced with two major problems in association with the sulphur dioxide product stream, how to capture most of the SO2 gas and how to fix the sulphur in a
useful or stable form (e.g. elemental sulphur, liquid SO2 or sulphuric acid). The most common
method of fixing sulphur from SO2 gases is the production of sulphuric acid.
The Peirce-Smith converter was developed at a time when its SO2-bearing gases could
be legally vented directly to the atmosphere. However, due to the increasing concerns over air pollution, it has become desirable, to collect all of the converter gases and to prevent their dilution with air. In order to conform to strict environmental regulations, inclusion of sulphuric acid plants to capture SO2 in many smelters has resulted and whilst tight-fitting,
water-cooled hoods have solved the problem of SO2 capture to some extent, the gases can still
escape from the P-S furnace during the charging and pouring sequences. The greatest pitfall of the P-S converter is the large amounts of fugitive gases given off during the cyclic
operation of the converter and variation in the draft of its gas handling system. Fugitive emissions are generated during charging and discharging of furnaces and during the batch transfer of molten materials into ladles. Huge volumes of air have to be collected along with the fugitive emissions and thus, a very large volume of gas with extremely low SO2 content
has to be treated. The cost of collection, handling and treating a gaseous stream with SO2
content is proportional to its volume or inversely proportional to its SO2 concentration. Thus
emissions of fugitive gases limit the effective operation of sulphur fixation plants due to the varying concentrations of input gas, temperature and gas flow-rates. In light of complying with environmental standards the Peirce-Smith converter has required an ever-increasing number of ‘add-on’ modifications in many plants, adding to the cost of operating the smelter. Another restriction of the Peirce-Smith converter is the limited automation and computer control allowed by the batch process, leading to higher operating costs as a result of the labour required to operate the technology. Conversely, the high cost of gas collection and sulphur fixation equipment has become a major limitation along with increases in energy and labour costs for the P-S technology. Having served the copper industry for many years, the P-S converter is struggling to maintain the environmental, hygiene and efficiency standards of today.
Recently several newly constructed or modernised smelters have applied continuous converting processes in replacement of the P-S converting technology to alleviate the problems associated with batch converting. Continuous copper converting has been commercially available for over 25 years and now produces 15% of copper smelter production (Ojima, 2003). However, the only two commercially proven continuous converting processes with a large production capacity are the Mitsubishi C-furnace and the Kennecott-Outokumpu Flash converter. The continuous converting technology has been in operation in the Mitsubishi C-furnace since 1974 and the flash converter started operation in Kennecott Utah Copper USA in 1995. Although the continuous converting processes have been increasingly used in smelters they still occupy a small portion of the world’s copper production and in spite of the many well-known problems inherent in P-S converting, it remains the dominant copper converting process.
2.1.6 Moving towards Continuous Converting Practices
Since the continuous converting process is carried out in a stationary and sealed vessel allowing tight connections to gas handling equipment and eliminating the need for charging, skimming and pouring, fugitive gas emissions are significantly reduced due to minimised air infiltration. The stationary nature of the furnace also means that the furnace can be sealed more effectively against the outside atmosphere, hence reducing the dilution of SO2 with air.
Continuous converters use high levels of oxygen enrichment, producing concentrated SO2 waste gas at constant flow-rate and temperature and permitting excellent sulphur capture.
Production of highly concentrated off-gases by utilising oxygen enrichment avoids the dilution of furnace off-gases with nitrogen in the air, which results in the production of lower volumes of waste gas. The low volume, concentrated SO2 off-gases, reduces both gas
cleaning and acid plant requirements and thus lowers capital costs. The constant temperature of the gas treated in the acid plant also results in reduced corrosion caused by temperature cycling.
As matte transport in ladles is eliminated and replaced by launders in the process of continuous technology, the corresponding fugitive emissions in the working space are avoided and there is also a reduction in the difficulties of materials handling.
The continuous technology is also better suited for a greater degree of automation and computer control, thereby reducing the labour costs associated with batch converting and increasing production rate of the copper product.
Currently there are a number of continuous and semi-continuous converting processes employed in the copper industry, including the Mitsubishi process, the Noranda process, the Ausmelt technology and the Kennecott/Outokumpu flash converting process. However the following section will only address the Mitsubishi and Kennecott/Outokumpu processes as their converting process is a slag-metal system, which is the interest of this study. The Mitsubishi process is the only successful continuous smelting, converting and refining operation that has been implemented on a commercial scale. In addition to the Mitsubishi process, the Kennecott/Outokumpu process, which is a continuous converting process with the capability of being retrofitted with any smelting technology, for reasons explained later,
has been successfully tested and used industrially. The main advantage of the Mitsubishi and Kennecott technologies is the continuous and uniform production of effluent gas high in SO2
concentration, which permits efficient collection of the gas for SO2 removal.
2.1.7 Mitsubishi Process
Beginning in the late 1960’s Mitsubishi began development of a multi-furnace continuous smelting, converting and slag cleaning process. The process involves the continuous and coordinated operation of three furnaces arranged in a cascading orientation to allow gravity transfer of molten materials in heated launders.
The Mitsubishi process (Figure 2.1.4) is comprised of three interconnected furnaces, the Smelting furnace (S-furnace), Slag Cleaning furnace (CL-furnace) and Converting furnace (C-furnace), which can produce blister copper continuously from concentrates. In the circular S-furnace, feed materials of copper concentrate, flux and in-plant reverts, are charged through multiple top blowing consumable lances, together with oxygen-enriched air, into the matte phase inside the furnace.
Figure 2.1.4: Mitsubishi Process (Shibasaki and Kanamori, 1989)
The high-grade (60-65% Cu) matte and slag produced are transferred through a launder to an electric slag-cleaning furnace, where the matte settles and the discard slag (0.5% Cu) overflows to a granulation system. The matte from the slag-cleaning furnace is siphoned
out of the unit for transfer through another launder to the converting furnace. The circular converting furnace continuously oxidises the matte to produce blister copper, by-product slag and SO2 gas. Consumable lances installed through the roof of the converting unit introduce
oxygen-enriched air (35-40% O2) and limestone flux to the matte for conversion to blister.
The C-slag that overflows from the C-furnace contains about 10-15% copper and is water granulated, dried and recycled to the S-furnace to recover its copper content. At the same time, the blister copper produced contains about 0.6-0.7% sulphur and is continuously siphoned from the C-furnace and forwarded to one of several anode furnaces using switching launders that divert the flow of blister to any anode furnace at will. The off-gas is withdrawn through a flue where it is treated prior to release.
In the Mitsubishi process, the matte flow-rate to the converting furnace is constant because the bath levels in the smelting and converting furnaces are fixed by overflow weirs and the matte production is governed by the concentrate feed rate.
The oxidant in the smelting and converting furnaces is oxygen-enriched air (26% O2
and 35-40% O2, respectively) and is blown onto the slag surface by 8-10 vertical
non-submerged lances (George, 2002).
One important pioneering aspect of the Mitsubishi process is the use of limestone flux, producing a basic calcium ferrite slag in the converting furnace. The major advantage of using calcium ferrite slag compared to iron silicate slag is the higher holding capacity of magnetite in the ferrite slag, which otherwise precipitates from iron silicate slag at continuous converting oxygen partial pressure. Precipitation of magnetite results in solid particle suspension in the slag which once settled out on the converter walls causes loss of furnace volume, increase in slag viscosity and entrained copper loss. A detailed discussion of magnetite behaviour in both iron silicate and calcium ferrite slag is given in Section 2.2.2. The adoption of limestone as flux was one of the major reasons that Mitsubishi succeeded in the development of continuous production method of copper. This slag also avoids foaming problems associated with iron silicate slag operating at the high partial pressure of oxygen necessary for the production of copper when using gas injection through lances. Unfortunately, the slag is highly corrosive to all commercial refractory bricks. This corrosion is exacerbated by the high degree of bath agitation induced by the multiple top-blowing lances. The fundamental problem with the highly agitated bath is the difficulty in maintaining
refractory protection on the water-cooled slag line. The low melting point and corrosive slag prevents formation of a suitable magnetite protection lining on the cooling elements.
Currently the Mitsubishi process is employed at the Kidd Creek Smelter, Naoshima Smelter, LG Metals in Korea (Onsan Smelter) and in Gresik, Indonesia (Gresik Smelter).
2.1.8 Kennecott/Outokumpu
Oy
Flash
Converting
Process
In contrast to a growing number of approaches for continuous converting using molten copper mattes, Kennecott developed a process for treating solidified matte. Kennecott Corporation’s primary motivation for the development and implementation of the Flash converting technology was to be able to abide by the rigid new sulphur dioxide gas emission laws in the state of Utah, USA, which the existing P-S converter at the smelter was failing to meet due to fugitive gas emissions and SO2 gas capture problems.
In 1979, Kennecott began development of a new concept for continuous copper converting known as Solid Matte Oxygen Converting or SMOC. The concept involves the deliberate solidification of copper matte followed by its conversion to copper metal by oxidation in a flash furnace.
In 1984 Kennecott and Outokumpu entered into a technology development and marketing agreement for SMOC and in 1991 Kennecott began the final phase of testing at Outokumpu to confirm the design of its new Utah Smelter using the technology. The first converting process at full industrial scale was put into operation in Kennecott Corporation’s Salt Lake City Plant in June 1995 and consisted of the Kennecott Flash Smelting and the Kennecott-Outokumpu Flash Converting technology (Figure 2.1.5).
Solid matte oxygen converting eliminates transfer of molten matte between furnaces and allows tight control of emissions, minimising fugitive gases and thus producing high-strength SO2 off-gases, which subsequently reduce off-gas handling requirements. Hot metal
cranes and ladles are also eliminated and independent operation of the smelting and converting furnace is possible, i.e. allows decoupling the smelting and converting processes as a result of being able to stockpile the solidified matte between the two furnaces.
Furthermore, since the furnaces can be operated independent of one another, the whole line does not have to be shut down when one furnace stops.
The molten high grade matte produced in the flash smelting furnace is led by means of covered launders to be solidified by cooling in ladles or pits or directly by granulation, where the matte is dispersed by means of high pressure water jets. The matte granules are ground by conventional techniques into a grain size of 80% less than 100 mesh, which is sufficient for complete reactions in the flash converting furnace (Hanniala et al., 1993). Once the matte feed is granulated, dried and ground it can be stockpiled or continuously charged to the flash converter.
The fine-grained matte and limestone flux are fed to a single burner on the reaction shaft of the flash converter where matte is oxidised to blister copper and calcium ferrite slag using pure oxygen or up to 70% oxygen enriched air. The slag composition is controlled to 18% Cu and 16% CaO (Hanniala et al., 1998). The copper content of the slag produced in the flash converting furnace is high but because of the small slag amount it can be fed back into the primary flash smelting furnace directly in the molten state or in granulated form. The slag can also be treated separately for copper recovery. Blister copper, containing 0.1-0.5% sulphur is laundered to the anode furnace for refining prior to casting (Newman et al., 1998). The converting furnaces also produce gas rich in SO2 and small gas volume due to the high
oxygen enrichment, making the process the cleanest in the world in terms of gas emission (George, 2002). The gas is continuously cooled and cleaned through gas scrubbers before passing to the sulphur recovery plant.
Figure 2.1.5: Kennecott-Outokumpu Flash Converting technology (Fahey, 2002)
2.2 THERMODYNAMIC DESCRIPTION
2.2.1 Physical Chemistry and Thermodynamics
The copper concentrate in the form of chalcopyrite, CuFeS2, contains approximately
36% copper, 25% iron and 27% sulphur with other minor metal impurities. Copper is extracted from the sulphide ore via three steps of matte smelting, converting to blister copper and anode refining. The following section briefly discusses the physical chemistry of matte smelting and then discusses in more detail the chemistry and thermodynamics of copper converting.
A)
Physical Chemistry of Smelting
The charge entering the smelting furnace can be represented as a Cu2S-FeS
concentrate. Matte smelting involves the oxidation of FeS in the charge to FeO at 1150-1250oC with little oxidation of Cu2S. The smelting process produces two liquid phases of slag