The University of Southern Mississippi The University of Southern Mississippi
The Aquila Digital Community
The Aquila Digital Community
Master's ThesesFall 12-1-2017
The Effects of Real-Time Visual Performance Feedback Using a
The Effects of Real-Time Visual Performance Feedback Using a
Tier Approach for Increasing Behavior Specific Praise on Teachers
Tier Approach for Increasing Behavior Specific Praise on Teachers
Elizabeth LownUniversity of Southern Mississippi
Follow this and additional works at: https://aquila.usm.edu/masters_theses Part of the Child Psychology Commons, and the School Psychology Commons
Recommended Citation Recommended Citation
Lown, Elizabeth, "The Effects of Real-Time Visual Performance Feedback Using a Tier Approach for Increasing Behavior Specific Praise on Teachers" (2017). Master's Theses. 594.
https://aquila.usm.edu/masters_theses/594
THE EFFECTS OF REAL-TIME VISUAL PERFORMANCE FEEDBACK USING A TIER APPROACH FOR INCREASING BEHAVIOR SPECIFIC PRAISE
ON TEACHERS by
Elizabeth Louise Lown
A Thesis
Submitted to the Graduate School, the College of Education & Human Sciences
and the School of Psychology at The University of Southern Mississippi in Partial Fulfillment of the Requirements for the Degree of Doctor of Philosophy
Approved by: Dr. Evan Dart Dr. Keith Radley Dr. Brad Dufrene Dr. Daniel Tingstrom ____________________ ____________________ ____________________ Dr. Evan Dart Committee Chair Dr. Joe Olmi Director of School Dr. Karen S. Coats
Dean of the Graduate School
COPYRIGHT BY
Elizabeth Louise Lown
2018
ABSTRACT
A number of studies have found behavior specific praise to be effective in increasing academically engaged behaviors and decreasing disruptive behaviors of students. The proposed study evaluated the effects of real-time visual performance feedback as a strategy for promoting teacher use of behavior specific praise. An ABCBC design was utilized to determine the efficacy of real time visual performance feedback in comparison to delayed visual performance feedback. The primary dependent variable measured was teacher use of behavior-specific praise. Additionally, student outcomes were assessed to determine the relationship between teacher use of behavior-specific praise and student behavior. The results from the study provide additional evidence that both immediate and delayed performance feedback via a wireless iPad device utilizing air-share was effective for increasing Head Start teachers’ use of BSP and decreasing the number of reprimands delivered.
ACKNOWLEDGMENTS
I would like to acknowledge my thesis committee chair, Dr. Keith Radley, as well as my other committee members, Dr. Brad Dufrene and Dr. Daniel Tingstrom. My committee chair and members deserve a very special recognition for all of their hard work, patience, and ample amount of support throughout my journey. I would also like to acknowledge and thank Lynda Hayes for her assistance in running my study as well as Jennifer Tannehill for assisting with data collection. Thank you all for believing in me and supporting my efforts to complete this project successfully
DEDICATION
There are many individuals I would like to thank for their unconditional support and faith in me throughout my graduate training. I would like to thank my parents, Jodie and Kenneth Lown, who have been there to encourage me to never give up even when times get hard, and to excel even when it seems impossible. Without their encompassing support I would not push for success. Secondly, I would like to thank my sister Lindzie Hale for her constant encouragement and support to be successful and confident in my work. I would also like to thank Morgan McCargo for pushing me to be the best version of myself during this grueling experience of graduate school. Her positive spirit and unconditional heart encourages me to be successful. Lastly, I would like to acknowledge those who have helped me collect data and finish this project successfully. Thank you Lynda Hayes for all your dedication and hard work and Jennifer Tannehill for your determination and punctuality. I wholeheartedly love and thank you all for your love and support while I achieve my goal and rise above.
TABLE OF CONTENTS
ABSTRACT ... ii
ACKNOWLEDGMENTS ... iii
DEDICATION ... iv
TABLE OF CONTENTS ... v
LIST OF TABLES ... viii
LIST OF ILLUSTRATIONS ... ix CHAPTER I – INTRODUCTION ... 1 Teacher Praise ... 3 Rates of Praise... 5 Outcomes of Praise ... 6 Behavioral Consultation... 8 Performance Feedback ... 11
Real Time Performance Feedback ... 15
Real-Time Visual Performance Feedback ... 19
Purpose ... 22
CHAPTER II- METHODS ... 23
Participants and Setting... 23
MotivAider ... 24
Wireless Screen Sharing Software (IPad) ... 24
Behavior Intervention Rating Scale (BIRS) ... 25
Consultation Acceptability and Satisfaction Scale (CASS)... 25
Dependent Measures and Data Collection Procedures ... 26
Experimental Design and Data Analysis ... 27
Procedures ... 28
Screening... 28
Baseline Phase A... 29
Teacher Training—Delayed Performance Feedback ... 29
Intervention Phase B: Delayed performance Feedback ... 30
Teacher Training—Visual Performance Feedback ... 30
Intervention Phase C: Real-Time Visual Performance Feedback... 31
Interobserver Agreement, Procedural Integrity, and Treatment Integrity ... 32
CHAPTER III – RESULTS ... 36
Teacher 1 ... 36
Teacher 2 ... 37
Teacher 3 ... 38
Social Validity ... 45
BIRS ... 45
CHAPTER IV- DISCUSSION ... 47
Research Questions ... 47
Research Question 1 and 2 ... 47
Limitations and Future Directions ... 49
LIST OF TABLES
Table 1 Tau-U Effect Size Calculations- Teacher 1: Rate of BSP and Reprimands…..42 Table 2 Tau-U Effect Size Calculations- Teacher 2: Rate of BSP and Reprimands…..43 Table 3 Tau-U Effect Size Calculations- Teacher 3: Rate of BSP and Reprimands…..43 Table 4 Tau-U Effect Size Calculations- Children’s Display of AEB and DB ……….44 Table 5 Tau-U Effect Size Calculations- Children’s Display of AEB and DB………..44 Table 6 Tau-U Effect Size Calculations- Children’s Display of AEB and DB………..45
LIST OF ILLUSTRATIONS
Figure 1. Teacher’s frequency of BSP and Reprimands……….……….40 Figure 2. Percentage of student’s display of appropriately engaged and disruptive
CHAPTER I – INTRODUCTION
Teachers of young children are given a very unique challenge to balance the assorted learning needs of multiple students while at the same time managing disruptive behaviors in the classroom (Darling-Hammond 2001; Montgomery & Rupp 2005.) Low levels of on-task behavior in young children can be a significant problem for teachers, resulting in a loss of instructional time, reduced academic time for students, increased disruptive behaviors, and have the potential for long-term effects on a child's academic performance (Dalton, 1999). Children’s early externalizing behavior problems, including defiance, aggression, hyperactivity, impulsivity and inattention, have a significant impact on a child’s learning readiness and transition into early school years (Webster-Stratton et al. 2008; McClelland et al. 2006; Denham 2006).
Problem behaviors are often identified as the main concern by early childhood educators (Conroy et al., 2002). Compared to older children, challenges associated with problem behavior are magnified in preschool populations, with preschool children of low socioeconomic status being at particular risk for a variety of social, emotional, and problem behaviors (Potijk et al., 2015). In particular, children who live among low-income families, have parents with minimal levels of education, were exposed to alcohol and drugs in utero, and are exposed to crime and violence are at risk for developing externalizing problem behaviors such as hyperactivity, impulsivity, aggression, or compulsivity that disrupts a child's day-to-day functioning (Korsh & Peterman, 2014). If challenging behaviors are not effectively managed from an early age, children aged three to six are more likely to experience peer rejection and negative family interactions (Coie
& Dodge 1998), be disciplined by school professionals (Strain et al. 1983), and experience school failure and dropout rates (Kazdin, 2011).
Therefore, it is essential that efficient and effective behavior supports—capable of addressing both student behaviors and teacher requirements of efficiency—be
investigated (Carter & Van Norman, 2010). Strategies that may meet these requirements, such as positive behavior management strategies (e.g., use of praise), may be
accomplished through the use of School-Wide Positive Behavioral Interventions and Supports System (SWPBS/PBIS). Sugai and Horner (2002) defined SWPBS as a universal framework for establishing behavior supports and social culture needs for schools to advance in effective teaching techniques and learning environments for all students. PBIS principles include preventative and responsive approaches that are implemented by promoting positive reinforcement and the use of data to drive decision making. PBIS is an important tool to help improve student outcomes behaviorally and academically, as well as increase instructional time and teacher effectiveness (Positive Behavioral Interventions & Support [PBIS], 2017). PBIS also includes fostering students' positive relationships, interactions with adults and peers, teaching and operationally defining teaching behavioral classroom expectation's during instruction time, and providing students feedback on appropriate social skill techniques (Benedict, 2007) Implementing a PBIS system includes three levels of support: Tier 1 (Primary), Tier 2 (Secondary), and Tier 3 (Tertiary).
Tier 1 interventions focus on the school environment. Tier 1 is used as a system-wide intervention to assist teachers in promoting appropriate classroom behaviors and expectations in order to reduce office discipline referrals for minor problem behaviors,
and document the occurrence of target behaviors to monitor which children need more intensive interventions (PBIS, 2017). Examples of Tier 1 classroom expectations are "Be Safe. Be Responsible. Be Respectful," referred to as the "Three B's" (PBIS, 2017). Tier 2 implementation involves providing additional support services to students' whose
behaviors need further assistance due to the lack of responsiveness to Tier 1 systemwide interventions. Examples of Tier 2 interventions consist of Check-in/Check-out (CICO) and small group social skills (Horner, Sugai, & Anderson, 2010). Students who are not responsive to Tier 2 interventions will require additional support involving a Tier 3 approach. Tier 3 supports target students who require more intensive and individualized services to reduce problem behaviors. Tier 3 interventions typically begin with school personnel conducting a functional behavior assessment (FBA) to allow personnel to identify environmental variables that may be influencing the target child's inappropriate classroom behaviors (Horner, 2010). With this in mind, the three tiers of PBIS are used to promote positive reinforcement, reinforce appropriate behaviors and help provide a support system for children in need to help reduce the risk of problem behaviors and increase the child's ability to learn.
Teacher Praise
In order to successfully implement PBIS in schools, the use of appropriate delivery of praise is integral (Caldarella, 2011). Praise is a common universal Tier 1 intervention with an emphasis on how the effects of teacher quality influence a child’s behavioral and academic performance. Praise can be defined as verbal and/or nonverbal attention directed toward a behavior or characteristic of the target child (Jenkins et al., 2015). Operational definitions of praise in the literature include the following: “To
commend the worth of or to express approval or admiration” (Brophy, 1981, p.5); “Verbal or physical behaviors indicating the positive quality of a behavior over and above the evaluation of accuracy” and “Any verbal statement or gesture indicating teacher approval of a desired student behavior” (Kalis, Vannest, & Parker, 2007, p. 22).
A simple behavior, teacher praise has been shown to encourage appropriate student behavior (Austin & Soeda, 2008). Specifically, the delivery of praise may
function as a reinforcer for students (Catania et al., 2009). The effectiveness of praise and positive reinforcement implies that a consequence (in this case, praise) that immediately follows a behavior results in strengthening that behavior. In the future, that person (e.g., the child) is more likely to engage in that specific behavior that has previously resulted in praise (Alberto & Troutman, 2008; Kerr & Nelson, 2010). Praise may gain its reinforcing power over time from repeated pairings with other natural reinforcers, including
contingent attention and rewards (Owen & Heyman, 2012). In addition to immediately following the behavior, the delivery of praise is thought to be more effective when the teacher delivers praise in close proximity to the child (Brophy, 1981).
Praise may be divided into two types: general and behavior specific. Behavior specific praise (BSP) is defined as statements that deliver positive verbal feedback for a specific behavior (Brophy, 1981; Floress & Jenkins, 2015; Jenkins et al., 2015). BSP statements involve describing and praising a specific behavior (e.g., “Zoe, nice job sitting in your seat while doing your work”), while general praise statements look at using non-descriptive praise (e.g., “Nice Job”). Research further supports the use of BSP over general praise. Researchers have found teachers of elementary-aged students who use
speaking) can have a significant impact on their students’ achievement scores through sixth grade (Konsantopoulos & Chung, 2011). Therefore, experience with one highly trained teacher who provides behavior specific praise statements may benefit an individual student or students for many years (Sweigart, 2015).
Rates of Praise
Whether behavior specific or general, praise is easy and inexpensive to deliver (Brophy, 1981; Jenkins et al., 2015; White, 1975). White’s first published study in 1975 evaluated the natural rates of delivering verbal praise for grades 1 through 12. White analyzed eleven studies and summarized the rate of verbal or encouragement praise statements across 104 teachers in a series of 16 studies. White found a substantial decreasing trend in early elementary to high school teacher’s usage of praise
statements—44 praise statements per hour for early elementary and 8 praise statements per hour for high school students. Like White, many other researchers evaluated the delivery of praise statements in the classroom. In more recent literature conducted by Burnett and Mandel (2010), they evaluated praise rates across teachers who taught grades 1 through 6 across four classrooms. They found that general praise rates to be 29 praise statements per hour, which was much higher than those rates reported by White (1975). Reinke and colleagues (2013) recently evaluated 33 kindergarten to third-grade teachers' rates of delivering praise and found that teachers delivered 25.8 praise statements per hour, which was similar to that documented by Burnett and Mandell (2010). Those results were similar to those reported by White (1975) elementary teacher's rate of 44 praise statements per hour. Floress and Jenkins (2015) also reported a rate of 38.5 general praise statements per hour which was much higher than Reinke et al (2013; 38 per hour
versus 26 per hour). Furthermore, Floress, Jenkins, and Reinke (2015) found that
teacher's rates of praise for grades 4 through 12 have not been reevaluated and are likely to show much lower rates of praise then ideal.
Outcomes of Praise
Teacher praise in the classroom has been a topic of empirical research since the 1970’s. The benefits of praise are particularly important because of the use of positive, proactive techniques promoted by PBIS systems that can be used in the classroom to prevent the occurrence of problem behaviors. Therefore, researchers have frequently examined ways to improve teachers’ use of delivering praise were in the classroom. Snider and colleagues (2002) studied how many students engaged in problem behaviors in the classroom and found that 25% of students engage in problem behaviors while in the classroom. Therefore, providing praise to reduce problem behavior may have a dramatic effect on overall classroom behavior and climate. In one example of a study evaluating the effect of praise on student behavior, Blaze and colleagues (2014) evaluated the effect of praise on student behavior by comparing the effects of teacher’s rate of loud versus quiet praise on students AEB and DB. The participants of this study consisted of four high school classrooms and teachers. The primary dependent variable was students academically engaged behavior (AEB). The secondary dependent variable consisted of tracking students’ disruptive behavior (DB). A multiple baseline design comparing A-baseline, B-loud praise, and C-quiet praise across four classrooms was used to assess the treatment effects. Classrooms 1 and 2 sequence of treatment phases was ABCAC, and classrooms 3 and 4 sequence of treatment phases was ACBAB. The results of the study
increasing students AEB and decreasing DB. Based on these findings, there is a strong need for interventions and strategies that will promote an increase in teachers’ use of praise in classroom settings (Pinter, East, & Thrush, 2015). Several strategies have been investigated as a means of increasing praise, with many centered on consultation with teachers and delivery of performance feedback (PF).
Another study by Burnett and Mandel (2010) focused on students’ and teachers’ perceptions and usage of praise and feedback in the classroom. Fifty-six students (e.g., 64% boys, 46% girls) in grades 1 to 6 (aged 6 to 12) were selected as participants in the study, Twenty-seven of the students participated in group interviews among peers with similar ages, and the remaining 27 students participated in single group interviews. The student’s perspectives of effective types of praise indicated that the younger students in grades 1 and 2 preferred to be praised for displaying “good behavior." The third-grade students preferred praise for homework completion, trying their hardest, and maintaining positive attitudes. The fifth-grade students preferred to be praised for goal achievements, task completion, and determination. Students continuously indicated that praise was motivating, and made them self-gratification. The results of the study showed that 89% of the feedback that was observed was positive with the
remaining 11% as negative. Positive feedback for this study was delivered at an average rate of 40 praise statements per hour (i.e., less than 2 positive statements per hour, and 1 negative statement every 5 hours). Furthermore, this study showed that the participants as a whole had a preference for effort feedback over ability feedback. However, the young children had a stronger preference for ability feedback (i.e., “Your writing is super
versus publicly and loud. Behavioral Consultation
Behavioral consultation (BC; Bergan, 1977) is one example that is frequently used within school settings and may be applied to increase praise. BC is a form of indirect service delivery model that involves four stages: (1) problem
identification, (2) problem analysis, (3) plan implementation, and (4) problem evaluation (Erchul & Martens, 2012; Erchul & Sheridan, 2014). One common criticism of BC is that it relies too heavily on the verbal encounters between a teacher and the consultant with minimal guided practice (Witt, Gresham, & Noel, 1996). Therefore, to address this limitation, an extension to BC was designed to address this—a strategy is known as Direct Behavior Consultation (DBC).
Like BC, DBC utilizes the four-stage problem solving model. DBC differs from BC in that it emphasizes teaching behavior intervention skills to teachers via direct contact with the children during their classroom activities (Sterling-Turner, 2002). DBC includes the use of behavioral skills training (BST) including instruction, modeling, rehearsal, and feedback, which is used to train the consultee on intervention
implementation (Dufrene et al., 2012). Although DBC literature is still nascent, it
provides support for the procedure as a means of improving student and teacher outcomes (Dufrene et al., 2014; Dufrene et al., 2012; LaBrot, Pasqua, Dufrene, Brewer, & Goff, 2015; Nguyen, 2015; Taber, 2014; Zoder-Martell et al., 2014).
In an example of DBC for promoting teacher praise, Dufrene and colleagues (2012) tested the effects of DBC with the use of in situ training procedures on two early
Head Start teachers. The researchers sought to determine if using in situ training would increase teachers' usage of BSP and effective instruction delivery (EID) and decrease preschool students' disruptive behavior. In-situ training describes a procedure in which the consultant provides the teacher with immediate real-time verbal prompts and cues on when to deliver BSP to students who are actively engaging in appropriate classroom behaviors using a one-way FM radio. A multiple baseline design across teachers was utilized to test the effects of in situ training on teachers ‘rates of delivering praise. The primary dependent variables were teacher-delivered BSP, defined as any dependent specific labeled praise statements, general praise statements, or response-dependent physical praise. The results of this study indicated that prior to intervention, each teacher’s rate of delivering praise ranged between 0.3 to 1.1 per minute. During the intervention phase, following the implementation of in situ training, each teacher
substantially increased in the rate of delivering praise statements per minute (e.g. 0.9- 6.0). Overall three of the four teachers indicated that the direct training procedures were acceptable. A limitation to this study involves the cost restraints of the bug-in-the-ear technology used for in situ training. Due to financial restrictions experienced by many school districts, the bug-in-the-ear device might not be easily accessible. Therefore, other methods to prompt teacher’s during the implementation of an intervention strategy (e.g., live visual cuing) might be effective as well.
Like Dufrene and colleagues, LaBrot (2016) conducted a similar study evaluating the effects of DBC in situ training procedures on Head Start teacher's rates of delivering BSP along with teacher's rates of reprimands. Currently in situ DBC studies have mainly looked at student's level of disruptive behavior in regards to teacher's increasing use of
BSP statements, therefore LaBrot also sought to examine children displaying both disruptive behavior and appropriately engaged behavior for the purposes of this study. The participants of this study consisted of four head start and early head start teachers and students from four head start classrooms. Teachers were selected for this study if they engaged in delivering 0.5 or less BSP statements per minute during a 10-minute observation. Six children from each classroom were selected at random for observation purposes to avoid the collection of the individual child's data.
The results of this study showed that in-situ training was effective for increasing Head Start teachers use of BSP. LaBrot’s study showed that during BL, teachers rates of delivering BSP increased above baseline rates and maintained above the set criteria of 5 BSP statements per minute. This study is not without limitations. A limitation of this study involves the effectiveness of in-situ training to increase teachers use of BSP in the classrooms among different child populations (e.g., white children). Therefore, future research should replicate the current study to address this limitation. A second limitation to this study involves the rate at which reprimands were affected by the teacher's rate of delivering BSP. Future research is warranted to determine if in-situ training that targets BSP will also reduce teacher's delivery of reprimands using screening criteria.
Although both are often critical to intervention implementation, behavioral consultation and performance feedback occur at opposing ends of an intervention. As addressed in the prior section, behavioral consultation takes place prior to the
intervention; whereas, performance feedback is the response given to teachers following implementation, regarding intervention execution.
Performance Feedback
Although providing teachers with direct training procedures are effective methods for increasing treatment integrity, some teachers may need additional support systems for implementing an intervention accurately. One strategy that has been shown to effectively increase teacher treatment integrity is performance feedback (Codding, Feinberg, Dunn, & Pace, 2005). Providing teachers with performance feedback has also been shown as a highly effective intervention for improving teacher behavior (Duchaine et al., 2011; Myers et al., 2011; Scheeler, Congdon, & Stansbery, 2010). Performance feedback may be described as a follow-up method for intervention purposes, in which an observer guides an individual through “(a) review of data, (b) praise for correct implementation, (c) corrective feedback, and (d) addressing comments or questions” (Codding et al., 2005; p. 205). Performance feedback has been used in previous studies to address teacher behavior; for example, performance feedback has specifically been used to increase the use of positive feedback in multiple settings including elementary school inclusion and contained classrooms (Allday et al., 2012), middle school classrooms including self-contained and inclusion (Myers et al., 2011), and high school inclusion classrooms as well (Duchaine et al., 2011).
A study by Sutherland and colleagues (2000) evaluated the effect of observation feedback on teachers delivering BSP in a self-contained elementary class for children with emotional and behavior disorders (E/BD). Observations took place three days per week during social skills instruction. The intervention consisted of verbal feedback on the observed rate of BSP delivered, and the teacher was encouraged to meet a goal of
the mean of BSP increased from 1.3 to 6.7 per 15-minutes. The percentage of time that students were on task was observed to increase from 48.7% to 85.6% during the
intervention, decreased to 62.2% during withdrawal, and increased to 83.3% during the final intervention phase. It should be noted, however, that the study consisted of a limited sample and that results may not be generalizable to a wider population group of children. Therefore, extending this research on performance feedback to increase BSP with general education teachers across head start centers (aged 3-5) is warranted.
A study by Kaufman (2013) compared the effects of providing direct (verbal PF) versus indirect (Written PF) methods to improve preschool and kindergarten teacher’s treatment integrity of behavior support plans. The participants in this study consisted of four teacher-student dyads. The study was conducted in the preschool of a private elementary school. Two teachers taught kindergartens classrooms, while the remaining two taught prekindergarten classrooms. This study focused on two main dependent variables involving treatment integrity and treatment effectiveness by using a combined multiple baseline and multiple treatment design across four dyads with order
counterbalanced conditions (Kaufman,2013). Treatment integrity in the study was operationally defined as the percentage of correct intervention implementations. Observations were conducted during 30-min observations twice a week to measure treatment integrity. Treatment effectiveness was defined as students exhibiting change in the target areas through weekly observations by conducting 15-min, partial interval recording with 15-s intervals, for 60 intervals total. Verbal PF was provided by the consultant. The consultant held twice a week early morning meetings in the classroom prior to the student’s arrival. The elements of verbal PF were identical to those of written
PF that included (a) praise for completing specific components of the intervention correctly, (b) providing corrective feedback on parts of the intervention that were implemented incorrectly, and (c) verbal review of all the intervention steps. Written PF was delivered to the first teacher who exhibited the lowest average of treatment integrity during implementation baseline. The written PF consisted of a typed word document the was printed and left in a designated folder for the teacher twice a week. The teacher would receive the feedback prior to the arrival of the students on the following day. The elements of written PF were the same as the elements for verbal PF except for written PF, the teacher received a written review of the steps for the intervention instead of a verbal review. The results of this study confirmed that verbal PF resulted in more immediate level changes in treatment integrity as well as student performance increased in relation to increases in treatment integrity across all student-teacher dyads and four of the five target student’s behaviors. This study did have several limitations that are important to note, such as the small number of dyads evaluated—resulting in unknown
generalizability. An approach that can be utilized to provide differential support can be by evaluating feedback doses (e.g. daily, weekly, monthly) according to how accurate the intervention is implemented (e.g., modeling, prompting in-vivo) depending on the skill inquired (Barnett et al., 2011).
Other studies have also evaluated more indirect forms of performance feedback to teachers. Rathel, Drasgrow, and Christle (2008) conducted a study investigating the effects of supervisor performance feedback on increasing preservice teacher's rates of positive and negative communication behaviors with students who have emotional and behavioral disorders and the effects of the intervention on classroom
management. Rathel and colleagues used single-subject multiple baseline procedures across two pre-service teachers enrolled in graduate studies working on a master's degree in special education. Both teachers displayed negative rates of communication with their students. Teacher one taught grades first to fifth within a special education classroom for students with EBD. Teacher two taught grades second to fourth-grade level students. The primary dependent variables consisted of the frequency of pre-service teachers positive and negative non-verbal and verbal communication behaviors, classroom interactions and student behaviors.
Positive teacher communication behaviors were defined as any verbal statement and/or nonverbal behavior such as providing behavior specific praise for student academic behaviors and social behaviors, non-behavior specific praise statements and nonverbal approval of student behavior. Negative teacher communication was
defined as any verbal or nonverbal behaviors that expressed disapproval of the students social and academic behaviors such as verbal teacher corrections and non-disapproval of student behaviors. The participants were initially trained and provided with operational definitions as well as positive and negative feedback. After they were provided with feedback, the teachers were shown their baseline rates of feedback. The performance feedback condition consisted of the observer sending an email after each observation the same day to the teacher. The follow-up email consisted of a greeting, corrective feedback, praise for correct implementation, and a statement offering to address questions the teacher has via email and/or in person. The results of this study showed that providing indirect (e.g., electronically via e-mail) performance feedback increased two pre-service teacher's frequency of non-verbal and verbal positive communication behaviors and
decreased the number or non-verbal and verbal negative communication behaviors towards students. A limitation of this study that is important to address is that researchers did not collect any treatment fidelity data for various points in time (i.e., delayed pf, and real-time pf).
Real Time Performance Feedback
The goal of providing effective feedback is to decrease errors performed in the classroom by teachers as well as aid in the facilitation of instructional practice and theoretical development (Bangert-Drowns, 1991). A growing question of interest in current literature is the effect of timing for performance feedback. To further explore this growing interest, the current literature identifies various methods for delivering PF, such as immediate PF and delayed PF. Immediate PF describes the provision of feedback immediately following a behavior or observation. Delayed feedback describes a procedure in which feedback is withheld until a later time (e.g., end of the day, the following day). To further explore these two-time delivery methods, a study conducted by Scheeler, McAfee, Ruhl, and Lee (2006) evaluated the effects of immediate
performance feedback. Scheeler and colleagues (2006) proposed that during teacher preparation, most supervisory feedback is postponed. As a result, learners are being allowed to perform skills incorrectly and the deliverance of immediate feedback potentially interrupts poor performance. Therefore, the focus of their study was to examine the effects of immediate, corrective feedback on specific teaching behaviors via wireless technology contingent on the completion of three-term contingency trials. The three-term contingency trials consisted of basic units of instruction (i.e., Antecedent, Response, Consequence) in which students could learn new behaviors through
opportunities to respond and receive feedback based on the accuracy of their responses (Axelrod & Hall, 1999). The participants chosen for the study included five preservice special education teachers working on academic skills with students with special
education classifications. The three dependent measures examined in this study consisted of (a) teacher’s percentage of completed three-term contingency trials, (b) student’s percentage of correct responses per session, and (c) level of satisfaction with feedback provided by BITE (Bug-in-the-ear; personal FM system) and acclimation to using the device. During baseline, the percentage of completion ranged from 30 to 92%. With immediate feedback, all five of the participant teachers reached their criterion level with 90% completion. Overall, the mean percentage found in the study for correct student responses increased from 3 to 17 percentage points from baseline to intervention. All five teacher participants acknowledged that receiving immediate, corrective feedback using the BITE was non-distracting to their students as well as themselves. They rated the usage of the BITE as a convenient tool for enhancing their teaching performance. This research indicates that providing immediate, corrective feedback via technology can result in the correct practice of teaching behavior paired with positive results on students' academic performance and limited disruption for both students and teachers (Scheeler, 2002).
Similar to Scheeler, Codding and colleagues (2006) examined the effects of immediate performance feedback for implementing behavior support plans across two special education classrooms. The purpose of the current study was to examine the effects of performance feedback on special education teacher's usage of antecedent and
performance feedback on the same day as the observation or every other week, and identifying short-term maintenance effects on performance feedback. The students in the current study were male students aged 10-19 years old with a brain injury who
demonstrated significant problem behaviors in the classroom. Three of the students had non-traumatic brain injuries, and 2 students were diagnosed with a traumatic brain injury. Observational data were collected across two special education classrooms on a total of 5 teacher-student dyads. The results of this study revealed that accurate implementation of ongoing behavior support plans and treatment integrity of antecedent components improved for 4 of the 5 student-teacher dyads following the usage of immediate performance feedback. The results also showed an increase in the use of consequent procedures across all 5 teachers. The usage of providing immediate performance feedback for increasing treatment integrity and the implementation of behavior support plans were maintained up to 15 weeks after the completion of the study.
A similar study investigating immediate feedback by Price and colleagues (2002) focused on feedback delivery via an FM headset both immediately and following a delay to assess the effects of teacher praise on inappropriate vocalizations on a middle school child. The results of this study indicated that when delayed corrective feedback was provided via headset to the child paired with specific praise, his inappropriate vocalizations decreased, but when immediate corrective feedback was provided paired with specific praise via headset, the child’s output of inappropriate vocalizations decreased even more. Price and colleagues did note concern with using the FM system due to the training time required for teachers to get used to wearing the microphone and the potential aversive nature of immediate feedback delivered in this manner. Therefore,
using an alternative technology might be more efficient for delivering specific praise to students.
Although not specific to teacher praise, additional research has compared immediate and delayed performance feedback. Metcalfe, Kornell, and Finn (2009) compared delayed versus immediate feedback in sixth-grade children earning school-relevant vocabulary (Experiment 1). Participants in Experiment 1 consisted of 27 students enrolled in the sixth grade to determine which of the three feedback mechanisms (e.g., delayed, immediate, no feedback) showed a greater effect on each child's test
performance. Nine of the participant's data were excluded from the study due to multiple absences or because they accessed the program on their computers at times other than class times. The study assessed performance across 4 different phases (learning phase, initial test phase, feedback, and final test phase). The first phase (e.g., learning phase) involved the presentation of the 24 vocabulary words to each participant. Phase two (e.g., initial test) was conducted after the participant learned all 24 of the vocabulary words. Upon completing each test item entry, the items that were completed incorrectly were divided into three feedback conditions (e.g., delayed, immediate, and no feedback). The test entry items were displayed at random to each of the 3 conditions. The final phase (e.g., final test), involved a collection of all the test items assigned to the delayed test condition. The results of the data showed that whether or not the lag to test, delayed feedback did produce better performance in the final test than did immediate feedback. Additionally, the results indicated better performance when the researcher tested the 6th -grade children's learning school-vocabulary after feedback than having received no feedback. With college students learning the GRE-level words, results also showed that
delayed feedback produced better performance than immediate feedback when the lag to test was uncontrolled, but they did not find a difference between the delayed and
immediate condition when the lag was controlled. Performance feedback, displayed above, does have a significant impact on the timing in which it is delivered. A current line of research has extended the delivery of real-time feedback from auditory feedback to visual feedback.
Real-Time Visual Performance Feedback
Real-Time visual performance feedback (VPF) can be described as the delivery of visual feedback in vivo to teachers immediately following the occurrence or
non-occurrence of behavior. This method can be used with tools that are already available in most schools that have been shown to be cost-effective and efficient. For example, real-time VPF can be delivered using an iPad linked to a desktop computer to create a graph using screen-sharing software (e.g., Air-Display) to transmit a graph. Using this
technology allows an observer to update a graph of an individual's performance using the spreadsheet software on the computer while the individual would receive a copy of the graph on a second device (e.g., iPad) in real-time. This procedure may overcome previously noted concerns with real-time auditory feedback, which can potentially interrupt the flow of instruction delivery and distract teachers. Sweigart and colleagues (2015) evaluated the effect of timing of performance feedback as a question of interest, as researchers have discussed whether more immediate feedback could be provided using technology to prevent teachers from making errors (Scheeler et al., 2004).
Sweigart and colleagues (2015) study on the effects of real-time VPR using a screen sharing technology device was conducted across four general education middle
school teachers and their students using a multiple baseline design. Sweigart and
colleagues tested whether real-time VPF would effectively modify teacher behavior and their use of negative feedback, and assessed collateral effects on student's engagement and disruptive behaviors. The intervention design in this study was implemented across two phases (i.e., training phase, real-time VPF). The two phases were staggered across teacher participants in order to evaluate the effects of real-time VPF.
During baseline, teachers were asked to engage in their day to day practice as the observers coded behavior for 15 minutes of instructional time. Baseline continued until each teacher displayed stable responding. Training was received once teachers
demonstrated stability across three data points. Those without stable responding remained in baseline until stable responding was achieved. Following baseline, intervention phase I (training phase), scripted training on positive feedback was delivered to each teacher individually. The script consisted of (a) providing a definition for positive feedback; (b) describing how positive feedback operates on behavioral principles; (c) explaining the benefits of positive feedback; (e) sharing a minimum of five examples of positive feedback; and (f) providing an opportunity to ask questions. Once the teacher reached five days with stable data points (3), the teacher was moved onto the next phase. Phase II consisted of the researcher providing the teachers with real-time VPF on their use of positive feedback. VPF and the training phase were separated to eliminate its effects and controlling for the training. Before the occurrence of the first VPF session, the researcher gave a brief training on the intervention that included explaining real-time VPF, showing the bar graph display on an iPad of teacher performance, explaining and modeling how to use and interpret VPF on the iPad, and asking the teachers to use the iPad daily. In this
phase, the researcher provided real-time VPF to the teachers by displaying live updates on the total amount of positive feedback they were giving to their students during each session. Feedback was recorded using a Microsoft Excel workbook on a laptop computer device each time a teacher delivered positive feedback. A bar graph was wirelessly transmitted to an Apple iPad using the Air Display application which allowed the teacher immediate access to look at her performance.
The findings for the study indicated that training alone did not have a functional relationship with teacher behavior. Across all teacher participants, little gains in mean frequencies of positive feedback occurred from baseline to post-training conditions. The real-time VPF condition produced moderate to mixed effects. All teacher participants displayed immediate changes in level and trend in regards to real-time VPF, which suggested that real-time VPF may be an effective means for improving teacher's performance. This study had several limitations that may have affected the study's internal and external validity. Although real-time VPF was found to be effective, it was not compared to performance feedback as typically provided in educational settings. As such, it is unknown whether real-time VPF imparted any additional benefit beyond
standard performance feedback. Another limitation to this study was the high engagement levels and low levels of disruptive behaviors of target students, limiting the ability to document a functional relation and treatment effects. Future research should consider targeting classrooms where the percentage of disruptive behavior is high and the deliverance of positive praise is low. An additional limitation is that the study only included one teacher and one target student, limiting the generalizability of findings. Finally, no social validity data were collected as part of the study.
Purpose
The purpose of the current study was to compare the effects of real-time visual performance feedback to performance feedback delivered at the end of the observation period on teacher-delivered behavior specific praise and student behavior. The following research questions were generated to guide the study:
1. Does usage of real-time visual performance feedback result in increases in the frequency of behavior specific praise in preschool teachers?
2. Is implementation of real-time visual performance feedback associated with changes in the level of student academically engaged behavior?
3. Does usage of delayed visual performance feedback result in increases in the frequency of behavior specific praise in preschool school teachers?
4. Is implementation of delayed visual performance feedback associated with changes in the level of student academically engaged behavior?
5. Does real-time visual performance feedback result in greater improvements in praise and on-task behavior than delayed performance feedback?
6. What is the social validity of each of the performance feedback strategies, as rated by teachers?
CHAPTER II- METHODS Participants and Setting
Prior to conducting the proposed study, IRB approval was obtained from the affiliate university. The participants in the proposed study included four Head Start teachers and their respective classroom of children. Each Head Start classroom was part of an agency that operates multiple Head Start centers in a rural county in the
southeastern state. Teacher participants were recruited based on the Head Start center's administrative referral system for teacher's who are in need of classroom management training and/or classrooms with large numbers of children engaging in challenging behaviors. Those teachers who expressed interest were then referred to the primary researcher by a Center Director or by the teacher requesting assistance with classroom management. Consent was obtained from the Head Start/Early Head Start agency and the teachers prior to beginning data collection (See Appendix A and B). In the current study, one primary teacher was assigned to ABC (baseline, delayed VPF, immediate VPF) phase, and two primary teachers were assigned to ACB phase (baseline, immediate VPF, delayed VPF).
To be eligible for participation, each primary teacher was observed to deliver 10 or less BSP per minute during a 20-minute screening observation. Consultation services outside of the study were provided for the teachers that do not meet the necessary screening criterion. Teachers who met the screening criteria were provided detailed information to identify and operationally define the specific target behaviors as well as the setting and/or activity in which the disruptive behaviors most often occur. All
the most challenging (e.g., when disruptive behaviors occur most often).
Students
Although student behavior was not the primary focus of the study, six students from each classroom were observed in order to assess whether increased praise effects levels of student behavior. Participating students were preschool-aged (3-5 years-old) children. To protect the confidentially of students, no identifying information was collected on any one child; rather aggregated classroom behavior data was collected. Only data regarding observable academically engaged and disruptive behavior was monitored during observations.
Materials MotivAider
A MotivAider is a discrete electronic device that can be attached to clothing (e.g. belt loop and waistband) and serves as a tactile prompt (2-s vibration). This device can be programmed to vibrate on a random or fixed time schedule. The MotivAider was set to vibrate every 2 minutes on a fixed-interval schedule. The MotivAider was given to the primary teacher only to be placed on an article of clothing. The MotivAider served as a prompt for the teacher to deliver BSP to her students (i.e., 1 per minute).
Wireless Screen Sharing Software (IPad)
A wireless screen sharing iPad device utilized an app called “Air Display” (Sweigart, 2015) to provide teachers with a shared screen between the researcher and the participant. Air Display allowed the researcher to provide the teacher with immediate
word document was used to graph and display teacher frequencies of delivering BSP. The researcher provided an iPad to the teacher participant during intervention phases. The wireless iPad device was used for immediate real-time visual performance feedback as well as delayed visual performance feedback per participant.
Behavior Intervention Rating Scale (BIRS)
The BIRS (See Appendix D), Behavior Intervention Rating Scale (Elliot & Treuting, 1991) was used in this study to evaluate the primary teachers’ perception of the social validity of utilizing real-time and delayed visual performance feedback regarding the delivery of BSP as a behavioral intervention used for classroom management. The BIRS is a 24-item questionnaire ranging from 1 (strongly agree) to 6 (strongly disagree). The BIRS measures an individuals’ perception of treatment acceptability, effectiveness, and time to effectiveness (Elliot, 1991). Von Brock and Elliot (1991) calculated the alpha coefficients as .97 for the Total score, suggesting high overall internal consistency, .97 for Acceptability, .92 for Effectiveness, and .87 for Time of intervention implementation.
Consultation Acceptability and Satisfaction Scale (CASS)
The CASS (See Appendix C; Taber, 2014), Consultation Acceptability and Satisfaction Scale is a 12-item rating scale. The CASS is scored on a 6- point Likert-scale, with a score ranging from 0 (strongly disagree) to 5 (strongly agree). The CASS scale was used to evaluate each teacher's understanding of the acceptability,
appropriateness, and effectiveness of consultation procedures that was utilized. Higher scores on the CASS (i.e., 4 or 5) show high levels of acceptability and satisfaction with consultation practices.
Dependent Measures and Data Collection Procedures
The primary dependent variable for this study was the teachers' frequency of BSP. The secondary dependent variable is students’ percentage of academically engaged behavior (AEB). Teacher reprimands and student’s disruptive behavior (DB) were also coded. BSP was defined as any response-dependent, specific-labeled praise statement that includes a description of the behavior being praised (e.g., "Thank you for raising your hand quietly, Susie"). Teachers’ BSP was recorded using an event recording procedure in which the frequency of BSP statements within 10s intervals was recorded, and reported as a frequency of BSP statements per minute during 20-minute observation sessions. Reprimands were defined as any statements made directly to the student that involves asking the student to discontinue a particular behavior (e.g., “Stop running”, “Don’t say that word” telling a student he or she was punished (e.g., “I’m going to take that toy car away from you”), corrective statements (e.g., “You shouldn’t do that”), or any verbal statement that calls attention to disruptive behavior. The frequency of reprimands and DB were recorded in the same manner as student AEB.
AEB was defined as a student actively engaged (e.g., looking, manipulating objects) in a designated classroom activity with their eyes and body oriented toward the teacher or activity. DB included non-compliance, inappropriate vocalizations, out-of-area, and aggression. Specific disruptive behaviors were identified and operationally defined in collaboration with classroom teachers. AEB and DB were recorded using a 10-second momentary time sampling (MTS) method during 20-minute observation sessions (i.e., concurrent with coding for teacher BSP and reprimands). MTS was selected as the coding scheme because it has been found to provide a more accurate representation of
behavior than other coding schemes (e.g., partial interval; Radley, O’Handley, & LaBrot, 2015). At the end of each 10-second interval, the student was observed and it was noted whether they are engaged in AEB and DB. The observer then observed the next student in the same manner at the end of the next 10-second interval (i.e., individual-fixed; Dart, Radley, Briesch, Furlow, & Cavell, 2016). Observing students in a rotating manner continued until the 20-minute observation is complete. AEB and DB were reported as the percentage of intervals of occurrence.
Observations were conducted by the primary researcher and graduate student who were trained to code for multiple teacher behaviors as well as child behaviors. The primary researcher trained the secondary observer on each operational definitions and the coding schemes that were used in the study. Observers sat in the least intrusive part of the classroom. Using headphones, the observer listened to a data collection application announcing 10-second intervals that prompted a brief observation and immediate recording of the target child's behavior at the time of the observation.
Experimental Design and Data Analysis
An ABCBC design counterbalanced across 4 primary teachers was used to determine the effects of real-time visual performance feedback and delayed performance feedback on the teacher’s total count of delivering BSP and students AEB. In this design, each teacher serves both as his or her own control. Demonstration of a functional
relationship between real-time VPF and frequency of positive feedback occurred when: (a) a teacher demonstrates a stable level and trend of positive feedback prior to the introduction of the intervention; (b) an immediate change in level and trend of positive
feedback occurs when the intervention is introduced; and (c) teachers who have not yet received intervention continue to exhibit stable positive feedback. Data were collected during the following phases: phase A as the baseline, phase B represents delayed performance feedback, and C represents real-time visual performance feedback. Phase changes were made based on the visual analysis of level, trend, and stability of teacher’s frequency of BSP.
There was a minimum of 5 data points collected across all 5 phases in the current study. The immediacy of effects, data overlap across phases, and consistency of data patterns was also evaluated through the use of visual analysis (Horner et al., 2005). In addition to the visual analysis, Tau-U was calculated as a measure of intervention effect. Tau-U can test for a baseline trend in an undesired direction so that the trend can be corrected in the effect size calculation (Parker et al., 2011). The effect size range between 0 and 0.20 are small effects, 0.20 and 0.60 are moderate effects, 0.60 and 0.80 are large effects, and above 0.80 are considered very large effects (Vannest & Ninci, 2015). Tau-U scores were calculated across all phases individually to evaluate the relative effect size as well as weighted together for a combined effect score to evaluate the overall effects of delayed performance feedback and real-time performance feedback on teachers use of BSP statements across an extended period of time.
Procedures Screening
A screening observation was conducted to identify four teacher participants. The researcher instructed the teachers to manage their classrooms in their typical manner as well as use any reinforcement and consequent procedures that they normally use in their
classrooms. Screening observations were utilized to identify which teachers used BSP with the lowest frequency across settings. In order for the classrooms to screen into the current study, BSP had to occur at less than 10 BSP during the 20-minute screening observation. The codes used during the observations were the same protocols as
described in the measures section. For teachers that meet screening criteria, the researcher invited those teachers to participate in the research study. The teachers that meet the inclusion criteria did have that screening data point retained as their first baseline point. Baseline Phase A
During the baseline phase, teachers were not provided with any instructions or feedback regarding classroom management. Instead, teachers were instructed to manage student behavior using the strategies they typically utilize. Observers sat in an
unobtrusive location in the classroom, engaging in zero interactions with the children while observing both teacher and student behavior during 20 minutes of instruction time. The researcher, as well as the observers, did not provide any feedback regarding the students' performance or behavior management.
Teacher Training—Delayed Performance Feedback
Following baseline phase A, the primary researcher met with the teacher to provide behavior skills training (BST). The researcher explained that increased use of BSP has been shown to result in improved student behavior (e.g., LaBrot et al., 2015). The teacher was taught to interpret the graphical display of praise data. The researcher provided verbal examples of BSP such as (e.g., Jack, I love how raised your hand before speaking) as well as non-examples such as (e.g., Nice job). After the researcher provided the teacher with examples and non- examples of delivering BSP, the teacher provided 3
BSP examples and immediate feedback was provided. The researcher also explained the use of a motivator, what it is used for, and the importance of keeping the motivator in their possession for the duration of the observation. The researcher did not provide
teachers with any instruction or feedback regarding classroom management outside of the initial training sessions. If teachers met treatment integrity of 100% on the first session, teacher training was terminated. IOA was collected for 30% of teacher training.
Intervention Phase B: Delayed performance Feedback
Implementation of the delayed performance feedback phase took place after the teacher had been trained. This phase followed similar procedures as seen in baseline with the addition of providing performance feedback at the end of the day using a visual graph display shown on the iPad. This graph displayed updates on the total amount of BSP statements the teacher delivered during each session. Each time the teacher delivered BSP, the researcher recorded the feedback in a Microsoft Excel bar graph on a laptop computer. During this time the researcher conducted a frequency count on the amount of BSP, reprimands and student AEB and DB. At the conclusion of the observation, the researcher met with the teacher for 5 minutes to provide performance feedback via a visual graph display on the iPad showing the amounts of BSP delivered during the 20-minute observation session.
Teacher Training—Visual Performance Feedback
Prior to the first real-time visual performance feedback (VPF) session, a brief training session on the intervention was delivered to each teacher participant by the primary observer. The brief training session included: (a) describing the benefits of
performance feedback; (b) showing an example of a visual bar graph displaying BSP frequencies (c)modeling and describing how to use and interpret VPF on the iPad; (d) ask the teacher to keep the iPad in her hands for the duration of the observation, (e) explain the use of a motivator, what it is used for and to keep the motivator in the teachers possession for the duration of the observation and (f) provide time for teachers to ask questions. If teachers meet treatment integrity of 100 % on the first session, teacher training was terminated. IOA was collected for 30% of the teacher training.
Intervention Phase C: Real-Time Visual Performance Feedback
The researcher provided immediate real-time VPF to the teacher using the Microsoft excel bar graph on the Air Display application to give live updates on the total amount of BSP statements delivered during the observation period. The Microsoft excel bar graph was transferred wirelessly to an Apple iPad using the Air Display application. The air share application allows a user to mirror a computer display onto the Apple device using a wireless internet network connection. The Air Display was extended across the laptop screen the primary research is assessing as well as the teacher's iPad screen. This allowed the teachers to physically see the bar graph that included the amount of BSP statements delivered. Each time the teacher provides a BSP statement, the bar graph increased 1 value towards the goal line. BSP statements were displayed as a bar graph, with a dashed line plotted to indicate the target level of statements. The iPad that displays the air share device software remained in the teacher’s possession during the duration of the training. A motivator is also used to remind the teacher to use BSP every 2 minutes. During this time the researcher also conducted a frequency count on the amount of BSP delivered, as well as student AEB, DB, and teacher frequency of reprimands.
Interobserver Agreement, Procedural Integrity, and Treatment Integrity Interobserver agreement (IOA) was collected for a minimum of 20% of
observations per phase for each of the four participants. Agreement was calculated using an exact agreement method (Cooper, Heron, & Heward, 2007), by dividing the number of agreements by the total number of agreements and disagreements and multiplying by 100. The IOA criteria were set high, 90% agreement. All observers met 90% agreement with the primary researcher prior to the implementation of data collection for
intervention. The secondary observer was retrained until he or she met the appropriate criterion. Only data collected by the primary observer was reported for this particular study. Each observer sat in an unobtrusive location in the classroom while following up with the observation. All observers demonstrated 90% agreement with the primary researcher prior to data collection. If interobserver agreement (IOA) fell below 90% for any observation conducted, the observers were retrained until the 90% criterion was met. Only data collected by the primary observer was reported for this specific study. A screen sharing software device (Airshare) on the wireless iPad was used to cue data collection. Agreement for teacher use of BSP was calculated by dividing the number of agreed upon BSP statements within the intervals by the number of agreed and disagreed upon BSP statements and multiplying the quotient by 100. Agreement for teacher reprimands was calculated in an identical manner. Agreement for student AEB was calculated by identifying the number of agreed-upon intervals of student AEB divided by the total number of agreements and disagreements multiplied by 100. Agreement for student DB was calculated in an identical manner.
For Teacher 1, IOA was obtained for 40% of baseline observations, 40% of observations in the immediate performance feedback intervention phase, and 40% of observations for the delayed performance feedback intervention phase. IOA for BSP with Teacher 1 averaged 96% (range = 92.5 - 100%), reprimands averaged 98% (range = 98.33 – 100%), academically engaged behavior averaged 92% (range = 92.5 – 100%), and disruptive behavior averaged 93% (range = 95.17 – 100%).
For Teacher, 2 IOA was obtained for 40% of baseline observations, 40% of observations in the immediate performance feedback intervention phase, and 40% of observations for the delayed performance feedback intervention phase. IOA for BSP with Teacher 2 averaged 97% (range = 92.67 - 100%), reprimands averaged 98% (range: 97 – 100%), academically engaged behavior averaged 94% (range: 94.17 – 100%) and
disruptive behavior averaged 92% (93.67 – 100%).
For Teacher 3, IOA was obtained for 32% of baseline observations, 32% of observations in the immediate performance feedback intervention phase, and 32% of observations for the delayed performance feedback intervention phase. IOA for BSP with Teacher 3 averaged 94% (range = 91.67 - 100%), reprimands averaged 98% (range: 95 – 100%), academically engaged behavior averaged 96% (range: 91.67 – 100%), and disruptive behavior averaged 90% (range: 69.23 – 100%).
Kappa was calculated for AEB and DB using the formula outlined by Uebersax (1982). Kappa is used to determine the proportion of agreement between raters. Kappa values below 0 display “less than chance” agreements. Other kappa values ranging
between .41 and .60 show “moderate” agreement, and values ranging between .81 and .99 show “almost perfect” agreement (Viera and Garrett, 2005).
Teacher 1’s mean Kappa value was 0.87 (95% CI = 0.84 – 0.91). The strength of this agreement is considered to be very good between observers across AEB and DB. The mean Kappa value for Teacher 2 was 0.84 (95% CI = 0.79 – 0.88). The strength of this agreement is considered to be very good between observers across AEB and DB. Teacher 3’s mean Kappa value was 0.78 (95% CI = 0.71 – 0.80). The strength of this agreement is considered to be good between observers across both dependent measures (AEB and DB).
Procedural integrity was assessed using a checklist across both teacher training components during 100% of the training sessions. Procedural integrity was calculated by dividing the number of steps completed accurately by the total number of steps on the checklist and multiplying the quotient by 100. Teacher Training for Delayed Performance Feedback (see Appendix F) steps included: meeting with the teacher individually,
providing the teacher with BST, explaining BSP, providing examples and non-examples of BSP; and teaching the teacher how to interpret the visual graph display of praise statements delivered. Teacher training for Real-Time VPF (see Appendix G) included: meeting with the teacher individually, explaining the importance of checking the iPad regularly every 2 to 3 minutes, reminding the teacher to keep the iPad in their possession for the duration of the intervention, make sure the iPad Is turned on, computer excel graph is up and loaded, teacher is provided with a screen sharing “Air Share” device display on the iPad and demonstrate how to use/interpret the VPF excel graph on the iPad.
Treatment integrity was assessed during each observation using a checklist of indicated intervention steps. IOA for treatment integrity was calculated by dividing the
number of agreed-upon steps by the number of agreed upon plus disagreed upon steps and multiplying the quotient by 100. Treatment integrity IOA was collected for both intervention phases for at least 30% of sessions per phase. IOA for treatment integrity was calculated by dividing the number of agreed-upon steps by the number of agreed upon plus disagreed upon steps and multiplying the quotient by 100. The Delayed performance feedback Intervention (see Appendix H) consisted of the following steps: meeting with the researcher at the end of the day, the teacher received a printed visual graph display showing their frequency of BSP delivered at the end of the session, and the frequency in which the teacher delivered BSP. The Real-Time VPF Intervention (see Appendix I) consisted of the following steps: delivering immediate feedback to the teacher using the wireless air share device, iPad remains in the teacher's possession until completion of the observation period; (c) teacher checks the iPad regularly every 2 to 3 minutes, and teacher provides at or less than 10 BSP statements during the 20-minute observation. IOA for treatment integrity was collected for 38% of sessions for teachers 1 and 2 and 40% for teacher 3. IOA was 100% across all participants.
CHAPTER III – RESULTS
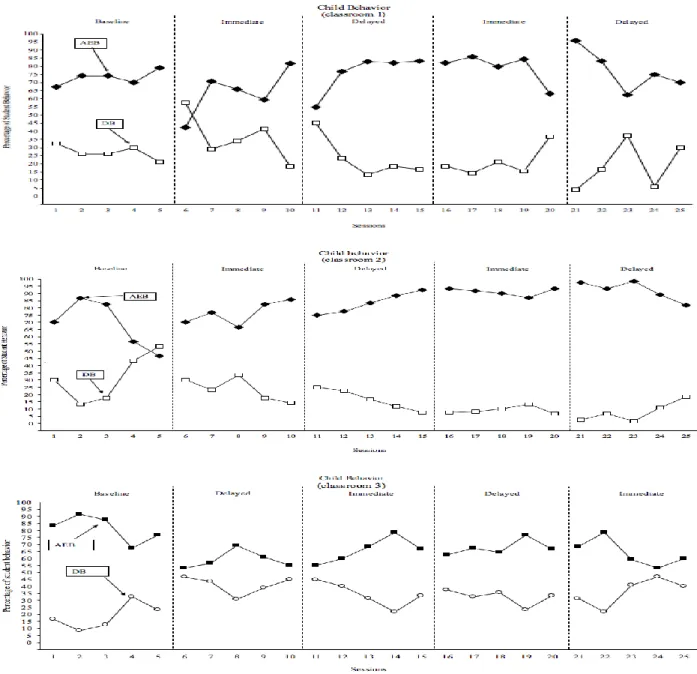
The frequencies for teacher BSP for immediate and delayed performance
feedback are displayed in Figure 1. The results for students AEB and DB are displayed in Figure 2.
Teacher 1
During baseline, Teacher 1 did not deliver BSP in the target setting (i.e., carpet time). The average frequency of reprimands delivered during baseline was 43.20 with a range of 26 – 69 (variable data with a decreasing trend). The mean percentage of children’s AEB and DB during baseline was also determined with an AEB mean of 73.01% (range: 68 – 79%) and DB mean of 27.11% (range: 21 – 32.5%) of observed intervals.
During phase 1 (immediate feedback), an immediate increase in the frequency of BSP was observed (M = 18.20%; range: 13 – 25%). There was an immediate decrease in the frequency of reprimands delivered in the immediate phase (M = 8.60%; range: 5 – 13%). An immediate decrease in children’s AEB (M = 64.01%; range: 42.5 – 81.67%) then increase in the data is shown and an immediate increase in DB followed by a decrease in trend (M = 36.17%; range: 18.33 – 57.5%).
During phase 2 (delayed feedback), Teacher 1’s frequency of delivering BSP (M = 23.40; range: 6 – 42%) immediate decreased but remained above the pre-determined set criterion (i.e., 1 BSP per minute) showing an overall increase. Reprimand’s delivered in phase 2 had a slight increase in data followed by slight variability (M = 4.60%; range: 0 – 13%). Upon analyzing children’s AEB, there is a decrease in the data followed by an increasing trend (M = 76.00%; range: 55 – 83.33%). For DB, there was an immediate