Introducing Complex Decision Models to the Decision Maker with Computer
Software – The Profile Distance Method (PDM)
Edward BERNROIDER
School of Management, University of London Egham, TW20 0EX, United Kingdom
and
Nikolaus OBWEGESER
Institute for Information Business, Vienna University of Economics and BA Vienna, 1090, Austria
and
Volker STIX (corresponding author)
Institute for Information Business, Vienna University of Economics and BA Augasse 2-6
Vienna, 1090, Austria [email protected]
ABSTRACT
In this paper we demonstrate how the profile distance method was transformed into a software environment enabling the decision maker to utilize a complex decision making tool without any advanced knowledge of the underlying mathematical and technical features. We present theoretical and technical aspects as well as contextual and usage related information from the viewpoint of the decision maker. Preliminary empirical results suggest that the developed software component is effective in terms of platform independence, usability and intuitive interface design. The data showed a good rating for usefulness, which, however, was targeted as the main goal for further development.
Keywords: decision making, profile distance method, knowledge transfer, usability
1. INTRODUCTION
The domain of decision making is a very broad area. There exists a plethora of theoretical decision making methods and methodologies as well as many different fields of application and roles of decision makers such as chief executive/information officers (CEO/CIO) or various business line managers [2,9,12]. Many decisions are made ad-hoc or based on often too simple methods with inefficient and ineffective results. Literature exists helping to assess the wide spectrum of methodical aids through taxonomies [7], classifications [6,8,10], and surveys of methods [11]. However, decision makers tend to avoid more complex models and stick to their common practice. Many enterprises justify their complex investment decisions on the basis of what could be called “acts of faith” [1]. As another consequence non-transparent choices are made which can not be defended or justified by the decision maker. More efficient decision making models are likely to become more complex and mathematically involving. It is therefore a matter of communicating the evaluated figures or results of complex models in a convenient way to the decision maker, so that he or she is confident in
using this information. In that way their decision process can be substantially supported and enables a transparent process for effective decision making supported by comprehensive and understandable justifications.
The aim of this paper is to explore usability and applicability of tool supported complex decision making based on operational research and multiple attributive decision making methodologies from the perspective of the decision maker. The paper envisions the decision maker as a manager without any advanced knowledge of the mathematical foundation of the respective decision making method. To support this direction, this paper seeks to
firstly present a rather complex decision making method that can be adapted for tool oriented easy to use decision making.
Secondly, we seek to illustrate the contextual setting and usage of the proposed software component to support decision making.
Thirdly, we describe the technical foundation central to the transformation of the decision making model into an easy-to-use software application.
And finally, we present preliminary empirical results demonstrating usability and applicability of the implemented solution.
We assume that the sub-process of selecting suitable attributes to define the respective solutions and assessing the values of these attributes for the competing products is completed. We concentrate on the decision process of selecting a product among a variety of competitors based on this information. Hence, we focus on the sub-process of actually ranking the alternatives and choosing one of them.
The remainder of this article is structured according to the above presented research objectives. In section 2 we present the theoretical background of the relevant decision aiding methods. Section 3 presents the decision problem from the decision maker's point of view, the interconnection with the underlying methods and the resulting implementation of a decision support tool. In Section 4 we present some of the technical aspects
central to our implementation. Section 5 summarizes the preliminary empirical results and Section 6 concludes our work.
2. METHODICAL BACKGROUND
We chose the recently published profile distance method (PDM) to support the investment decision with an advanced multiple attributive decision making model [2]. The PDM was designed to intuitively support a decision maker within a complex multi-dimensional decision. The PDM is a mixture of two prominent decision supporting methods namely the utility ranking method (URM) which is based on additive multi-attribute decision making (MADM) [12] and the data envelopment analysis (DEA) which was introduced in [5].
Utility ranking method
The URM uses weights determined by the decision maker to calculate a weighted sum which determines the overall ranking of each alternative. This is a very intuitive way to consolidate the multi-dimensions to one single super dimension and is therefore widely accepted and used. The main drawback of this method is the fact that the weights must be pre-set by (e.g.) the decision maker, which makes this method vulnerable to subjective judgement and bias.
Data envelopment analysis
DEA can be used to support decision making by calculating efficiency scores for each alternative and among other results provides weights for attributes with respect to every alternative [3, 4]. The weights, however, are gained using an optimization algorithm. This algorithm ensures that the weights for each alternative are optimally chosen so that the respective alternative is not worse (if possible) than its competitors using the same weights. In other words: Each alternative has the freedom to choose its weights and present itself to come off best. If it succeeds the alternative is called efficient. The moment an alternative does not reach a maximal level it becomes inefficient and one of the other alternatives is better although the weights were chosen to optimize the inefficient alternative. At the end there we can distinguish between efficient and in-efficient alternatives. The usage of the optimization algorithm makes this method absolutely objective. However, drawbacks are: The theoretical background which is mainly solving an linear program (LP) is more challenging as compared to the simple additive weighting process of the URM; the basic empirical intuition of experienced decision makers of how a “good” weight profile should look like is neglected; and finally with a low number of alternatives and maybe many attributes, the DEA is not able support ranking of alternatives [3].
Profile distance method
The PDM combines the advantages of both URM and DEA and gives the decision maker additional tolerance to decide [2]. The decision maker is enabled to compare his own assumption on how the weights should be (desired profile) with those generated by using the DEA method. The PDM provides the decision maker with a clear picture of structural differences between the desired profile and the automatically optimized profile (see Figure 1). Additionally, the decision maker is in charge of defining a fade factor that, step-by-step, forces the automated DEA profile to come more close to the desired profile (or even coincide with it). In other words, the decision
maker "tells" all alternatives what kind of weight profile would be considered good before they optimize their “promotion” weights. Using this method, the decision maker is given the possibility to find out about structural strengths and weaknesses of the alternatives in detail and comparing it with the company's needs.
3. THE VIEWPOINT OF THE DECISION MAKER
A decision maker normally does not know and even more important does not have to know about optimization techniques such as LPs. Therefore he or she can focus on the headlines, advantages and boundaries of decision models. In our case the decision maker should be aware of the following of the PDM:
It requires an investment decision
It requires describing attributes for this investment
It requires alternatives (competing products)
It requires the respective values for all alternatives for all defining attributes.
Additionally the decision maker may but does not have to suggest a set of weights assessing the relative importance of the describing attributes.
Consequently, within the PDM implementation in the implemented software program the decision maker enables each alternative to present itself best (using their preferred weighting scheme). The decision maker is free to compare this first impression within all alternatives. As a next step the decision maker may want to force the competitors to better comply with a desired weight profile which the decision maker assumes out of his or her experience or preferences. Within each step the decision maker is again able to compare the new presentation of the respective alternatives with the new constraints. This can proceed until the alternatives are forced to fully comply to the desired profile. The decision maker can fully explore the behaviour of each alternative on the way to be forced into the desired weighting profile. The software supports this explorative analysis intuitively. The decision maker is at no time confronted with technical aspects and the underlying complexity of the method, which are presented in the next section. He can, however, rely on a more sophisticated method as compared to simple ranking and scoring or other approaches.
How the user front end works
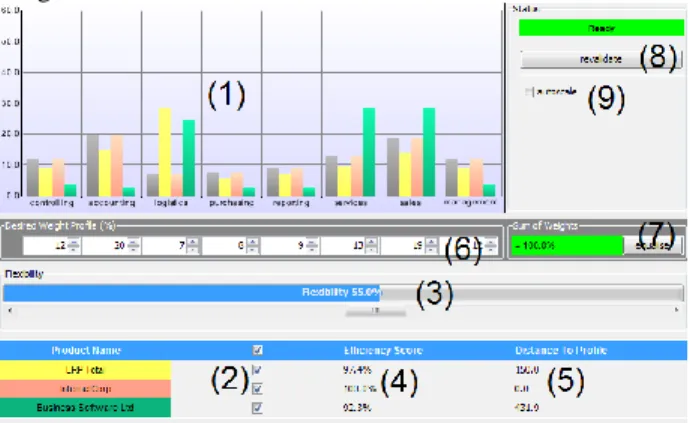
Figure 1 shows the only screen of the PDM implementation. On the main chart (1) the application displays the current weights. The desired weight profile is always present and displayed in grey (left most bar). The other coloured bars represent the chosen weights of the competing products and can be enabled through the check boxes below (2).
The alternatives are allowed to deviate from the desired profile set through the settings of the flexibility bar (3) which can be adjusted by the decision maker in real-time. A flexibility of 100% forces no compliance at all (resulting in a pure DEA calculation) and a flexibility of 0% forces total compliance with the desired profile (resulting in a pure URM calculation). Technical implications of that important component are given in the next section.
The total score for each alternative, bounded from above by 100%, is displayed at all times (also when the bar chart is inactive) in the table under "Efficiency Score" (4). The
remaining distance of the respective profiles to the desired profile is shown also given at this position (5).
The desired weight profile is pre-set in our example, but can be easily adjusted with the controllers below the chart (6). The button "Equalise" (7) sets all weights to an equal value. This is useful when no specific weight profile is known, so all attributes can be treated as equally important. After a change of weights, the problem needs to be revalidated (8) (see also next section).
Normally the scale of the bars stays constant enabling a smooth intuitive flow using the flexibility button. The auto scale function (9) allows to zoom in and out with the change of weight values.
Figure 1: Graphical User Interface 4. TECHNICAL DESIGN ISSUES Platform & Technology
In order to support the highest possible flexibility and portability the application was programmed using the Java Standard Edition(J2SE) development framework. With regards to the target audience of the application, viz. not only the scientific community but rather decision makers in firms, Java is not only the most widespread and common programming framework. Its advantages such as full portability (using JavaVM technology) and numerous community- as well as professionally-developed libraries helped in choosing the development framework.
Libraries
The application includes two free available libraries, Chart2D and Lp_solve. The libraries are used to enable charting and linear programming optimization, respectively. Since the foremost intention of the application development is not to build all parts from scratch but to provide an intuitive approach to decision support technology, the application makes use of the two subsequently specified libraries.
Chart2D: The Chart2D library is a fully Java written application programming interface (API) that provides a simple but intelligent approach to charting in Java. As can be seen using the PDM implementation, the usage of the Chart2D library is limited to the display of the main chart.
Lp_solve: Lp_solve is a community developed library and can be used under the restrictions of the LGPL (Lesser General Public License). This library enables the application to handle all optimization steps used in the context of DEA (Data Envelopment Analysis) and PDM (Profile Distance Method) optimization. In this special case the optimization relevant tasks are fairly limited as both methods
use a linear simplex approach. Furthermore, Lp_solve library is furthermore used to generate .lp (lp-file format) files to ensure portability and scalability of the optimization models to other solver implementations.
General Programming Aspects
The programming of the underlying application was done according to the proposed decision support method PDM as defined in [2]. The application was designed in use of standard Java software development guidelines with the free available NetBeans IDE 6.5 (Integrated Development Environment). Designing the graphical representation, major efforts have been put into making the user interface intuitive and easy-to-use (see Figure 1). The intention was to give the application user all necessary information in an understandable way, that is to simplify technical terms, making use of charting and graphical support and minimizing the chance of misunderstandings.
Application Specific Challenges
Due to the complexity of the underlying optimization problem, the major tasks in development focused on generating correct and displayable results in real-time. Since the application does not only contain visual classes and frameworks but also a first implementation of the aforementioned PDM method, a considerable amount of programming resources was needed to ensure validity and in-time generation of optimization results. With this task, the integration the Lp_solve API provided a valuable benefit. All PDM relevant linear optimization was done by the community tested and stable Lp_solve library.
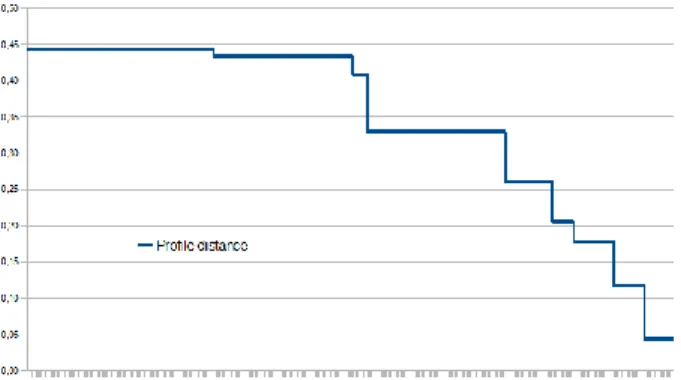
Transition Binary Search Algorithm: As stated in the PDM the decision maker is given the possibility to limit the freedom of the DEA based optimization results using a fade factor. We provide the decision maker with one of the main points of interest, namely the distance between the desired weight profile and the optimized profile when changing the flexibility fade factor. Due to the fact that solutions of an LP lie on the boundary, the transition points are not continuous and form a non-linear monotonically decreasing distribution (see Figure 2). In order to cope with this problem and hide this complexity from the decision maker the application includes a binary search algorithm that is designed to spotting the transition points in the profile distance distribution. The algorithm at first defines lower and upper bound for the search area, respectively zero (all freedom thus DEA) and a data dependent upper bound. At that point the distance of the optimized and the desired profile reaches zero (URM). Within the defined boundaries, the algorithm uses a modified binary tree search algorithm to explore intervals of changing profile distances with a limited significance of 1e-12. The steps of the green line in Figure 2 show the jumps of the profile distance of one alternative with decreasing flexibility. The distribution of the steps are not of any interest for the decision maker, therefore the frontend hides this complexity and presents a linear flexibility slide bare only. Since the transition points are different for each alternative the scroll bare contains the union of all points of all alternatives.
Figure 2: Non-linear distribution of profile distances with decreasing flexibility
In-Time Optimization: With the main focus lying on intuitive handling and usability, the graphical user interface of the application was designed to guide the user to an optimal decision. This is, the user should at all times fully understand the information shown and his possibilities to influence the decision making. On the one hand, by leaving the choice of the desired weight profile to the user, a higher level of identification with the decision to be made was reached. On the other hand, the application had to provide the ability to accomplish the optimization specific tasks, depending on the changing desired weight profile, in the background in real-time. This involves solving some hundreds of LPs (see next section). Although the optimization is done rather quickly with the data used, a workaround for this possible scalability problem was found using the following architecture: Once the user decides to change the desired weight profile, the status label of the application turns from [Ready] to [Please revalidate]. Revalidation is only made upon pressing the [Revalidate] button, so the user is allowed to test different weight profiles without having to wait for optimization at each change. When optimizing, the program always needs to optimize all alternatives with the union of transition points at the same time using the transition binary search algorithm, described beforehand. Using this architecture, the front end enables the user to slide the flexibility bar and to switch between competitors in real-time without any further calculation. This ensures usability and user-friendliness.
Algorithm Absolute Performance: The PDM implementation is designed as a distributed software package, therefore a huge spread in the distribution of optimization time arising from the inhomogeneous underlying computer systems can be assumed. On a reference system the application was tested on, the following performance average figures could be obtained using data drawn from a real case (3 alternatives with 8 attributes):
DEA optimization < 1msec,
PDM optimization < 1msec.
The binary search algorithm, as described above, achieved the following characteristics using the same data:
number of DEA optimizations: 3 LPs (attributes),
number of PDM optimizations (dependent on desired weight profile, average): ~300 LPs,
total calculation time ~100msec to ~500msec. Addressing the need of scalability and high performance for more complex decision problems, we are currently
investigating multiple techniques to explore the distribution of profile distances in an analytical manner.
5. EMPIRICAL ANALYSIS Design
Intending to gain preliminary insights into user acceptance and possible further improvements, feedback has been collected using the following survey design. The application was prepared with demonstration data, consisting of 3 competing ERP alternatives with 8 attributes. We invited decision makers from various backgrounds to test the product. The interviewee was given a one-page introduction on the specific problem, then was asked to use the PDM application with the help of a screen shot based guidance. Subsequently, the respondent was asked to fill out an on-line very short survey to capture the first impression. The PDM application was distributed as Java Web Start application, therefore no installation or set-up procedures were required and platform independence was assured.
Preliminary Findings
First results showed that 75% of all interviewees understood the terms and meanings used in the program very well. The application worked properly in all but one case, where a system-configuration specific error caused a problem. In 90% the Java Web Start distribution was found to be the appropriate technology, whereof in 60% it was found to be very good. The intuitive design and component placement within the PDM application was characterised as good to very good by over 80% of responses. Usefulness and practical convenience was found to be positive in all cases. 30% of all respondents classified this feature as “very high”, another 30% as “high” and 40% on the “medium” level.
Detailed comments and recommendations mainly affected the placement of components, the desired ability to sort the product list, textual representations, export functions for components and change behaviour of the desired profile. Some of the desired changes were already discussed before publishing the PDM application but discarded after intensive consideration.
6. CONCLUSION
In this paper we presented the basic foundation of the PDM and its transformation into a software environment enabling the decision maker to utilize a complex decision making tool without any knowledge of the underlying mathematical and technical features. The PDM was chosen as a complex decision making method that can be adapted for tool oriented easy to use decision making. The method draws on two prominent concepts known in operational research, namely the URM and DEA approaches. As a next step we illustrated the contextual setting and usage of the proposed software implementation from the perspective of the decision maker. The paper also presents technical features of the implementation.
In our view the developed software component can easily be applied to practical decision problems. The empirical investigation indicated that the current PDM implementation is effective in terms of platform independence, usability and intuitive interface design. By taking a more critical standpoint, we see good results in terms of usefulness but in relative terms this aspect was found on the last position compared to other features. We assume that one possible reason could be that the interviewees were dealing with an abstract demo setting and
were therefore not fully aware of plain circumstances of the decision. We will try to resolve this issue in a next evaluation step, by providing application specific data tailored for each participant. Next to further developing the application we will revise the empirical research instrument to be used in full blown empirical survey. On the theoretical side, we pinpoint the problem of defining a desired weighting profile ad-hoc. Therefore we seek to expand the methodology with the analytical hierarchical process (AHP) to find a way to intuitively assist the decision maker in his attempt to find a sound and consistent desired weighting profile.
7. REFERENCES
[1] J. L. Andresen. A Framework for Selecting an IT Evaluation Method in the Context of Construction, BYG-DTU, Technical University of Denmark, 2001.
[2] E. Bernroider and V. Stix, “Profile distance method
- a multi-attribute decision making approach for
information system investments”, Decision Support Systems, Vol. 42, No. 2, 2006, pp. 988-998.
[3] E. Bernroider and V. Stix, “On the Applicability of
Data Envelopment Analysis for Multiple Attribute Decision Making in the Context of Information System Appraisals”, Communications of the IIMA, Vol. 6, No. 2, 2006, pp. 107-118.
[4] D. Bouyssou, “Using DEA as a Tool for MCDM: Some Remarks”, Journal of the Operational Research Society, Vol. 50, No9, 1999, pp. 974-978.
[5] W. W. Cooper, L. M. Seiford, and K. Tone, Data Envelopment Analysis, London: Kluwer Academic Publishers, 2000.
[6] B. Farbey, F. Land, and D. Targett, How to assess your IT investment: A study of methods and practice, Oxford: Butterworth-Heinmann, 1993.
[7] Z. Irani, Investment justification of information systems: a focus on the evaluation of MRPII, Uxbridge: Technical report, Department of Manufactoring and Engineering Systems, Brunel University, 1998.
[8] D. L. Olsen, Decision Aids for Selection Problems, Series in operations research, New York: Springer, 1996. [9] T. Prato, "Multiple attribute decision analysis for ecosystem management”, Ecological Economics, Vol. 30, No. 2, 1999, pp. 207-222.
[10] J. Rainer and V. Stix, “IT Appraisal Methods and
Methodologies – a Critical Literature Review”, Proceedings of IRMA, 2004, pp. 37-40.
[11] P. G. Sassone, “Cost benefit analysis of
information systems: a survey of methodologies”, Proceedings of the ACM Conference on Supporting Group Work, 1988, pp. 126-133.
[12] K. P. Yoon and C.-L. Hwang, Multiple Attribute Decision Making: An Introduction, Sage University Paper series on Quantitative Applications, Thousand Oaks: Sage Publications, 1995.