Abstract— In the present work, a novel configuration of
distributed fan-pad evaporative cooling along with solar desiccation has been proposed for agricultural greenhouse application. In the proposed configuration solid desiccation along with solar regeneration has been used to dehumidify the air prior to the evaporative cooling pads to enhance its performance even under high ambient humidity condition. A thermal model of the proposed system has been developed, taking into consideration the transpiration phenomenon of target flora along with sensible heating of the greenhouse air. A computer code in ‘C’ language has been developed for the proposed model. The analysis has been done for the climatic condition of Kolkata, a place that witness a high temperature coupled with high humidity level for a considerable part of a year, especially during the monsoon. The study reveals that a signification amount of performance enhancement in terms of temperature reduction can be achieved using the proposed system over the distributed fan-pad ventilated system (without desiccant) throughout the year. Finally, an economical analysis has also been made to examine the economical feasibility of the proposed system for cultivating some target flora like Gerbera.
Index Terms—Desiccant evaporative cooling, distributed
fan-pad ventilation, greenhouse, economical analysis.
I. INTRODUCTION
EENHOUSE technology promotes cultivation of target plantation under a controlled environment. The greenhouse technology had emanated in the western countries of the world primarily to protect the plants from the extreme cold and frost. But in the plains of India, it is being practiced mainly to protect the plants from excessive heat from solar radiation, high temperature and humidity. So, the main objective of a greenhouse located in the plains of Indian subcontinent is the reduction of the inside temperature. The cooling can be achieved by using fan-pad evaporative cooling system. A conventional fan-pad ventilated greenhouse comprise of the induced draught fan(s) and cooling pads mounted on the opposite end walls while in a distributed fan-pad system, the fan(s) are installed at the top and the pads are mounted on the side walls of the
Manuscript received March 03, 2014; revised March 24, 2014.
P. Banik is a Post Graduate student in Mechanical Engineering Department at Indian Institute of Engineering Science and Technology Shibpur, India (e-mail: [email protected]).
Dr. A.Ganguly is working as Assistant Professor in Mechanical Engineering Department at Indian Institute of Engineering Science and Technology Shibpur India. (Corresponding author Ph- +91-33-26684561, Fax- +91-33-26682916 e-mail: [email protected]).
greenhouse. This distributed fan-pad configuration eliminates the problem of temperature gradient along the length of the greenhouse that is generally encountered in a conventional fan-pad ventilated system. But, it may be noted that the performance of all types of evaporative cooling systems depend heavily on the ambient humidity level. They fail to provide satisfactory results at high humidity levels. To enhance the cooling performance even under high ambient humidity condition, desiccant materials can be employed. The desiccant materials adsorb the moisture from the air and thus, the air gets dehumidified before its entry to the evaporative pads.
The objective of the present work is to develop a thermal model of a solar desiccant supported distributed fan-pad evaporative cooling system for greenhouse cultivation of Gerbera flower. Gerbera can be best grown at temperatures ranging between 23-27 ºC [1], which is difficult to be maintained in the open field especially during the hours of peak sunshine in summer season. Gerbera flower has wide demand in the domestic and international market. So, finally an economical analysis has been done to evaluate the payback period of the proposed system.
II. DESCRIPTION OF THE PROPOSED SYSTEM
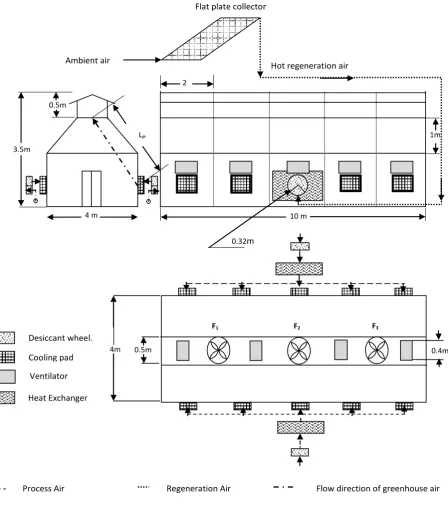
The schematic diagram of the proposed system is shown in the Fig.1. The system comprises of a ridge ventilated greenhouse (10m x 4m x 3.5m), oriented in east-west direction. Cellulose cooling pads are installed in the north and south walls of the greenhouse. The induced draught fans are mounted on the canopy of the greenhouse. This type of arrangement is called distributed fan-pad system as available in the literature [2]. In the present work, to further enhance the performance of the greenhouse under high ambient humidity condition, a desiccant wheel (made of silica-gel) and a heat exchanger are installed prior to the cooling pads at both north and south walls of the greenhouse. When the air flows through the desiccant wheel, it gets dehumidified, but its dry bulb temperature increases due to the heat of adsorption. Thus, to reduce its temperature, the air is passed through the heat exchanger, where water is used as the coolant. After passing through the heat exchanger, the cold and dehumidified air passes through the cooling pads, where further temperature reduction occurs due to evaporative cooling. The conditioned air then enters the greenhouse, where it absorbs the heat and gets vented out from the top under suction from the induced draught fans.
Thermal Modeling and Economical Analysis of
a Solar Desiccant Assisted Distributed Fan-Pad
Ventilated Greenhouse
P. Banik, A. Ganguly
For the regeneration of the desiccant materials, hot air derived from the solar flat plate collector(s) is allowed to pass through a portion of the desiccant wheel in the opposite direction to that of the process air.
The dehumidification process is mainly required during the summer, monsoon and autumn season, when the temperature and humidity of the ambient air remains moderate to high for a considerable period of time of the day. But during the winter season, both the temperature and relative humidity remains low.
Therefore, during the winter period (December, January and February), instead of passing the ambient air through the desiccant wheels, it is directly fed to the evaporative pads.
III. MODEL DEVELOPMENT
Following assumptions have been made while developing the thermal model:
i. The modeling has been done under steady state condition.
ii. The chemical dehumidification in the desiccant wheel is assumed to be adiabatic in nature.
iii. Water temperature in the heat exchanger is assumed to be equal to the wet bulb temperature corresponding to the atmospheric condition.
iv. No energy is absorbed by the structural elements of the proposed system.
v. The effects of pressure drop in the heat exchanger have been neglected.
0.4m 0.5m
4m
F1 F2 F3
1m
Flow direction of greenhouse air Process Air Regeneration Air
Ambient air
Hot regeneration air Flat plate collector
0.32m
3.5m
4 m
0.5m
2
10 m Le
Heat Exchanger
Desiccant wheel.
Cooling pad
[image:2.595.70.519.66.575.2]Ventilator
The greenhouse can be considered to be a solar heat collector or storage system, where both sensible and latent heat exchange takes place. The energy balance equation for the greenhouse considering the transpiration phenomenon of the target plantation can be given by:
E . T . K Q E . ) T T .( K T . U S s pad g s gi (1) Where, QKs.(TaTpad) In Eq. (1), the term ‘Sgi’ denotes the part of the incident
solar radiation that gets transmitted inside the greenhouse, while ‘U’ denotes the overall heat transfer coefficient of the greenhouse cladding material, whose value is considered to be 4.5 W/m2-K [3]. The term ‘∆T’ represents the
temperature difference between the ambient and greenhouse inside air. The term ‘Tg’ is the mean greenhouse
temperature, which is considered to be the average of the pad and the fan end temperature [2], while ‘λ’ represents the latent heat of vaporization of water, whose value is assumed to be 2.45 × 10⁶ [4]. The term ‘E’ denotes the canopy
transpiration (kg m-2 s-1).
The sensible heat transfer coefficient of the greenhouse air can be given by [4]:
g
g
pa a
s .C .ACM.V /60.A
K (2) Where, ‘ACM’ and ‘Vg’ denote the number of air
changes per minute and total volume of the greenhouse respectively. In the present work, the value of ‘ACM’ is considered to be 1.2 [2]. The term ‘Ag’ represents the floor
area of the greenhouse.
The greenhouse crop transpiration rate can also be deduced from the Penman-Monteith formula as given below [5]:
. .E H 2I.la. a.Cpa.Di/ra
/
.
1 rs/ra
E
.
(3)
In Eq. (3), ‘Ila’ denotes the leaf area index of the given
plant species. In the present work the value of ‘Ila’ is
assumed to be 3.5 [4], considering the plant to be Gerbera. The term ‘γ’ denotes the psychrometric constant. In Eq. (3), the term ‘H’ represents the sensible heat load of the greenhouse air, which can be represented as:
T . K Q
H s (4)
The slope of the water vapour saturation curve at a temperature, T (K) can be expressed as [4]:
5385/T2
2.2291011.exp(5385/T)
(5)
The water vapour pressure deficit of the greenhouse inside air can be given by [4]:
o
i . T e D
D (6) In Eq. (6), ‘∆e’ represents the water vapour pressure difference between the inside and the ambient air. The water vapour pressure deficit of the ambient air can be given by the following relation [4]:
o a * o e (T ) e
D (7) Where, the terms ‘e*(T
a)’ and ‘eo’ denote the saturated
water vapour pressure and actual water vapour pressure of the ambient air respectively.
The saturated water vapour pressure of the air at a temperature, T (K) can be given by [4]:
25.317 5144/T
exp ) T (
e* (8)
The stomatal resistance of the greenhouse plants can be given by the expression [4]:
1 1/exp0.05S 50
. 200
rs gi (9) The aerodynamic resistance, ra depends on the geometry
of the leaves as well as on the average speed of inside air, which can be expressed as [5]:
0.8
i 2 . 0 a 220.d /V
r (10) In Eq. (10), ‘Vi’ denotes the average air speed inside the
greenhouse, which has been calculated considering the greenhouse to be a parallelepiped, while ‘d’ represents the characteristic length of the leaf, whose value is assumed to be 0.025 m [4].
The greenhouse crop transpiration can also be given by [4]:
e . K E . L
(11) Where, the term ‘KL’ represents the latent heat transfer
coefficient, which can be given by [4]:
g
g
a
L . . .ACM.V /60.A
K (12) In Eq. (12), the term ‘ζ’ denotes the conversion factor between air moisture content at standard temperature and the air water vapour pressure. The value of ‘ζ’ has been considered to be 6.25×10⁻⁶ kg
w kga-1 Pa-1 [4].
Combining Eq. (6) and (11), we get:
o L
i . T .E/K D
D (13) Again combining the Eq. (3), (4) and (13) we get:
2 o L 1 s P / )} D K / E . T . .( P T . K . Q . E . . { E . (14) Considering, pa a la 1 2.I . .C
P and, P2 .(1rs/ra)
The term ‘λ.E’ can be removed from the Eq. (14) by combining Eq. (1) with Eq. (14). Therefore, after simplification, the equation for ‘∆T’ can be obtained as:
2 s a 1 2 a L 1 s 2 a L 1 gi 2 a o 1 P K . r . P P r . K P 1 . K U P r . K P 1 . Q S P r D . P Q .T (15)
Thus, the mean greenhouse temperature can be given by: T
T
Tg a (16) The temperature of the greenhouse air at the pad end depends on a number of processes. Those are, the chemical dehumidification at the desiccant wheels, sensible cooling at the heat exchanger and the evaporative cooling at the cooling pads.
The air temperature at the pad end can be represented as: )
T T .( T
Tpad hep he wbhe (17) In Eq. (17), ‘εp’ denotes the effectiveness of the cooling
pads, while ‘Twbhe’ represents the wet bulb temperature of
the effectiveness of the cooling pad is assumed to be 0.88 [2]. The term ‘The’ represents the temperature of air at the
exit of the heat exchanger, which can be given by: )
T T .( T
The dehe de water (18)
Where, ‘εhe’ is the effectiveness of the heat exchanger,
whose value is considered to be 0.8 [6]. The term ‘Twater’
denotes the temperature of water, which is assumed to be equal to the wet bulb temperature of the ambient air, while ‘Tde’ represents the temperature of air at the exit of the
desiccant wheel, which in turn can be estimated from the specific humidity of the air at the exit of the desiccant wheel, which in turn can be given by:
m / ma a de
(19) Where, ‘ωa’ represents the specific humidity of the
ambient air. The term, ‘m’ denotes the mass flow rate of the process air.
The rate of adsorption of the moisture (Kg/s) due to chemical dehumidification can be given by the following expression [7]:
. 3600 . L . A . m . a . . n . . D . 3600 . 2ma s s d e d d b
(20)
Where, ‘βs’ represents the fraction of the regeneration
area to the adsorption area of the desiccant wheel, whose value is assumed to be 0.215 [7]. The term, ‘n’ is the rotational speed of the wheel in RPH, which is considered to be equal to 12 [7]. The terms ‘ρd’ and ‘ρb’ represent the
density of the desiccant material and bulk density of the desiccant wheel respectively. In the present work the values of ‘ρb’ and ‘ρd’ are considered to be equal to 240 kg/m3 [8]
and 720 kg/m3 [9] respectively. The term ‘a’ denotes the
specific surface area of the desiccant material whose value is assumed to be 450 m2/g [7]. The term ‘A
d’ denotes the
cross sectional area of the desiccant wheel and ‘Ld’
represents the length of the desiccant wheel. In this work, the values of ‘Ad’ and ‘Ld’ are considered to be 0.08 m2 and
0.2 m respectively. In Eq. (20), the term ‘me’ represents the
equilibrium amount of moisture adsorbed by the desiccant materials, which in turn can be given by [7]:
1/1.5
e 0.24
m (21) Where, ‘φ’ denotes the relative humidity of the air, entering the desiccant wheel from the atmosphere.
The surface diffusion coefficient of the desiccant material can be expressed as [10]:
) RT / h ( exp 10 27 . 2
Ds 7 s (22) In Eq. (22), ‘hs’ represents the heat of adsorption. The
heat of adsorption for the silica-gel varies between 2100-2300 kJ/kg [7]. In the present work its value is considered to be 2300 kJ/kg. The term ‘T’ represents the temperature at which diffusion process occurs. In the present study, the average temperature of ambient and regeneration air is considered to estimate the diffusivity [7].
The temperature of the air at the exit of the regenerator, which is used for the regeneration of the desiccant material can be given by:
a pa r c p R
r F .A .S /(m .C ) T
T (23) In Eq. (23), ‘mr’ denotes the mass flow rate of the
regenerative air, while ‘Ap’ represents the area of the
absorber plate. The term ‘Sc’ denotes the solar flux absorbed
by the absorber plate, while ‘FR’ represents the collector
heat removal factor, which in turn can be given by [11]:
pa r p l p l pa r
R m .C
A . U . F exp 1 . A . U C . m
F (24)
In Eq. (24), ‘Ul’ is the overall heat transfer coefficient of
the collector, whose value is considered to be 5.08 W/m2-K
[11]. The term ‘F΄’ represents collector efficiency factor, which can be expressed as [11]:
f i o o ll. U . W d1 . d .d1.h
U . W
1
F (25)
In Eq. (25), ‘do’ and ‘di’ denote the outer and inner
diameter of the tube, through which the air flows and ‘η’ denotes the absorber plate efficiency. The term ‘hf’
represents the air to tube heat transfer coefficient, which can be given by [11]:
i a f Nu.k /D
h (26) Where, ‘ka’ denotes the thermal conductivity of air,
which is considered to be 0.0259 W/m-K [11]. The Nusselt Number can be expressed as [11]:
8 . 0 Re 0158 . 0
Nu (27) In Eq. (27), ‘Re’ is the Reynolds Number, which can be given by:
.V .d /
Re a avg i (28) In Eq. (28), ‘μ’ denotes the dynamic viscosity of air, whose value is considered to be 18.1×10⁻⁶ N-s/m2 [11]. The
term ‘Vavg’ denotes the average velocity of the air inside the
tube of the flat plate collector.
During regeneration, the water molecules diffuse out of the desiccant materials according to the same theory as discussed in Eq. (20) [7]. Therefore, as per literature [7], during the process of regeneration same amount of moisture will be ejected to the regenerative air.
For the economical analysis of the proposed system, a model for cumulative cash flow (CCF) has been developed, which can be given by:
1 f
.Cd 1 1 1 . d C d 1 1 1 . d C d 1 i 1 1 . i d C d 1 i 1 1 . i d E . C d 1 / 1 1 . d 1 . i 1 / 1 1 C . f. i d 1 i 1 1 . i d C CCF l n Labour n plant n m m m n e e c e n n l l l n y y y l l (29)
In Eq. (29), the term ‘Cy’ denotes the total revenue from
the flower yield per year; while ‘iy’ is the rate of increase
(%) of the flower cost per year. The term, ‘d’ represents the market discount rate, while ‘n’ denotes the service life of the proposed system. The terms ‘fl’ and ‘il’ denote the
respectively, while the terms ‘C’ and ‘nl’ represents the
capital cost and time required to pay back the loan respectively. The terms ‘Ce’, ‘Cm’, ‘Cplant’ and ‘Clabour’
represent the electricity cost, maintenance cost, plant associated cost and labour cost respectively (on the first year), while ‘ie’ and ‘im’ denote the increase in electricity
and maintenance cost per year; ‘Ec’ is the electricity
consumed by the system (kWh/year).
IV. RESULTS AND DISCUSSIONS
A computer code in C language has been developed for the thermal model presented in the earlier section. The model considers the hourly data for solar radiation intensity, ambient air temperature and the relative humidity as input parameters and predicts the average greenhouse temperature for a given degree of shading. In the present work, the weather data for Kolkata as available from R. M. C. Kolkata [12] have been used. The performance of the proposed system (in terms of the mean greenhouse temperature) has been compared with that of a distributed fan-pad ventilated greenhouse (without desiccant materials).
Figure 2 shows the hourly variation of ambient and average greenhouse air temperature for a representative day in summer (15th May). During the month of May, both the
intensity of solar radiation and the ambient air temperature remain high, while the humidity level remains moderate to high. From Fig. 2, it is evident that with the proposed system the maximum greenhouse temperature could be restricted within 26 ºC, when the corresponding ambient air temperature reaches about 34.5 ºC (with 61% RH). On the other hand, with the distributed fan-pad cooling system without desiccation, the maximum temperature reaches about 29 ºC.
5 6 7 8 9 10 11 12 13 14 15 16 17 18 19
24 26 28 30 32 34
5 6 7 8 9 10 11 12 13 14 15 16 17 18 19
0 200 400 600 800 1000
Ra
dia
tion Inte
ns
ity
(
W/m
2 )
Time of the day (hours)
Ig
RHambient
60 65 70 75 80 85 90
R
ela
tive humi
di
ty
(
%
)
T
emp
er
at
ur
e
(
C
) TambientTconventional
Tmodel
Fig. 2: Hourly variation of ambient and greenhouse air temperature on 15th May, 2009.
Therefore, it is evident from the figure that the conventional system fails to provide ideal temperature for Gerbera cultivation during the peak sunshine hours.
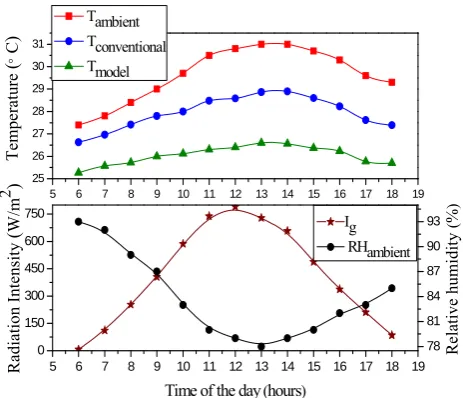
Figure 3 shows the hourly variation of ambient and greenhouse air temperature for a representative day in the rainy season (16th August, 2009).
5 6 7 8 9 10 11 12 13 14 15 16 17 18 19
25 26 27 28 29 30 31
5 6 7 8 9 10 11 12 13 14 15 16 17 18 19
0 150 300 450 600 750
Ra
dia
tion Inte
ns
ity
(
W/m
2 )
Time of the day (hours)
Ig
RHambient
78 81 84 87 90 93
R
ela
tive humidi
ty
(
%
)
T
emp
er
atu
re
(
C
) TambientTconventional
[image:5.595.312.544.48.247.2]Tmodel
Fig. 3: Hourly variation of ambient and greenhouse air temperature on 16th August, 2009.
[image:5.595.311.545.428.621.2]It is found that the distributed evaporative cooling system alone is able to reduce the greenhouse temperature marginally by around 2 ºC, while, the proposed system is able to reduce the same by about 4.5 ºC even during the hours of peak sunshine. Also as evident from the Fig. 3, for the daylong operation of the proposed system, the maximum greenhouse temperature reaches about 26.5 ºC when the ambient air temperature is 31 ºC (with 78% RH).
Figure 4 shows the hourly variation of ambient and greenhouse air temperature for a representative day in the autumn season (15th October, 2009).
5 6 7 8 9 10 11 12 13 14 15 16 17 18 19
22 24 26 28 30 32
5 6 7 8 9 10 11 12 13 14 15 16 17 18 19
0 150 300 450 600 750
Ra
dia
tio
n Inte
nsity
(
W/m
2 )
Time of the day (hours)
Ig
RHambient
60 65 70 75 80 85
Relati
ve humidity (
%)
T
emp
er
atu
re (
C
) Tambient
[image:5.595.51.286.462.654.2]Tconventional Tmodel
Fig. 4: Hourly variation of ambient and greenhouse air temperature on 15th October, 2009.
It is conspicuous from the figure that during the time of high ambient air temperature and moderate relative humidity (31.4 °C and 57% RH), the distributed evaporative cooling system alone is able to restrict the mean greenhouse temperature within 26 °C but at the same time the proposed system is able to restrict the same within 23 °C.
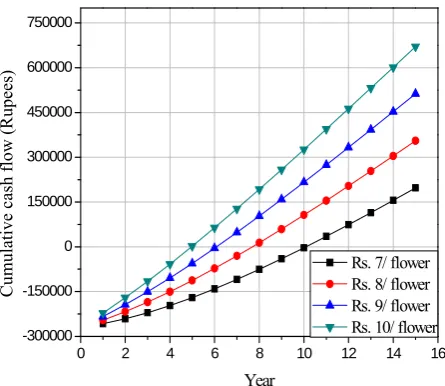
flower is generally sold at Rs. 10-12 per flower [13]. In the present analysis a lower price has also been considered to estimate the payback period of the system at that price range.
0 2 4 6 8 10 12 14 16
-300000 -150000 0 150000 300000 450000 600000 750000
Cumulative c
ash f
low (
Rupees)
Year
[image:6.595.50.273.102.295.2]Rs. 7/ flower Rs. 8/ flower Rs. 9/ flower Rs. 10/ flower
Fig. 5: Cumulative cash flow at various flower prices Figure 5 shows the variation of the cumulative cash flow with the year of operation (at various rates of flower price). From the Fig. 5, it is evident that at Rs. 10 per flower, the cumulative cash flow (CCF) becomes zero at about 5 years, which is the payback period of the system at that price range, while at Rs. 7 the payback period is about 10 years.
V. CONCLUSION
In the present wok a thermal model and a cumulative cash flow model have been presented for a solar desiccant supported distributed fan-pad ventilated greenhouse. From the analysis, it is revealed that the proposed system is able to maintain a lower temperature inside the greenhouse compared to that achieved through distributed evaporative cooling system. The economical analysis reveals that the payback period of the proposed system is about 5 years, considering the flower cost to be Rs. 10.
ACKNOWLEDGMENT
The authors sincerely acknowledge the Regional Meteorological Centre (RMC) Kolkata for providing the weather data for Kolkata, which has been used in the present work.
REFERENCES
[1] A. Kumar, Gerbera Manual, K F Bioplants Private Limited available
at www.kfbioplants.com (Accessed on 12.02.2014).
[2] D. Misra and S. Ghosh, “Thermal modeling of a ridge-ventilated
greenhouse equipped with longitudinally distributed evaporative
cooling pads”, International Journal of Emerging Technology and
Advanced Engineering, vol. 3, 2013, pp. 348-355.
[3] A. Ganguly and S. Ghosh, “Modeling and analysis of a fan–pad
ventilated floricultural greenhouse”, Energy and Buildings, vol. 39,
2007, pp. 1092–1097.
[4] B. Bauri and A. Ganguly, “Effect of Crop Transpiration on the
Microclimate of a Naturally Ventilated Greenhouse”, International
Journal of Emerging Technology and Advanced Engineering (Special
Issue 3), 2013, pp. 337-343.
[5] T. Boulard and S. Wang, “Greenhouse Crop Transpiration Simulation
from External Climatic Condition”, Agricultural and Forest
Meteorology, vol.100,2000, pp. 25-34.
[6] S. Jain, P. L. Dhar and S. C. Kaushik, “Evaluation of
solid-desiccant-based evaporative cooling cycles for typical hot and humid climate”,
International Journal of Refrigeration, vol.18, 1995,pp. 287-296.
[7] A. Kodama, T. Hirayama, M. Goto, T. Hirose and R. E. Critoph, “The
use of psychrometric charts for the optimization of a thermal swing
desiccant wheel”, Applied Thermal Engineering, vol. 21, 2001, pp.
1657-1674.
[8] Available online at the following website:
(http://ventasen.com/html_products/Desiccant-wheel-146.html), accessed on 20.08.2013.
[9] J. D. Chung, D. Y. Lee and S. M. Yoon, “Optimization of desiccant
wheel speed and area ratio of regeneration to dehumidification as a
function of regeneration temperature”, Solar Energy vol. 83, 2009, pp.
625–635.
[10] M. H. Ahmed, N. M. Kattab and M. Fouad, “Evaluation and
optimization of solar desiccant wheel performance”, Renewable
Energy, vol. 30, 2005, pp. 305-325.
[11] S. P. Sukhatme and J. K. Nayak, “Solar Energy: Principles of Thermal
Collection and Storage (2003)”, Tata McGraw-Hill Publishing
Company Limited, New Delhi, India.
[12] Weather data for Kolkata as available from Regional Meteorological
Centre Kolkata for the year 2009.
[13] Available online at the following website: