Examining the Relationship Between Alcohol and Multiple
Impulsivity Endophenotypes
Laura O’Halloran
A thesis submitted to the School of Psychology, Trinity College Dublin In fulfilment of the requirement of the Degree of Doctor of Philosophy
i
Declaration
I declare that this thesis has not been previously submitted as an exercise for a degree at this or any other university and it is entirely my own work.
I agree to deposit this thesis in the University’s open access institutional repository or allow the Library to do so on my behalf, subject to Irish Copyright Legislation and Trinity College Library conditions of use and acknowledgement
ii
iii
Summary
Alcohol misuse is a leading global health concern, and its occurrence is rising among adolescents and young adults. Associations between different aspects of impulsivity and alcohol-related outcomes have been the focus of much research, yet precise relations remain elusive. Machine learning (ML) can harness large complex data by examining statistical relationships between variables that span across domains (brain, behaviour and traits) of impulsivity to predict different patterns of alcohol use.
Chapter 2 explored the potential predictive utility of self-report and task-based impulsivity endophenotypes for identifying individual differences in two orthogonal latent factors of alcohol use - alcohol intoxication and consumption frequency. Machine-learning with penalised regression was used to generate the model, and out-of-sample validation quantified model performance. Results indicated self-report and task-based impulsivity significantly predicted alcohol intoxication frequency but not consumption frequency. Elevated trait impulsivity (attentional, non-planning, disinhibition, and experience seeking), choice impulsivity (delay discounting), and cognitive impulsivity (sustained attention), but not motor impulsivity (inhibitory control), supported a tendency toward more frequent intoxication.
Extending these findings, Chapter 3 applied a novel machine-learning method with penalised regression to ERP data indexing inhibitory control, and with other risk factor variables, to predict alcohol use. Results showed that inhibitory control ERPs can robustly predict individual differences in alcohol use.
iv
ADHD, the brain correlates of sustained attention in healthy adolescents had not yet been comprehensively characterised. Chapter 4 is the largest population-based functional imaging study to date, to examine both average fMRI activity and functional connectivity as it relates to sustained attention in healthy adolescents. The findings indicated that sustained attentional processes are facilitated by an array of neural networks, including cerebellar crus I/II with motor, prefrontal and occipital cortices. Atypically strong connectivity within motor network was a signature of poor sustained attention, a finding that was also observed in a separate sample of adolescents exhibiting elevated ADHD symptoms, compared to asymptomatic adolescents. No significant brain connectivity correlates of alcohol use were identified in this relatively substance-naïve young adolescent cohort.
v
Published Work
The thesis incorporates material already published or submitted in the journals listed below:
Chapter 1:
*Padilla, M. M., O’Halloran, L., Bennett, M., Cao, Z., & Whelan, R. (2017). Impulsivity and reward processing endophenotypes in youth alcohol misuse. Current Addiction Reports, 4(4), 350-363.
Chapter 1:
O'Halloran, L., Nymberg, C., Jollans, L., Garavan, H., & Whelan, R. (2017). The potential of neuroimaging for identifying predictors of adolescent alcohol use initiation and misuse. Addiction, 112(4), 719-726.
Chapter 2:
O'Halloran, L., Pennie, B., Jollans, L., Kiiski, H., Vahey, N., Rai, L., Bradley, L., Lalor, R., & Whelan, R. (2018). A Combination of Impulsivity Subdomains Predict Alcohol Intoxication Frequency. Alcoholism: Clinical and Experimental Research.
Chapter 3:
**O'Halloran, L., Rueda-Delgado, L., Jollans, L., Zhipeng C., Boyle, R., Vaughan, C., Coey, P. & Whelan, R. (2018). Inhibitory control event-related potentials predict individual differences in alcohol use. Submitted to Addiction Biology. Chapter 4:
O'Halloran, L., Cao, Z., Ruddy, K., Jollans, L., Albaugh, M. D., Aleni, A., Potter, A.S., Vahey, N, Banaschewski, T., Hohmann, S, Bokde, A.L, Bromberg, U,Buchel, C., Burke Quinlan, E., Desrivieres, S., Flor H, Frouin, V., Gowland, P., Heinz, A, Ittermann B, Nees F, Papadopoulos Orfanos, D., Paus, T., Smolka, M.N., Walter, H., Schumann, G., Garavan, H., Kelly, C., & Whelan, R. (2018b). Neural circuitry underlying sustained attention in healthy adolescents and in ADHD symptomatology. NeuroImage, 169, 395-406.
vi
I am very grateful to my colleagues who contributed to these publications, as well the anonymous reviewers who provided invaluable feedback on these works.
Acknowledgements
First and foremost, I would like to thank my wonderful supervisor Dr Robert Whelan. It has been a privilege working with you, and your wisdom, kindness and patience know no bounds. Thank you for believing in me, pushing me and leading the way. It’s bittersweet to be finishing this part of my journey and I hope future collaborations are on the horizon.
Thank you to everyone in the Whelan Lab, including all our postdoctoral researchers, PhD students and research assistants. A special thank you to Hanni for all your support (and your immense patience while I learnt EEG!), Lee and Zhipeng, my fellow PhD students who were there through every peak and trough, and Brian for being the funniest desk neighbour and most positive influence! Thank you to appraisers Dr Tim Trimble and Dr Clare Kelly for supporting me through each stage, especially to Clare, for her invaluable expertise and guidance. A thank you also goes to June Schwitzer for her friendliness and kindness. Thank you to the IMAGEN team who kindly facilitated and supported parts of this research, as well as the Irish Research Council, and all the participants who took part in this research directly and indirectly, without you this thesis would never have been. I’d like to warmly thank all the wonderful staff both in TCIN where I finished, and UCD where it all began!
vii
Especially to Tara, Elaine, Katie, Jess and Jemma - your unwavering support and love never goes unnoticed - lifelong friends like you are hard to come by.
viii
Table of Contents
Examining the Relationship Between Alcohol and Multiple Impulsivity
Endophenotypes ...
Declaration... i
Summary ... iii
Published Work ... v
Acknowledgements ... vi
Table of Contents ... viii
List of Figures ... xi
List of Tables ... xiii
List of Abbreviations ... xiv
Abstract ... xviii
1 Chapter 1: An Introduction to Impulsivity and Alcohol Use ... 1
1.1 Overview ... 2
1.1.1 Alcohol consumption trends. ... 4
1.1.2 Alcohol consumption among young people. ... 5
1.2 Phenotyping alcohol misuse ... 7
1.3 Measuring brain activity non-invasively ... 9
1.4 Defining Impulsivity ... 12
1.4.1 Trait impulsivity and alcohol. ... 15
1.4.2 Choice impulsivity and alcohol ... 17
1.4.3 Motor impulsivity and alcohol ... 19
1.4.4 Cognitive impulsivity and alcohol ... 25
1.4.5 Multiple measures of impulsivity ... 30
1.5 Other risk factors and alcohol ... 39
1.5.1 Reward and punishment learning... 39
1.5.2 Psychological health ... 39
1.5.3 Social Support ... 40
1.6 Multi-domain analyses ... 41
1.7 Interrogating large, multi-domain data ... 42
1.7.1 Machine Learning ... 43
1.7.2 Machine learning studies examining alcohol ... 48
1.7.3 Predicting alcohol outcomes using EEG data ... 49
1.8 Specific aims of the research ... 51
2 Chapter 2: A Combination of Impulsivity Endophenotypes Predict Alcohol Intoxication Frequency ... 53
2.1 Introduction ... 54
2.2 Materials & Methods ... 58
2.2.1 Sample... 58
2.2.2 Procedure ... 58
2.2.3 Measures ... 59
2.2.4 Data Analysis ... 63
2.3 Results ... 65
2.3.1 Participants ... 65
2.3.2 Relationship among impulsivity domains ... 65
ix
2.3.4 Machine Learning Results ... 70
2.4 Discussion ... 72
3 Chapter 3: Inhibitory Control Event-Related Potential Predict Individual Differences in Alcohol Use ... 80
3.1 Introduction ... 81
3.2 Materials & Methods ... 85
3.2.1 Sample ... 85
3.2.2 Procedure ... 85
3.2.3 Measures ... 86
3.2.4 EEG recording and pre-processing ... 89
3.2.5 ERP calculation ... 89
3.2.6 Machine learning analysis ... 90
3.3 Results ... 93
3.3.1 Behavioural results ... 93
3.3.2 Machine learning results ... 95
3.4 Discussion ... 100
4 Chapter 4: Neural Circuitry Underlying Cognitive Impulsivity: An Examination of Sustained Attention in Healthy Adolescents ... 107
4.1 Introduction ... 108
4.1.1 Brain Correlates of Sustained Attention. ... 108
4.1.2 The Present Study ... 111
4.2 Materials & Method ... 112
4.2.1 Participants ... 112
4.2.2 Measures ... 112
4.2.3 MRI acquisition and analysis ... 115
4.3 Results ... 122
4.3.1 Behavioural Results ... 123
4.3.2 fMRI Activation Results ... 124
4.3.3 Functional connectivity results ... 129
4.4 Discussion ... 138
4.4.1 Alcohol: sustained attention and the brain ... 138
4.4.2 Brain correlates of sustained attention ... 139
4.4.3 Strengths and limitations ... 141
5 Overall Discussion ... 144
5.1 Review of general aims and summary of main findings ... 144
5.2 Impulsivity phenotypes and different patterns alcohol use... 145
5.2.1 Trait impulsivity ... 146
5.2.2 Choice impulsivity ... 147
5.2.3 Motor impulsivity ... 149
5.2.4 Cognitive impulsivity ... 153
5.3 The role of other risk factors ... 154
5.4 Implications for alcohol use among adolescents and young adults and emergence of alcohol-use disorders ... 160
5.4.1 Limitations ... 161
5.5 Future directions ... 166
5.5.1 The role of neuroimaging for identifying predictors of alcohol use ... 166
x
5.5.3 Intervention ... 170
5.6 Concluding remarks ... 171
6 References ... 173
7 Appendices ... 232
7.1 Supplemental 2.1... 232
7.2 Supplemental 3.1... 248
7.3 Supplemental 4.1... 262
xi
List of Figures
Chapter 1: Page
Figure 1.1 Stop success and stop fail networks 22
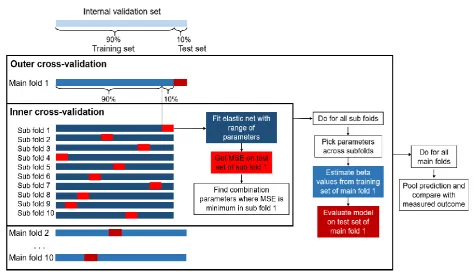
Figure 1.2 Example of procedure for nested cross-validation 46 Chapter 2:
Figure S2.1 Visual representation of DDT 229
Figure S2.2 Visual representation of SST 231
Figure S2.3 Visual representation of PST 233
Figure S2.4 Schematic description of the RAFT algorithm 236
Figure S2.5 Scree plot of eigenvalues for principal components analysis of alcohol-use questions
238
Figure S2.6 Machine learning results for predicting intoxication frequency 239 Chapter 3:
Figure 3.1 Illustration of the horse-race model of behavioural inhibition on the SST
88
Figure 3.2 A) Map of beta values across main folds for the failed stop and successful stop conditions
96
Figure 3.2 B) Maps of the grand average ERP of the failed stop and successful stop conditions
96
Figure S3.1 ERP grand-average across participants, based on all non-artifact independent components, time-locked to the stop-signal for four fronto-central channels.
252
Figure S3.2 Map of 64-channel set-up across the scalp during EEG recording. 255 Chapter 4
Figure 4.1. ROIs that positively correlated with IRV (yellow; poor sustained attention) and negatively correlated with IRV (blue; good sustained
attention) for the normative sample during (A) Go trials (B) Stop Fail and
(C) Stop Success trials. Average fMRI activation images were created
using MRIcroGL software (http://www.cabiatl.com/mricrogl/).
128
Figure 4.2 (A) BrainNet was used to visualize network connectivity (Xia, Wang & He, 2013), based on specific guidelines (see Shen et al., 2017), whereby nodes are grouped into localized regions. Good sustained
xii
attention denotes all connections between ROIs that negatively correlated with IRV (blue); poor sustained attention denotes all connections between ROIs that positively correlated with IRV (orange) for the normative sample.
Figure 4.2 (B) Circle plots were generated using a custom-written Matlab function to visualize good sustained attention (blue) and poor sustained attention (red) for the normative sample.
135
Figure 4.2 (C) The top 100 nodes and 10 nodes denoting good sustained attention (i.e. connections between ROIs that negatively correlated with IRV, where p<.001).
135
Figure 4.2 (D) The top 100 nodes and 10 nodes denoting poor sustained attention (i.e. connections between ROIs that positively correlated with IRV where p<.001).
135
Figure 4.3. With respect to ROI connections associated with high IRV (i.e., poor sustained attention), the ADHD symptom exhibited significantly stronger
connectivity between ROIs, compared to controls.
136
Figure S4.1 Examination of distributions of FC-IRV correlations for various motion-determined subgroups.
xiii
List of Tables Chapter 1:
Table 1.1 Summary of reviewed studies on impulsivity and reward endophenotypes in youth alcohol misuse
35
Chapter 2:
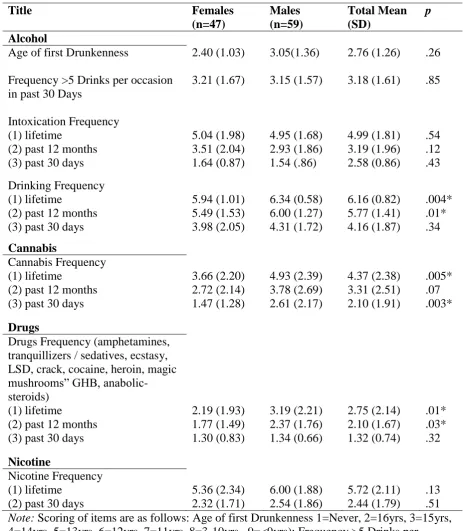
Table 2.1 ESPAD Substance Use Sample Characteristics 60
Table 2.2 Self-report and Task-based Measures Sample Characteristics 66 Table 2.3 Varimax-Rotated Exploratory Principal Components Factor Analysis of
alcohol items
67
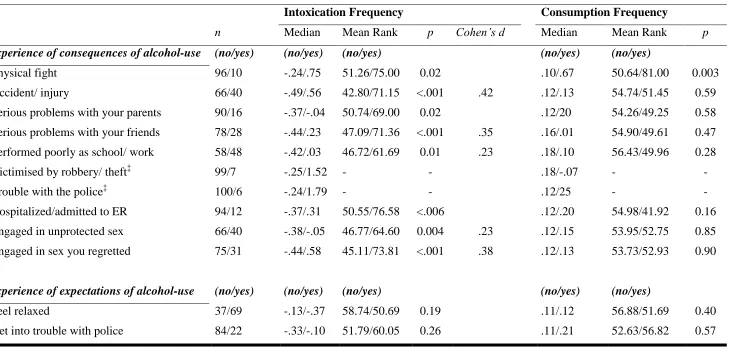
Table 2.4 Consequences & Expectations of Alcohol-use by Intoxication & Frequency of Alcohol use
68
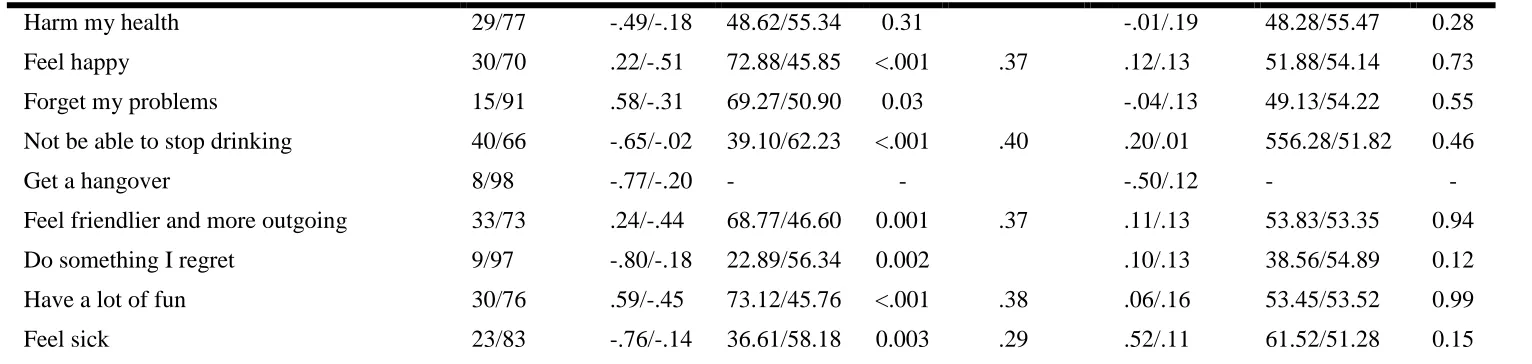
Table 2.5 Machine-learning results 71
Table S2.1 Relationship among impulsivity variables 237
Table S2.2 Items included from the ESPAD 241
Chapter 3:
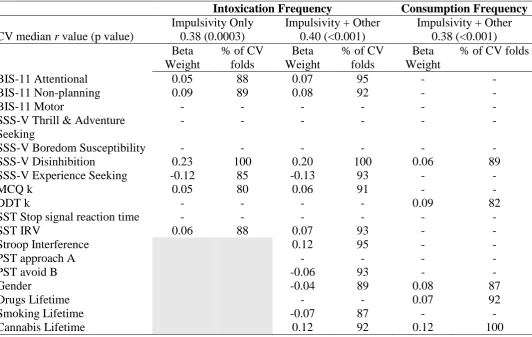
Table 3.1. AUDIT sample characteristics 93
Table 3.2 Self-report and Task-based Measures Sample Characteristics 94
Table 3.3 Machine-learning results for non-EEG models 98
Table S3.1 Spearman’s Rho correlations among variables 251
Table S3.2 Results of machine learning models 252
Table S3.3 Machine-learning results for all models 253
Chapter 4:
Table 4.1 Summary statistics for the normative sample 122
Table 4.2 Summary statistics for ADHD symptom and asymptomatic control groups
123
Table 4.3 fMRI Activation correlated with IRV (Normative sample) 126 Table 4.4 Top 30 Connections between ROIs Correlated with IRV 131 Table S4.1 r values of the top 100 FC-IRV connections identified from the
normative sample.
262
xiv
List of Abbreviations
Sx-5CRTT: Five-Choice Serial Reaction Time Task
ACC Anterior Cingulate Cortex
ADHD Attention Deficit Hyperactivity Disorder
APA American Psychiatric Association
API Alcohol Problems Index
AU Alcohol Use
AUD Alcohol Use Disorder
AUDIT Alcohol Use Disorders Identification Test
AUQ Alcohol Use Questionnaire
BART Balloon Analogue Risk Task
BD Binge-Drinking
BIS-11 Barratt Impulsiveness Scale – 11 Item version
BOLD Blood Oxygenation Level Dependant
CANTAB Cambridge Neuropsychological Test Automated Batter
CCPT Conners’ Continuous Performance Test
CDDR Customary Drinking and Drug Use Record
CPT Continuous Performance Test
CV Cross-validation
D2 DBA/2J
DA Dopamine
DAN Dorsal attention network
DASS Depression, Anxiety and Stress Scale
DAWBA Development and Well Being Assessment
DDHx Drinking and Drug History Questionnaire
DDQ Delay Discounting Questionnaire
DDT Delay Discounting Task
DLPFC Dorsolateral prefrontal cortex
DMN Default mode network
DMQ Drinking Motives Questionnaire
xv
DSM-V Diagnostics and Statistics Manual 5th Edition
EEG Electroencephalography
ERN Error-related Negativity
ERP Event-related potential
ESPAD European school survey project on alcohol and other drugs
FH Family History of Alcoholism
fMRI Functional Magnetic Resonance Imaging
FrSBE Frontal System Behaviour Scale;
GBD Global Burden of Diseases
GNG Go/No-Go task
IFC Inferior Frontal Cortex
IGT Iowa Gambling Task
IPL Inferior parietal lobe
IPS Intraparietal sulcus
IRV Individual Response Variability
ITI Inter-trial interval
KMO Kaiser-Meyer-Olkin
PCA Principal component analysis
PDHQ Personal Drinking Habits Questionnaire
Pe Evoked Potentials
PFC Prefrontal cortex
LASSO Least absolute shrinkage and selection operator
MRI Magnetic Resonance Imaging
MCQ Monetary Choice Questionnaire
MFG Middle Frontal Gyrus;
mFWD Mean framewise displacement
MID Monetary Incentive Delay Task;
MINI Mini International Neuropsychiatric Interview
ML Machine Learning
MS Millisecond
xvi
OFC Orbitofrontal Cortex
QFV Quantity Frequency-Variability Index
RAFT Regularized Adaptive Feature Thresholding algorithm
RAPI Rutgers Alcohol Problem Index
rIFC right Inferior Frontal Cortex
RT Reaction Time
SCID Structured Clinical Interview for DSM-IV
SD Standard deviation
SE Standard Error of Mean
SFG Superior Frontal Gyrus
SMA Supplementary Motor Area
S-MAST Short-Michigan Alcoholism Screening Test
SME Standard Mean Error
SPSRQ Sensitivity of Punishment and Sensitivity of Reward Questionnaire SSAGA Semi Structured Assessment for the Genetics of Alcoholism
SSS Sensation Seeking Scale
SST Stop Signal Task
SU Substance use
SUD Substance Use Disorder
SURPS Substance Use Risk Profile Scale
TCIP Two Choice Impulsivity Paradigm;
TCI-R Temperament and Character Inventory-Revised;
TLFB TimeLine Follow-Back
TRAILS Tracking Adolescents' Individual Lives Survey;
UPPS Impulsive Behaviour Scale
vmPFC ventromedial prefrontal cortex
WISC-IV Wechsler Intelligence Scale for Children
WOF Wheel-of-Fortune Task
WHO World Health Organisation
xviii
Abstract
Alcohol use is the most significant worldwide risk factor for mortality and morbidity among young people, with consumption rates peaking in college years and highest in student populations. Impulsivity, broadly characterised as the tendency to act prematurely without foresight, is linked to alcohol misuse in college students. However, impulsivity is a multidimensional construct and different subdomains likely underlie different patterns of alcohol misuse. Furthermore, the relationship between certain impulsivity endophenotypes, such as cognitive impulsivity, i.e., lapses in sustained attention, and alcohol use is relatively unknown in young people, and the neural mappings underlying sustained attention in adolescents have yet to be identified. Machine learning methods can harness large complex data by examining statistical relationships between variables that span across domains (brain, behaviour and traits) of impulsivity to predict different patterns of alcohol use. Using this method, this thesis sought to quantify the association between different patterns of alcohol use and various impulsivity endophenotypes, including trait, motor, choice, and cognitive impulsivity, in student samples. A data-driven, multi-step analysis approach was also used to identify neural correlates of sustained attentional processes, an important aspect of cognitive impulsivity.
Results indicated different impulsivity endophenotypes predicted different aspects of alcohol use, such as elevated scores on the Alcohol Use Disorders Identification Test and a tendency towards alcohol intoxication, but not consumption frequency. Impulsive personality traits of disinhibition and poorer planning skills, and behavioural indicators of difficulties sustaining attention, appear to be the most important markers across different alcohol use patterns. Results also showed that inhibitory control ERPs can robustly predict individual differences in alcohol use. Cognitive impulsivity emerged as an important predictor of alcohol misuse in student samples, but not for relatively low alcohol use in adolescents. Sustained attentional processes were facilitated by an array of neural networks, including cerebellar crus I/II with motor, prefrontal and occipital cortices. Atypically strong connectivity within motor network was a signature of poor sustained attention, a finding that was also observed in a separate sample of adolescents exhibiting elevated ADHD symptoms, compared to asymptomatic adolescents. However, no significant brain connectivity correlates of alcohol use were identified in this relatively substance-naïve young adolescent cohort.
xix
increased power, greater predictive accuracy and more valuable clinical utility than any
1
1
Chapter 1: An Introduction to Impulsivity and Alcohol Use
GENERAL OVERVIEW AND AIMS OF RESEARCH
1
1
2
1.1
Overview
Alcohol use is a leading risk factor for disease burden worldwide, and it contributes to serious ramifications for population health across the lifespan, according to the Global Burden of Diseases (GBD; Adhikari, 2018). The pattern of alcohol misuse in the form of binge-drinking (BD) or heavy episodic drinking has increased, especially among adolescents and young adults in recent years (Kuntsch, Kuntsche, Thrul, & Gmel, 2017). Alcohol misuse is often used as an omnibus term for underage alcohol use, alcohol abuse, alcohol dependence or alcohol use disorder (AUD), and is operationalized according to a wide range of overt symptoms. For example, an individual can be deemed to have an alcohol use disorder (AUD) by having any 2 of 11 symptoms during a 12-month period, based on DSM-V diagnostic criteria (American Psychiatric Association, 2013). This approach to phenotyping may hinder the search for biological mechanisms underlying alcohol misuse because individuals with no symptom overlap can be classified together, despite heterogeneity in symptoms. Therefore, an enhanced approach for ultimately understanding the pathophysiology of alcohol misuse will require focusing on endophenotypes (also known as intermediate phenotypes; Gottesman, & Gould, 2003).
3
(Robbins & Dalley, 2017). Different aspects of impulsivity are likely to be derived from different neural systems that are, at least partially, independent (Bari & Robbins, 2013; Caswell, Bond, Duka, & Morgan, 2015a; Dalley & Robbins, 2017). As such, it is likely that different impulsivity endophenotypes underlie different patterns of alcohol misuse. However, the precise nature of those associations continues to remain unclear, elucidating upon this will be an important tenet of this thesis. Accurately characterising alcohol misusers in terms of impulsivity endophenotypes would identify target brain systems for future psychosocial or pharmacological intervention. This is important because alcohol misuse is associated with numerous adverse psychological and health-related outcomes, such as poorer health-related quality of life (Luquiens, Falissard, & Aubin, 2016) mental illness (Rehm, 2011), injuries, and even death (Hingson et al., 2005). Adolescents and young adults are particularly vulnerable to the adverse psychological effects of alcohol misuse, and a broad range of detrimental alcohol-related consequences (White & Hingson, 2013). Focusing on these populations is motivated by the particularly high levels of alcohol misuse among student populations (Lyvers, Duff, Basch, & Edwards, 2012), as well as the need to identify important neurocognitive brain networks prior to substance misuse in adolescents.
4
could shed light on the precise correlates of alcohol misuse. A multi-domain approach is primarily data driven, using algorithms that search for patterns within data, with accurate prediction on previously unseen data as the metric of success. Basic principles and techniques developed within the field of machine learning are well suited for this approach. Later in this Chapter, some recent advances in neuroimaging will be outlined, with a focus on prediction of alcohol use through the use of machine-learning methods
1.1.1 Alcohol consumption trends.
5
estimated that 7.5% of the worldwide population of 15 years and older, binge drink at least weekly.
In Ireland, 76% percent of the Irish population (15 years and older) identify as drinkers, and approximately 4 in 10 drinkers self-reported engaging in BD behaviour on a typical drinking occasion, according to the Healthy Ireland Survey (2015) conducted by the Irish Department of Health. This includes almost a quarter reporting BD at least once per week. The National Alcohol Diary Survey (2014) in Ireland reported that almost two thirds (64.3%) of young adult drinkers (18-24 years old) engaged in BD (6 or more standard drinks) in a typical drinking episode. In particular, higher levels of alcohol consumption and BD in Ireland have placed an increased burden on the health system, criminal justice system and society in general (O’Connell, Chin, & Lawlor, 2003). With recent estimates indicating that the prevalence of alcohol use is increasing at a relative rate (0.3% per year), as well as rates of BD (0.7% per year) in the United States, it is perhaps unsurprising that this reflects sharp increases in alcohol-related problems over the last decade (Grucza et al., 2018).
1.1.2 Alcohol consumption among young people.
6
neuropsychological development underpinning cognitive functions implicated in social cognition and cognitive control (Blakemore & Choudhury, 2006). During puberty, young people experience significant increases in emotional arousal, impulsivity, and reward sensitivity (Steinberg, 2005), and this in turn can result in adolescents making choices that are oriented towards short-term outcomes, which potentially lead to adverse consequences (Ochsner & Gross, 2005; Todd, Cunningham, Anderson, & Thompson, 2012).
Age-of-onset of alcohol consumption is considered one of the most influential risk factors of dependence later in adulthood (Hawkins, Catalano, & Miller, 1992; Hingson, Heeren & Winter, 2006; Behrendt, Wittchen, Hofler, Lieb, & Beesdo, 2009). Although BD often starts during late adolescence, a large proportion of students seem to acquire this unhealthy pattern of consumption during their first years at university. A study of 1,894 first-year university students found that 1 in 4 first initiated BD at university in the United States (Weitzman, Nelson & Wechsler, 2003). Moreover, recent research has highlighted that BD that is evident at aged 18 in university students, is a significant predictor of whether young adults will continue to engage in problematic drinking behaviours at age 27 (Moure-Rodriguez et al., 2018).
7
an increase in heavy episodic drinking and related problems among students in the United States (Hingson, Zha, & Smyth, 2017). Repeated misuse of alcohol in university students can contribute to numerous adverse consequences (Perkins, 2002), such as academic difficulties, unplanned and unprotected sexual activity, problems with authorities (Vik et al., 2000), injuries, and even death (Hingson et al., 2005).
1.2
Phenotyping alcohol misuse
8
Secondly, different alcohol consumption behaviours may be attributable to individual differences. For example, with regards to the consequences of alcohol use, drunkenness in young adolescents, not drinking per se, is a stronger risk factor for later problems (Kuntsche et al., 2013). Sanchez-Roige and colleagues (2014) suggest that a “binge score” focusing on patterns of drinking (including drunkenness) rather than a typical quantity measurement “drinks in a row,” may provide better predictors of potential dependency on alcohol. However, memory heuristics can render the accuracy and validity of retrospective self-reported alcohol consumption as unrealiable (Patrick & Lee, 2010). Indeed, high drinkers have been found to underestimate consumption and drinking behaviour, and despite intercorrelation among alcohol-related indices, no one particular measure or term may adequately capture or describe the risky drinking patterns that young people engage in (Townshend & Duka, 2002). This problem can be mitigated using similar questions relating to multiple time points as a memory cue, which increases recall accuracy (Eisenhower, Mathiowetz, & Morganstein, 1991). For example, the European School Survey Project on Alcohol and Other Drugs questionnaire (ESPAD; Hibell et al., 2009) assesses alcohol use across lifetime, past 12-months and past 30-days, as well as items regarding expected personal consequences of alcohol use.
9
implications for our understanding of the aetiology of addiction. Conceptualising the traits of alcohol users as existing along a continuum suggests a change in focus from particular diagnostic groups to community samples, and the inclusion of individuals with intermediate levels of substance use (SU). Therefore, by considering a range of usages, it is possible to harness the potential of population-based cohort studies that have already been collected and that contain phenotypic data on multiple quantitative dimensions.
1.3
Measuring brain activity non-invasively
Neuroimaging techniques, such as functional magnetic resonance imaging (fMRI) and electroencephalography (EEG), have enhanced researchers' prospects of linking discrete cognitive functions to specific brain regions and neuronal networks. Over the past three decades, researchers have utilised magnetic resonance imaging (MRI) as a non-invasive technique to characterise anatomical, physiological, and metabolic changes in the human brain in order to better understand the underlying mechanisms of impulsivity, as well as alcohol’s deleterious effects on the brain.
10
fMRI has the capacity to detect hemodynamic responses evoked by single events, based on block design tasks, as well as transient hemodynamic responses evoked by changing stimuli or task conditions during related tasks (i.e., stimulus randomisation). In event-related experiments, long inter-stimulus interval (ISI) enables recovery of the hemodynamic response, however this can be fatiguing and time-inefficient. Separation of signals from rapid event-related designs assumes that the hemodynamic responds to sequential events summate in a roughly linear fashion (Boynton et al., 1996; Dale and Buckner, 1997), although unwanted variance associated with the lower limit of the average response elicited by conditions of interest must be accounted for. There are two widely-used approaches to analyse spatiotemporal information of fMRI data. The first approach includes model-based methods, such as general linear model (GLM; Friston et al., 1994), which indicates how well a certain model fits to the fMRI data. The second approach includes data-driven methods, which are based on feature extraction from fMRI data (Calhoun et al., 2003, Shen et al., 2017). Using the GLM, neurophysiological responses can be partitioned into components of interest, as well as confounds and errors; evoked hemodynamic responses corresponding to the timing of the stimulus presentation are convolved with a canonical hemodynamic response function for each participant, to determine the activated brain areas. Data-driven methods, on the other hand, are more flexible and are useful for identifying features from the data, including unanticipated unexpected regional activation, which can later be used in model-based approaches.
11
data-driven fMRI analyses in their research, finding that sustained attentional processes emerged from an array of large-scale functional connectivity across different brain networks. The temporal resolution (i.e., the precision of measurement with respect to time) for fMRI is typically in the order of seconds, whereas its spatial resolution is in the order of millimetres. Under most conditions there is a trade-off between temporal and spatial resolution, and harnessing measures with higher temporal resolution to identify exact timings of cognitive processes may outweigh the benefits associated with using fMRI. For example, due to its high temporal resolution, electroencephalography (EEG) is well-suited to study dynamic changes and the connectivity of brain networks underlying response inhibition (Huster, Plis, Lavallee, Calhoun, & Herrmann, 2014). EEG measures are typically used to examine event-related potentials (ERPs). ERPs provide an instantaneous, continuous, millisecond-resolution measure of cognitive processes, which can be used to isolate inhibitory control mechanisms. ERPs are voltage fluctuations that occur as a consequence of an external or internal event (e.g., presentation of a stimulus (sensory), or preparation of a movement (motor); arising from postsynaptic potentials in cortical neurons. This produces opposite polarities on either side of the active tissue, with polarity depending on whether the postsynaptic potential is excitatory or inhibitory (Buzsáki, Anastassiou, & Koch, 2012). If many neurons (in the order of thousands to millions) are active simultaneously and are spatially aligned, their electric fields summate, and the summed voltage can be recorded on the surface of scalp (Kappenman & Luck, 2016).
12
surprisingly a multi-domain approach combining brain, behaviour and trait domains are increasingly gaining popularity among neuroscientists and psychologists striving to understand the neuropsychosocial profiles of alcohol misuse.
1.4
Defining Impulsivity
Impulsivity has long been recognised for its importance both in everyday life. Impulsivity is considered to exist along a continuum, with individual variation in impulsive tendencies contributing to alcohol use, as well as more severe behaviours, characterised by an impulsive urge towards alcohol consumption and an inability to inhibit consumption, regardless of negative consequences (Holmes, Hollinshead, Roffman, Smoller, & Buckner, 2016). Although the construct of impulsivity has been described as a “a useful heuristic” (Dalley et al., 2011), there are many definitions of this construct (Evenden, 1999a, 1999b; Moeller, Barratt, Dougherty, Schmitz, & Swann, 2001). Impulsivity can be defined as a predisposition for rapid, unplanned actions in response to internal or external stimuli without consideration for the negative consequences of these actions (Moeller et al., 2001). By this definition, impulsivity is an automatic process, driven by quick decision-making and a lack of foresight, thus impeding appropriate evaluation of the consequences. Similarly, Eysenck (Eysenck & Eysenck, 1978) disassociates impulsiveness and “venturesomeness”, which is related to conscious risk-taking.
13
theorised that personality consists of two dimensions of higher-order traits; that is, extraversion vs introversion and neuroticism vs emotional stability, whereby impulsivity was a combination of high Extraversion and Neuroticism and Psychoticism. In a revised model, however, impulsivity is regarded as a part of third dimension items, i.e. psychoticism vs impulse control, whereby impulsivity is related to risk-taking and lack of planning and Extraversion is primarily defined by its sociability content (Eysenck & Eysenck, 1985). Although discriminating impulsivity from sociability helped to clarify the current conceptualisation of Extraversion, aspects of sociability from Eysenck’s original proposal remain intertwined with the concept of impulsivity. For example, the Barratt Impulsiveness Scale (BIS; Barratt, 1959), a commonly used self-report measure of trait impulsivity, measures content related to extraversion (Sharma et al., 2014). Other ways to conceptualise impulsivity also emerged, including Zuckerman’s (1984) concept of “sensation seeking”, describing high sensation seekers as individuals who show a need for stimulation and novel experiences, regardless of the risks (Zuckerman, 1984).
14
Seeking (engaging in risky and exciting activities), Disinhibition (a desire for social stimulation and disinhibited behaviour), experience seeking (a desire for experience a non-conforming lifestyle through unplanned activities or drugs), and boredom susceptibility (an aversion to repetition and routine).
The behavioural approach to impulsivity predominantly comprises at least two major dimensions. The first is motor impulsivity (or impulsive action) and reflects disinhibition, and can be divided into action cancellation and action restraint. The second, labelled choice impulsivity by some (e.g., Paloyelis, Asherson, Mehta, Faraone, & Kuntsi, 2010), reflects impulsive decision-making, and can be separated into risk or uncertainty-based choice and delay-based choice (Winstanley, Olausson, Taylor, & Jentsch, 2010). De Wit (2009) suggested a third dimension of impulsivity, such as attention lapses on a simple reaction time task, proposing that sustained attention is crucial for tempering drug-seeking behaviours in addicts. Furthermore, subtypes within impulsive action have been distinguished, at different stages of the process (Caswell et al., 2015a; Evenden, 1999a): impulsive preparation (i.e. reflection—responding before all necessary information is obtained; Kagan, 1965); motor impulsivity (failure to follow instruction and inhibit motor responses); and an outcome stage of impulsivity (failure to delay gratification). Other notable definitions have arisen, for example, temporal impulsivity encompasses both delay gratification and decision-making under conditions of risk or uncertainty (Fineberg et al., 2010; 2014; Winstanley et al., 2010).
15
1.4.1 Trait impulsivity and alcohol.
Increased trait impulsivity is sensitive to different patterns of use among adolescents and young adults (Adan, Forero, & Navarro, 2017; Stautz & Cooper, 2013). Across various studies, binge-drinkers show higher scores for both impulsivity (Adan, Navarro & Forero, 2016; Leeman, Hoff, Krishnan-Sarin, Patock-Peckham, & Potenza, 2014; Mackie, Castellanos‐Ryan, & Conrod, 2011; Motos Sellés, Cortés Tomás, Giménez Costa, & Cadaveira Mahía, 2015) and sensation seeking (Bø, Billieux, & Landrø, 2016; Lac, & Donaldson, 2016; Leeman, Fenton, & Volpicelli, 2006; Leeman, Hoff, Krishnan-Sarin, Patock-Peckham, & Potenza, 2014; Shin, Hong & Jeon, 2012), compared to non-binge-drinkers. Higher trait impulsivity and sensation seeking scores are also associated with increased numbers of drinks consumed per episode (Balodis, Potenza, & Olmstead, 2009; Doumas, Miller, & Esp, 2017; Lang et al., 2012) and the frequency of BD (Carlson & Johnson, 2012; Castellanos‐Ryan, Rubia, & Conrod, 2011; Lang et al., 2012).
16
Differentiation between BIS-11 subscales and various aspects of alcohol misuse have also been found. Using a binge score of alcohol consumption, Sanchez-Roige and colleagues (2014) found that binge-drinkers displayed significantly higher scores for Motor and Non-planning subscales of the BIS-11, compared to non-binge drinkers. Unlike the BIS-11, researchers typically report facet-level scores of the UPPS and UPPS-P, rather than total scores (Stevens, Blanchard & Littlefield, 2018). Despite a strength of the BIS-11 measurement tool being its ability to assess different aspects of impulsive traits, researchers often report a total score when using the BIS-11 (Stevens, Blanchard & Littlefield, 2018), which assumes impulsivity to be a unidimensional construct (Stanford et al., 2009). Given that different aspects of alcohol use (e.g. drunkenness vs. frequency) appear to be related to total BIS-11 scores, it will be important to examine this further using the subscales.
17
suggest that impaired control may play a specific role in the pathway to alcohol problems from response impulsivity, but not from reflection impulsivity.
The Substance Use Risk Profile Scale (SURPS; Woicik, Stewart, Pihl & Conrod, 2009) was developed to examines impulsive traits that are directly related to substance misuse risk, including Sensation seeking, Impulsivity, Anxiety sensitivity, and Hopelessness. An examination of the SURPS in approximately 2000 14-year-olds found that Impulsivity and Sensation seeking dimensions predicted alcohol use two years later (Jurk et al. 2015). Other studies using the SURPS also showed that binge-drinkers had higher Sensation seeking, Impulsivity and Hopelessness scores than non-binging adolescents (Mackie, Castellanos‐Ryan & Conrod, 2011; Whelan et al., 2014).
Examining which specific aspects of trait impulsivity are most closely related to alcohol misuse, as well as which measures can be used to asses personality, is difficult (Adan et al., 2017). Furthermore, other broad personality traits not directly related to impulsivity, such as the Big Five model (Extraversion, Neuroticism/Emotional stability, Conscientiousness, Openness (to new experiences)/Intellect, and Agreeableness) are considered to be important variables in determining BD trajectories (Sharma et al., 2014; Whelan et al., 2014; Zhang, Bray, Zhang & Lanza, 2015). However, cross-sectional studies using the Big Five model to examine the relationship between personality and BD have been inconclusive, and trait impulsivity in conjunction with more broader personality measures have rarely been examined (Adan et al., 2017).
1.4.2 Choice impulsivity and alcohol
18
be characterised by the tendency to choose a smaller immediate reward rather than waiting for a larger, but delayed, reward. Choice impulsivity can be measured via a questionnaire, such as the Delay Discounting Questionnaire (DDQ) and Monetary Incentive Questionnaire (MCQ; Kirby, Petry & Bickel, 1999), or via a task, such as the Two-Choice Impulsivity paradigm (TCIP Dougherty, Mathias, Marsh & Jagar, 2005) or the Delay Discounting Task (DDT; Kirby & Maraković, 1996; Kirby, Petry & Bickel, 1999).
19
1.4.3 Motor impulsivity and alcohol
Motor impulsivity, otherwise known as response inhibition, refers to the inability to inhibit certain unwanted behaviours or to quickly cancel an already-initiated response, and relies on effective and rapid inhibitory control in the brain. Various behavioural tasks have been developed to measure motor impulsivity. In both the Stop Signal Task (SST; Logan, 1994) and Go/No Go (GNG) task (Hogg, Evans, & Adrian, 1975) participants are required to respond to go-signals, and to inhibit their responses to stop signals. Evidence indicates that these tasks are not equivalent and probe distinct processes–the SST assesses ‘action cancellation’ (i.e., inhibition of an already initiated response), while the GNG assesses ‘action selection and restraint’ (i.e., inhibition of a response before it has started; Dalley, Everitt, & Robbins, 2011; Eagle, Bari, & Robbins, 2008). fMRI studies implicate dominant “stopping” brain activation patterns for both tasks, including the inferior and right MFG, ACC, pre-supplementary motor area, right inferior parietal lobe, and left middle temporal cortex (Rubia et al., 2001). However, the SST primarily shows activation in the right hemisphere, while the GNG task shows bilateral, but more left-hemisphere activation (D’Alberto, Funnell, Potter, & Garavan, 2017; Nikolaou, Critchley, & Duka, 2013; Rubia et al., 2001). Yet, these tasks are often used indiscriminately under the assumption that both measures are very similar at “stopping” abilities (Robinson et al., 2009; Dalley et al., 2011). Nevertheless, several studies have shown that both action cancellation and restraint are impaired in substance misusers, including alcohol misusers (Petit, Kornreich, Noël, Verbanck & Campanella, 2012; Czapla et al., 2017).
20
intermittent and unexpected ‘Stop’ cues (Verbruggen & Logan, 2008). On trials with a stop stimulus, the ‘horse race model’ (Band, Van Der Molen & Logan, 2003) posits a race between two separate processes that are each triggered by the Go and Stop signal. If the stop process is completed before the Go process, subjects will successfully inhibit their responses (Verbruggen & Logan, 2008) and vice-versa. The stop-signal reaction time (SSRT) indexes the time needed to successfully inhibit a response during the SST (Congdon et al., 2012), and is a reliable measure of deficits in inhibitory control. The SSRT is a measure of a covert mental process, and can be calculated by subtracting the average stop signal delay from the participant’s Go reaction time. Shorter SSRTs indicate better inhibitory control. In neurologically healthy adults, SSRTs are approximately 200 ms (Dimoska et al., 2006; Hoptman et al., 2018; van Boxtel et al., 2001; Wessel & Aron, 2015; Wessel et al., 2016), but longer in adults with ADHD (Lijffijt et al., 2005) and in individuals with addictions (Luijten et al., 2011).
1.4.3.1 Behavioural correlates of motor impulsivity.
21
top-down cognitive control (Robbins & Dalley, 2017; López-Caneda et al., 2013). However, differences in brain activity related to response inhibition have been observed in young adolescent drinkers, even in the absence of behavioural differences (Whelan et al., 2012; Wetherill, Squeglia, Yang & Tapert, 2013b; Worhunsky et al., 2016). This suggests that neural measures of inhibitory control have some potential to better characterise individual differences in alcohol misuse than behavioural metrics alone.
1.4.3.2 fMRI: Brain correlates of motor impulsivity.
22
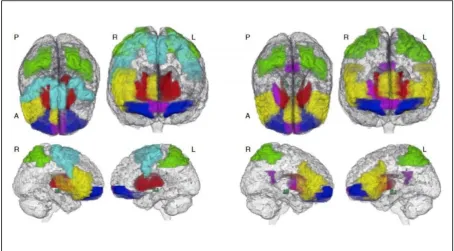
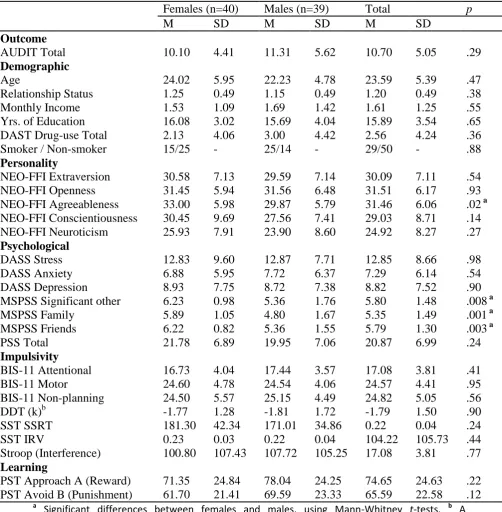
Figure 1.1. Stop success and stop fail networks characterised using factor analysis of the brain activation during the SSRT in 1896 14-year-olds from the IMAGEN sample (Whelan et al., 2012). Left side —seven stop success networks including: Basal Ganglia network (red); right Inferior frontal network (yellow); bilateral substantia nigra/subthalamic nucleus (STN) network (grey); Orbital network (dark blue); pre-supplementary motor/ precentral gyrus (cyan), parietal network (dark green) and the medial orbital network (magenta). Right side — six stop failure networks. The anterior cingulate network (yellow); the substantia nigra/STN network (grey); basal ganglia network (red), the parietal network (dark green); the PCC/medial orbital network (magenta) and the orbital network (dark blue). A: anterior; P: posterior; L: left; R: right.
[image:43.595.91.546.91.342.2]23
alcohol use differences; it is possible that in the latter study, the amount of alcohol consumed regularly was sufficient to impair brain function, leading the drinking group to recruit additional brain resources in response to cognitive demands.
24
adolescents who would subsequently experience blackouts had increased frontal hyperactivation at baseline.
1.4.3.3 EEG: brain correlates of motor impulsivity.
ERPs obtained using EEG are modulated by performance during the SST (e.g. Kenemans, 2015). Two ERPs, the P3 and N2, are predominately associated with response inhibition. The N2 is a fronto-lateral negative component peaking around 200-250ms. The N2 is thought to reflect conflict monitoring and effortful processing, predominantly through activity of the anterior cingulate cortex (ACC; Pandey et al., 2012). The P3 is a fronto-central positive component peaking around 300-350ms. Larger N2 amplitudes are sometimes observed for failed versus successful stop trials (Kok et al., 2004), while larger P3 amplitudes have been consistently observed for successful versus failed stop trials in healthy participants (Kok et al., 2004; Lansbergen et al., 2007).
25
a GNG task at follow-up. There is also some evidence that alterations in earlier ERP components (e.g., P1) are linked to alcohol misuse, as has been found among an alcoholic dependent sample (Maurage et al., 2007; 2012). Yet, these early components have surprisingly received little attention. It is important to establish whether the link between ERPs and alcohol misuse is specific to later N2/P3 components, or if deficits are already present earlier in the cognitive processing stream.
Mixed findings, such as potential ERP correlates of alcohol use, are common in cognitive neuroscience. Firstly, as outlined earlier in this Chapter, studies typically test the statistical significance of between-group comparison (e.g., heavy drinkers vs. controls), and cut-off scores used to define alcohol misusers are varied. Secondly, the discrepancies in the neuroimaging findings are likely to be related to methodological challenges that are associated with examining highly dimensional data, a point which will be discussed in more detail later in this Chapter. Notably, these EEG studies, as well as the aforementioned neuroimaging studies, used GNG tasks to examine the relationship between inhibitory control and alcohol use, with one exception (Whelan et al., 2012). However, these tasks are dissociable (Littman & Takács, 2017), and although the SST has not been widely used to determine the ERP-alcohol relationship, the SST may be sensitive to detecting alcohol-induced changes in the P3 during inhibition control (Plawecki et al., 2018).
1.4.4 Cognitive impulsivity and alcohol
26
the form of higher response omissions and lower accuracy during variable trials on a human version of the Five-Choice Serial Reaction Time Task (Sx-5CSRTT), compared to non-bingers (Sanchez-Roige et al., 2014). Attentional impairment has also been found for abstinent alcohol-dependent patients, in the form of increased commission errors during a Continuous Performance Test (CPT), compared to healthy controls (Bjork, Hommer, Grant & Danube, 2004; Rodriguez-Jimenez et al., 2006). However, the relationship between attentional abilities and alcohol is not straightforward. For example, some studies have found that the Attentional subscale on the BIS-11 (e.g., “I don’t “pay attention”) predicts BD trajectories (Carbia et al., 2018) and is associated with higher alcohol use (Mackillop et al., 2016), while others have not found this association (Caswell et al., 2015b; Sanchez-Roige et al., 2014). In a meta-analytic study that used principal-component analysis (PCA) to generate factors of impulsivity, Sharma and colleagues (2014) posited that inattention (based on the Stroop and a version of the CPT) may not be significantly associated with problematic alcohol use.
27
ADHD (Bellgrove, Hawi, Kirley, Gill & Robertson, 2005; Castellanos et al., 2005; Castellanos, Sonuga-Barke, Milham & Tannock, 2006; Kofler et al., 2013; Kuntsi & Klein, 2011; Mullins, Bellgrove, Gill & Robertson, 2005; Vaurio, Simmonds & Mostofsky, 2009). Yet, despite associations between BD and impaired attentional function and executive function (Scaife & Duka, 2009; Townshend & Duka, 2005), the IRV measure has yet to be examined in relation alcohol use.
1.4.4.1 Brain correlates of IRV.
Several fMRI studies have examined the relationship between IRV and whole brain task-related activation during response inhibition tasks. In healthy adults, higher IRV on GNG task has been associated with increased stop-related activation in prefrontal regions [middle frontal gyrus (MFG), inferior frontal gyrus (IFG)], motor-related regions (precentral gyrus and pre-SMA), the anterior cingulate cortex (ACC), inferior parietal lobe (IPL) and thalamus (Hervey et al., 2006). Similar brain activation patterns have been observed in healthy children, with higher IRV associated with increased activation in the MFG and thalamus, while lower IRV was associated with activation in postcentral gyrus, medial frontal
gyrus, culmen, IPL and cerebellum (Simmonds et al., 2007). However, there are conflicting
28
Research posits that sustained attentional processes may emerge from an array of large-scale functional connectivity networks (Castellanos, Kelly & Milham, 2009; Kessler, Angstadt & Sripada, 2016), rather than single brain regions (Rosenberg, Finn, Scheinost, Constable & Chun, 2017). Although BOLD activation can yield insight into brain activity associated with IRV, functional connectivity – associations of synchronous fluctuations in brain signals – can identify brain regions that are engaged at the same time during a cognitive task. Sustained attention has been shown to involve the dorsal attention network (DAN; comprising intraparietal sulcus (IPS), superior parietal lobule; primate frontal eye fields, and inferior pre-central sulcus) and frontoparietal networks (Petersen & Posner, 2012; Szczepanski, Konen & Kastner, 2010). Lower IRV (i.e., better sustained attention) is associated with stronger anticorrelations between the default mode network (DMN; including medial prefrontal cortex, posterior cingulate, anterior temporal and precuneus) and task-positive networks (Kelly, Uddin, Biswal, Castellanos & Milham, 2008). The extent to which other networks outside these attentional networks contribute to sustaining attention is less well understood (Fortenbaugh et al., 2017; Glickstein, 2007), although studies examining a broader range of network connectivity have identified connectivity in regions such as the cerebellum, as being important for sustaining attention (Rosenberg et al., 2016). To date, however, the brain correlates of sustained attention in healthy adolescents, as indexed by IRV, have not been comprehensively characterised.
1.4.4.2 ADHD and IRV.
29
of alcohol use disorders (Lee, Humphreys, Flory, Liu, & Glass, 2011; Wilens & Morrison, 2011) in adulthood. ADHD, characterised by an early onset of persistent and impairing levels of inattention-disorganisation and hyperactivity-impulsivity (APA, 2000), is one of the most frequently encountered disorders during childhood and adolescence in the U.S. (Barkley, 1998), with high prevalence rates (5-10%) in children (Scahill & Schwab-Stone, 2000). ADHD during childhood or adolescence increases the risk for developing AUD or other SUDs (Lee, Humphreys, Flory, Liu, & Glass, 2011; Wilens & Morrison, 2011), and is also a risk factor for heavy alcohol use and illicit drug-use initiation in young adults (Vogel et al., 2016). Neuroimaging studies have also implicated similar neural circuits and pathways in the pathophysiology of both ADHD and SUD. For example, one review found that the comorbidity between ADHD and SUD aetiologically overlapped in relation to impairment in motivational system and inhibitory control, indicated by blunted striatal dopamine (DA) release, as well as disturbance of neural circuits between the striatum and prefrontal cortex (Frodl, 2010). Furthermore, the functional connections between brain regions that are implicated in inattention for healthy adults may also be disrupted in individuals with ADHD (Rosenberg et al., 2016).
30
dimensionality aspect to developmental disorders such as ADHD (Hudziak, Achenbach, Althoff & Pine, 2007). For example, in adolescents with just symptoms of ADHD (i.e., no diagnosis), structural differences in the brain were found to be associated with increased IRV (Albaugh et al., 2017). It is possible that similar patterns of functional impairment related to IRV that have been observed in ADHD patients, may also be found for individuals with attentional difficulties. However, this has yet to be examined. Furthermore, given the comorbidity of early ADHD and substance abuse in later life, examining neural pathways associated with attention in young adolescent samples who are relatively substance-naïve, may be important for delineating future risk.
1.4.5 Multiple measures of impulsivity
31
drinkers (Sanchez-Roige et al., 2014). Trait impulsivity (BIS-11) and waiting impulsivity (5-choice serial reaction time task) were associated with binging, whereas neither action impulsivity (SST) nor choice impulsivity (DD) differences were observed between groups. Similarly, Caswell and colleagues (2015b) examined different aspects of trait, choice and motor impulsivity in 18-25-year-old student drinkers, and found that in heavier drinkers, the number of weekly alcohol units was characterised by higher trait impulsivity (Non-planning; BIS-11), but not by motor (SST) or choice impulsivity (MCQ).
32
problems 6 months later in 287 12-13-year-olds. The mixed findings across studies may reflect differences in the age range of the samples. Alcohol misuse in early adolescence often focuses on the initiation of alcohol consumption, and perhaps the willingness to experiment, whereas research on college-age alcohol misuse tends to orient towards episodic heavy use. It is likely that different impulsivity endophenotypes underlie different patterns of alcohol misuse.
In general, increased trait impulsivity is consistently associated with alcohol-use, particularly in studies using the BIS-11 (Henges & Marczinski, 2012; Mackillop et al., 2016; Sanchez-Roige et al., 2014). However, it is difficult to reach firm conclusions on this conjecture, perhaps partly due to variations in measures used across studies and definitions of groups based on alcohol intake. Furthermore, debate continues as to how these particular endophenotypes are related to each other, and which precise domains are most relevant in generating a risk profile for alcohol misuse (Gullo et al., 2014). For example, the study from MacKillop et al. (2016) found that associations between the self-report and task-based measures were low-to-moderate, and assessment modality varied substantially across three structures. Furthermore, although sensation seeking was initially included in trait impulsivity, it did not load onto this impulsive domain (i.e., λ < .2) and its removal results in adequate fit for the three-factor model. Whether or not impulsivity and sensation seeking are dissociable constructs remains unclear, with some researchers labelling their joint presence as “disinhibited personality” (Castellanos‐Ryan, Rubia & Conrod, 2011).
33
response inhibition, as well as engagement of attention for both correct go and stop responses (Li & Sinha, 2008). It is suggested that behavioural inhibition requires suppression of a rapid, prepotent response, in order to allow for slower top-down cognitive processes that guide decisions and behaviour to lead to successful inhibitory control (Barkley, 1997; Jentsch & Taylor, 1999). Others argue that these forms of impulsivity are not overlapping, and may be mutually exclusive both at a behavioural or neurobiological level (De Wit & Richards, 2004; Winstanley, Theobald, Cardinal, & Robbins, 2004). Furthermore, another study showed that increasing task difficulty by challenging inhibitory control had a negative effect on inhibitory control (i.e., longer SSRTs), however challenging inhibitory control on other aspects of impulsivity, including reflection (decision making under conditions of uncertainty) and choice (delay of gratification) impulsivity did not adversely impact task performance (Caswell, Morgan, & Duka, 2013b). These findings further emphasise the importance of including impulsivity endophenotypes and measurements in order to establish its relationship with alcohol use.
34
ranging from moderate to no associations (Sharma et al., 2014; MacKillop et al., 2016). This may be attributable to the measures assessing slightly different constructs, or self-report measures providing a subjective interpretation of personal impulsive behaviours (Moeller et al., 2001). Indeed, it has been suggested that task-based measures of impulsivity may yield better predictors of state impulsivity than self-report questionnaires (Caswell et al., 2013a). Ideally, a multi-domain approach that includes multiple impulsivity endophenotypes as well different assessments of similar constructs (e.g., task-based DDT and self-report MCQ for choice impulsivity) would be beneficial for identifying the most pertinent predictors of alcohol misuse.
35
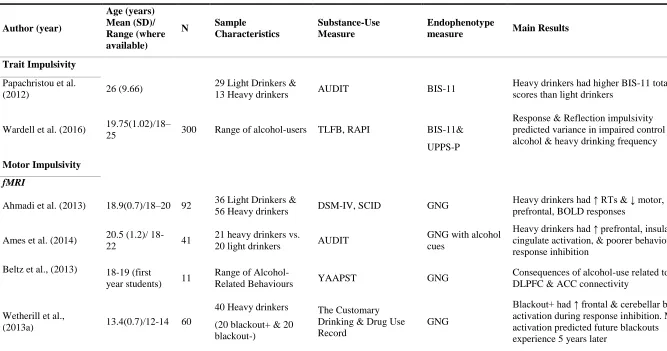
Table 1.1
Summary of reviewed studies on impulsivity endophenotypes in alcohol misuse
Author (year)
Age (years) Mean (SD)/ Range (where available)
N Sample
Characteristics
Substance-Use Measure
Endophenotype
measure Main Results
Trait Impulsivity
Papachristou et al.
(2012) 26 (9.66)
29 Light Drinkers &
13 Heavy drinkers AUDIT BIS-11
Heavy drinkers had higher BIS-11 total scores than light drinkers
Wardell et al. (2016) 19.75(1.02)/18–
25 300 Range of alcohol-users TLFB, RAPI BIS-11&
UPPS-P
Response & Reflection impulsivity predicted variance in impaired control over alcohol & heavy drinking frequency
Motor Impulsivity
fMRI
Ahmadi et al. (2013) 18.9(0.7)/18–20 92 36 Light Drinkers &
56 Heavy drinkers DSM-IV, SCID GNG
Heavy drinkers had ↑ RTs & ↓ motor, prefrontal, BOLD responses
Ames et al. (2014) 20.5 (1.2)/
18-22 41
21 heavy drinkers vs.
20 light drinkers AUDIT
GNG with alcohol cues
Heavy drinkers had ↑ prefrontal, insula & cingulate activation, & poorer behavioural response inhibition
Beltz et al., (2013) 18-19 (first
year students) 11
Range of
Alcohol-Related Behaviours YAAPST GNG
Consequences of alcohol-use related to ↑ DLPFC & ACC connectivity
Wetherill et al.,
(2013a) 13.4(0.7)/12-14 60
40 Heavy drinkers
(20 blackout+ & 20 blackout-)
The Customary Drinking & Drug Use Record
GNG
[image:56.842.70.737.143.494.2]36
Wetherill et al. (2013b)
14.4(1.2)/11.7-16.7 40
20 heavy drinkers vs.
20 non-drinkers DSM-IV, CDDR, TLFB GNG
Heavy drinkers had ↓ baseline frontoparietal, putamen, & cerebellar activation
Worhunsky et al.
(2016) 18.4(0.5)/18-19 36
18 escalating drinkers vs. 18 constant drinkers
SCID, SSAGA, MINI GNG Escalating drinkers had ↑ impulsivity &
frontoparietal activation
Whelan et al. (2012) 14.5 (.45) 1-4 lifetime uses of alcohol vs. non-drinkers
ESPAD SST ↓lateral OFC activity during successful
response inhibition
EEG
Franken et al., (2017) 23.2(9.3) 97 48 Heavy drinkers vs.
49 Light drinkers QFV GNG
No behavioural or response inhibition ERP differences, with the exception of ↓ ERN/Pe amplitude in heavy drinkers
López‐Caneda et al.
(2012) 18.7(0.5)/18-19 48
23 Binge-drinkers &
23 Controls AUDIT GNG
Bingers had ↑ NoGo-P3 amplitude at follow-up
Choice Impulsivity
Schneider et al. (2014) 14.3(0.8)/13-15 48 Healthy adolescents
ESPAD alcohol use questions (30 days, past year, lifetime)
DD
Steeper DD associated with ↑ alcohol-use & ↓reward-related activation in the nucleus accumbens & vmPFC.
Multiple Impulsivity Endophenotypes
Moreno et al. (2012) 20(1.8)18–24 66
22 Binge-drinkers, 20 Cannabis users, 26 Non-drug users
CAGE
BIS-11, SSS-V, GNG, SST, IGT, 2-choice task
Bingers had ↑ trait impulsivity & sensation-seeking & impulsive decision-making, but no SST difference
37
students users: 17 units of
alcohol/week (range 0–72)
GNG, MCQ, TCIP, SKIP
alcohol units was characterised by higher trait impulsivity (Non-planning; BIS-11), but not by motor (SST) or choice impulsivity (MCQ),
Sanchez-Roige et al. (2014)
21.18(1.89)/18-25 44
22 Binge-drinkers vs.
22 Non-binge-drinkers AUQ
BIS-11, Sx-5CSRTT, SST, TCIP
BIS-11 5x-5CSRTT ↑ associated with binging; no differences in SST & DD between groups
Mackillop et al. (2016) 21.5/18-30 1,252
Young adults with low levels of addictive behaviour AUDIT DD, MCQ, CCPT, GNG, SST, BIS-11, UPPS-P
AUDIT scores ↑ associated with trait impulsivity & choice impulsivity, but not action impulsivity.
Henges & Marczinski
(2012) 19.6(1.1)/18-21 109 Range of alcohol-users TLFB, PDHQ BIS-11, GNG
↑ trait impulsivity significant for number of drunk days; ↑ action impulsivity was significant for highest number of drinks consumed on one occasion in a month
Fernie et al. (2013) 13.3(0.3)/12-13 287 Range of alcohol-users AUQ, API DD, BART, SST
All impulsivity tasks predicted alcohol involvement 6 months later, but not vice versa
AU: Alcohol Use; API: Alcohol Problems Index; AUD: Alcohol Use Disorder; UPPS: Impulsive Behaviour Scale; TLFB: Alcohol Timeline Followback; DMQ: Drinking
Motives Questionnaire; S-MAST: The Short-Form Michigan Alcoholism Screening Test; BIS-11: Barratt Impulsiveness Scale; AUDIT: Alcohol Use Disorders Identification
Test; FrSBE: Frontal System Behaviour Scale; OFC: Orbitofrontal Cortex; VmPFC: Ventromedial Prefrontal Cortex; SPSRQ: Sensitivity of Punishment and Sensitivity of
Reward Questionnaire; YAAPST: Young Adult Alcohol Problems Screening Test; GNG: Go/No Go Task; DLPFC: Dorsolateral Prefrontal Cortex; ACC: Anterior Cingulate
Cortex; MFG: Middle Frontal Gyrus; DSM-IV: Diagnostic and Statistical Manual of Mental Disorders; SCID: Structured Clinical Interview for DSM-IV; RT: Reaction
Time; SSAGA: Semi Structured Assessment for the Genetics of Alcoholism; MINI: Mini International Neuropsychiatric Interview; CDDR: Customary Drinking and Drug
Use Record; BART: Balloon Analogue Risk Task; QFV: Quantity Frequency-Variability Index; SKIP: Single Key Impulsivity Paradigm; IMT; Immediate Memory Task;
ERP: Event-Related Potentials; Pe: Evoked Potentials; RAPI: Rutgers Alcohol Problem Index; BD: Binge-drinkers; TRAILS: Tracking Adolescents' Individual Lives Survey;
MID: Monetary Incentive Delay Task; DDHx: Drinking and Drug History Questionnaire; FH: Family History of Alcoholism; fMRI: Functional Magnetic Resonance
Figure


Related documents
Scoring Statistics for Oklahoma City University Name Yr No Tour No Rds.. Par
Company.com wants to run a Network Call-By-Call report on a Contact Center Manager Server (CCMS) Rls.. 6.0 network, which consists of three servers and an Network Control
Changing norms may change state interests and create new interests (in this case, interests in protecting non-European non- Christians and in doing so multilaterally through an
Relaxing the bench-mark assumptions allows exceptions to the case for free trade: "optimal" tariffs to manipulate world prices; "strategic" tariffs or export
emissions from Baltic and North Sea nations will be required. 2) There is compelling evidence that both nitrogen and phosphorus are important contributors to over-enrichment of
Self-induced Urinary Tract Infection in School- age Boys!. Jean Labb#{233},
Commissural axon growth cones that are initially attracted to the midline must adjust their preference once crossed to allow exit from the ventral spinal cord and to
It is also suggested that offenders who commit theft from person offences near and inside transit systems are perhaps specialised, as relationships were not found be- tween areas
