Abstract— The purpose of the present study is to develop a real option model that will enable considering not only the uncertainty of existing fossil energy prices but also the uncertainty of carbon emission right prices in evaluating the economic value of new and renewable energy R&D. In addition, using this model, the effects of the uncertainty of carbon emission right markets that have newly appeared on the economic value of new and renewable energy R&D will be empirically analyzed based on South Korean data.
Index Terms— carbon emission market, economic evaluation, renewable energy, real option, R&D
I. INTRODUCTION
MORTANT changes that appeared after major countries in the world introduced carbon emission right trading systems are the acceleration of the development of carbon reduction technologies and the activation of the renewable energy sector. These changes mean that carbon emission right trading systems are closely related to renewable energy. In fact, the EU is operating programs to financially support member countries’ low carbon and renewable energy projects with revenues obtained by selling the carbon emission rights preliminarily allocated through the NER (New Entrants Reserve) 300 program. That is, the EU prepared a link to virtuous circles of regulations and investments to utilize the revenues from charged allocation of emission rights in investments for the development of low carbon technologies and the fostering of the renewable energy sector. In particular, the said system induces the development of low carbon technologies centering on power generation companies because the energy sector is one of major carbon emission sources.
Advanced countries establish long-term policies for the renewable energy area in order to replace fossil energy by renewable energy, continuously make investments to form bases for renewable energy to directly compete with fossil
Manuscript received July 19, 2016; revised August 10, 2016. This work was supported by Basic Science Research Program through the National Research Foundation of Korea(NRF) funded by the Ministry of Science, ICT and Future Planning (NRF-2015R1A2A1A15056066).
D. J. Lee is with the Dept. of Industrial Engineering, Seoul National University, Seoul, 446-701, South Korea (corresponding author, phone: +82-2-880-7180; e-mail: leedj@ snu.ac.kr).
K-T. Kim is with the Dept. of Industrial & Management Systems Engineering, Kyung Hee University, Yongin, 446-701, South Korea (e-mail: [email protected]).
energy, and make continuous policy efforts to expand the supply of renewable energy. A problem that always accompanies large investments made in the new and renewable energy area is whether the large investments are economically feasible or not and reflecting this interest, studies that analyze the economic feasibility of investments in the new and renewable energy area are actively conducted. In particular, studies that applied the real option technique to the evaluation of the economic value of new and renewable energy mainly consider the uncertainty of fossil energy prices, electric power prices, and oil prices [1-6] Given that most of current energy supply is accounted for by fossil fuels, the uncertainty of electric power prices can be regarded as being closely related to the uncertainty of fossil energy prices. Therefore, the uncertainty considered in existing studies is mainly related to the uncertainty and this is basically because new and renewable energy and fossil energy are in a relationship of substitutional goods.
By the way, recently, many studies pointed out the fact that the factor carbon should be considered in evaluating the economic efficiency of new and renewable energy and have made efforts to reflect the factor [6, 7, 8, 9]. For instance, while evaluating the economic value of investments in wind power generation using binomial models, Cheng et al. [6] considered carbon emission reduction as an incentive for new and renewable energy power generation. A study conducted by Lee and Shih[9] considered the benefits of CO2 emission reduction while presenting a model for evaluation of the policy benefits of Taiwan’s new and renewable energy. Meanwhile, although not the area of new and renewable energy, while evaluating the economic efficiency of nuclear power generation, Kiriyama and Suzuki [7] considered the uncertainty of CO2 emission rights. These attempts have been
made because as major countries in the world introduced carbon emission right markets, additional costs became to be incurred due to carbon emissions in the case of fossil energy. Therefore, although considering only the prices of fossil energy, which is in the relationship of substitutional goods with new and renewable energy, was appropriate when evaluating the economic efficiency of new and renewable energy in the past, given the reality where economic burdens occurred due to carbon emissions, evaluation methods considering not only fossil energy prices but also carbon emission costs are necessary. However, studies of the economic efficiency of new and renewable energy that considered the factor carbon markets are still insufficient and some recent experimental studies also had a limitation as they
Economic Evaluation of Renewable Energy
R&D in the Presence of Carbon Emission
Market: Real Option Approach
Deok-Joo Lee, Kyung-Taek Kim,
Member, IAENG
could not reflect the uncertain characteristics of carbon emission right prices that are determined by demand and supply in carbon emission right markets but considered the prices as fixed prices.
The purpose of the present study is to develop a real option model that will enable considering not only the uncertainty of existing fossil energy prices but also the uncertainty of carbon emission right prices in evaluating the economic value of new and renewable energy R&D. In addition, using this model, the effects of the uncertainty of carbon emission right markets that have newly appeared on the economic value of new and renewable energy R&D will be empirically analyzed based on South Korean data.
II. MODEL
Let us assume that current energy supply sources consist of fossil energy and renewable energy, and that these two energy sources are basically in a relationship of substitutional goods. Therefore, if renewable energy prices drop, the ratio of renewable energy to the entire energy supply will increase and the ratio of fossil energy will decrease. In particular, if renewable energy prices decrease below fossil energy prices, renewable energy will have price competitiveness, and the gains obtained by using renewable energy will appear in the form of cost savings as a result of using renewable energy that is cheaper than fossil energy.
Carbon emission cost reduction occurs when renewable energy that emits less carbon than fossil energy is used, and can be calculated by multiplying carbon emission reductions by carbon emission rights prices. Carbon emission reduction values are obtained by multiplying the carbon emission reduction per unit electric power by renewable energy generation quantities. The carbon emission reduction per unit electric power can be estimated through the carbon emission factor that means carbon emissions per unit electric power as the difference between the fossil energy carbon emission factor and the renewable energy carbon emission factor. Therefore, the carbon emission cost reduction resulting from the use of renewable energy can be calculated based on the carbon emission reduction per unit electric power, the renewable energy power generation quantity, and carbon emission rights prices, as shown in the following equation:
) , ( ) , ( )} ( ) (
{CENRE t -CERE t ´REt k ´CCt j (1)
) (t
CENRE is the carbon emission factor of fossil energy
power generation at the time period t, CERE(t) is the carbon emission factor of renewable energy power generation at the time period t, RE(t,k) is the amount of power generated from renewable energy sources at the time period t if the renewable energy technology developed from an R&D program is deployed during the time period k, and CC(t,j) is the unit price of renewable energy power generation during the time period t, where j is the number of increases in unit
price during the period t.
Let us assume that renewable energy R&D (of which the economic value is evaluated in the present study) has three options - abandonment, deployment, and R&D investment -
and that if the project has been abandoned or deployed, R&D will not be implemented any further. In addition, let us assume that if investments in renewable energy R&D are selected and R&D is implemented, renewable energy prices will drop. The unit price of fossil energy power generation and the unit price of renewable energy power generation are assumed to follow geometric Brownian motion (GBM). PNRE(t,i) corresponds to the unit price of fossil energy power generation, while i is the number of increases in unit price during the period t. The initial price of fossil energy power generation is expressed as
) 0 , 0 (
NRE
P , where the unit price can have two probability
values, namely, the probability p that the unit price will increase, which is calculated by multiplying the initial price by
u
1, such that PNRE(1,1)=u1PNRE(0,0); and the probabilityp
-1 that the unit price will decrease, which is calculated by multiplying the initial price by d1 , such that
) 0 , 0 ( )
0 , 1
( 1 NRE
NRE dP
P = . The initial price of the carbon emission right is expressed as CC(0,0), where the unit price can have two probability values, namely, the probability q that the unit price will increase, which is calculated by multiplying the initial price by u2, such that CC(1,1)=u2CC(0,0), and the probability 1-q that the unit price will decrease, which is
calculated by multiplying the initial price by d2, such that )
0 , 0 ( )
0 , 1
( d2CC
CC = . We let γ be the risk-free interest rate,
1
σ
be the past volatility of the unit price of fossil energy power generation, and σ2 be the past volatility of the unit price of the carbon emission right, such that 11
σ
e u = , 1
1 1 1/
σ
e u
d = = - , 2
2
σ
e
u = , 2
2 2 1/
σ
e u
d = = - ,
1 1
1
d u
d e p
γ
-= and
2 2
2
d u
d e q
γ
-= .
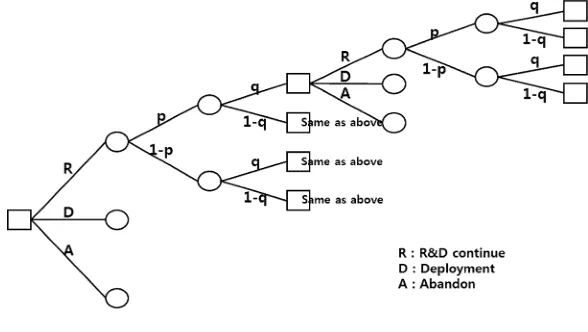
As schematized in Fig. 1, the decision-maker selects one of three alternatives (abandonment of the project, deployment, and R&D investment) in each situation.
In this scheme, when the decision-maker selects deployment or abandonment, there are no further opportunities to select alternatives. When the decision-maker selects R&D, four situations are possible based on whether fossil energy prices rise or drop and carbon emission rights prices rise or drop. In each of these situations, the decision-maker can select one of the three alternatives again one year later, such that this process occurs repeatedly.
The alternative of R&D investment is selected when the revenue obtained by deducting R&D costs from the present value of future revenues expected from investments in renewable energy R&D is larger than the revenue expected from the alternative of abandonment or deployment. Therefore, revenues from the alternative of R&D investment can be estimated by summing the R&D costs invested now and the present value of revenues expected to be obtained in future by implementing renewable energy R&D, and can be expressed as follows:
( ) ( ) ( )
{ }
(1 ){ ( 1,, 1, 1) (1 ) ( 1,, , 1)} ()
1 , , 1 , 1 1 1 , 1 , 1 , 1
t RD r
j i t V q r
j i t qV p
r j i t V q r
j i t qV p
δ ú
-û ù ê
ë é
+ + -+ + + + -+
+ + + -+ + + +
) (t
RD is the R&D expenditure for renewable energy at the time period t, and δ is the discount factor (δ=1/
(
1+γ)
, where γ is the risk-free interest rate. If the alternative of R&D investment is selected at time t, cash flow -RD(t) will occur because R&D investment costs will be spent. The future revenue expected from investment in renewable energy R&D at time t can be estimated by obtaining the present values of expected values in four situations: when the fossil energy price has risen at a probability of p and the carbon emission rights price has risen at a probability of q; when the fossil energy price has risen at a probability of p and the carbon emission rights price has dropped at a probability of(
1-q)
;when the fossil energy price has dropped at a probability of
(
1-p)
and the carbon emission rights price has risen at aprobability of q; and when the fossil energy price has dropped at a probability of
(
1-p)
and the carbon emissionrights price has dropped at a probability of
(
1-q)
.The alternative of deployment is selected when the present value of the revenue expected from the deployment of technologies developed through renewable energy R&D is larger than the revenue expected from the alternative of abandonment or R&D investment. The revenue from the alternative of deployment can be estimated by summing the deployment revenue accruing at the present point and the present value of deployment revenues expected to accrue in future, and can be expressed as follows:
( ) { ( ) ( )} ( ) ( )
( ) ( )
{ } ( )
( ) ( ) ( )
{ }
( ){ ( ) ( ) ( )}úû
ù ê ë é + -+ + + -+ + + -+ + + + + ´ -+ ´ ´ -= k r j i t q k r j i t q p k r j i t q k r j i t q p δ k t RE r t P i t P k t RE j t CC t CE t CE k r j i t RE NRE RE NRE , , , , 1 Π 1 , , 1 , , 1 Π 1 , , , 1 , 1 Π 1 , , 1 , 1 , 1 Π , , , , , , , , ,
Π (3)
(
t,i,j,r,k)
Π is the revenue of renewable energy R&D investment at time period t if the unit price of fossil energy power generation increases i times, the unit price of carbon emission rights increases j times, R&D investment r times during the time period t , and the renewable energy technology developed from an R&D program is deployed during the time period k. If the alternative of deployment is
selected at time t, deployment revenues will accrue from time
t. The deployment revenue at time t is the sum of the power use cost reduction due to the use of renewable energy that is cheaper than fossil energy and the carbon emission cost reduction resulting from carbon emission reductions. Carbon emission cost reduction occurs when renewable energy that emits less carbon than fossil energy is used, and can be calculated using the difference between the fossil energy carbon emission factor and the renewable energy carbon emission factor that means the carbon emission reduction per unit power, carbon emission rights prices, and the renewable energy power generation quantity. In the above equation,
( )
( )
{
PNRE t,i -PRE t,r}
´RE(
t,k)
corresponds to power use costreduction, and
{
CENRE( )
t -CERE( )
t}
´CC( )
t,j ´RE(
t,k)
corresponds to carbon emission cost reduction. The deployment revenues accruing after time t can be estimated by obtaining the present values of expected values in four situations: when the fossil energy price has risen at a probability of p and the carbon emission rights price has risen at a probability of q at time t+1; when the fossil energy price has risen at a probability of p and the carbon emission rights price has dropped at a probability of
(
1-q)
;when the fossil energy price has dropped at a probability of
(
1-p)
and the carbon emission rights price has risen at aprobability of q; and when the fossil energy price has dropped at a probability of
(
1-p)
and the carbon emissionrights price has dropped at a probability of
(
1-q)
. Therefore,the present value of future deployment revenues expected from time t can be expressed as follows:
(
) (
) (
)
{
}
(
)
{
(
) (
) (
)
}
úûù ê ë é + -+ + + -+ + + -+ + + + k r j i t q k r j i t q p k r j i t q k r j i t q p δ , , , , 1 Π 1 , , 1 , , 1 Π 1 , , , 1 , 1 Π 1 , , 1 , 1 , 1
Π (4)
[image:3.595.145.439.68.234.2]In the case that fossil energy prices and carbon emission rights prices continue to decline, such that the current R&D costs are judged to be larger than the revenues expected from implementing renewable energy R&D, the decision-maker can abandon the project to reduce losses. In the present study, abandoned renewable energy R&D investment costs were considered abandonment costs.
If a new technology resulting from a renewable energy R&D project has not been deployed, there are three options available at any given time t. Thus, the final option values in this study can be calculated using
( )
( )
( )
( ) ( ) ( )
{ }
( ){ ( ) ( ) ( )} ( )úú
ú ú ú ú
û ù
ê ê ê ê ê ê
ë é
-ú û ù ê
ë é
+ + -+ + + + -+
+ + + -+ + + + + -=
; 1 , , , 1 1 1 , 1 , , 1 1
1 , , 1 , 1 1 1 , 1 , 1 , 1 ; , , , , Π
; max , , ,
t RD r j i t V q r j i t qV p
r j i t V q r j i t qV p δ
k r j i t
t A r j i t V
(5)
(
ti jr)
V ,, , is the economic value of renewable energy R&D investment at the time period t if the unit price of fossil energy power generation increases i times, the unit price of carbon emission rights increases j times, and R&D investment r times during the time period t . Therefore, formula (5) compares cash flow under the three options available during an R&D project, and discovers the largest value through repeated rounds of comparison.
III. ANALYSIS
A. Data
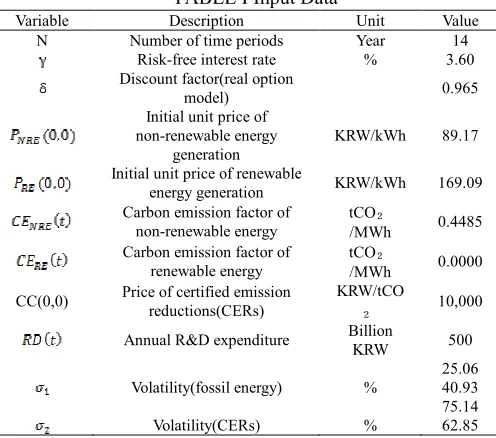
[image:4.595.46.294.413.632.2]The data used in the analyses conducted in the present study are summarized as shown in TABLE I and the details are reviewed as follows.
TABLE I Input Data
Variable Description Unit Value N Number of time periods Year 14
Risk-free interest rate % 3.60 Discount factor(real option
model) 0.965
Initial unit price of non-renewable energy
generation
KRW/kWh 89.17
Initial unit price of renewable
energy generation KRW/kWh 169.09 Carbon emission factor of
non-renewable energy
tCO₂
/MWh 0.4485 Carbon emission factor of
renewable energy
tCO₂
/MWh 0.0000
CC(0,0) Price of certified emission reductions(CERs)
KRW/tCO
₂ 10,000
Annual R&D expenditure Billion
KRW 500
Volatility(fossil energy) %
25.06 40.93 75.14 Volatility(CERs) % 62.85
B. Real Option Analysis
If the passive investment value calculated using discounted cash flow models is termed Net Present Value (NPV), the intrinsic value including the option value is termed Expanded NPV (ENPV), and the option value is termed Real Option Value (ROV), the relationships can be expressed as follows [10,11]. Therefore, it can be seen that an ENPV derived through an analysis of the real option model consist of the sum of NPV, which is a passive investment value not including any option, and ROV, which is the value of flexibility termed option.
ENPV = NPV + ROV
The purpose of the present study is to analyze the economic effects of the uncertainty of carbon emission right prices on new and renewable energy R&D. Concrete analysis procedures to that end are schematized as shown in Fig. 2. In
Fig. 2, A refers to the reduction in power costs resulting from the use of new and renewable energy instead of fossil energy, B refers to the option value resulting from the uncertainty of fossil energy prices and the flexibility of decision making, C refers to the reduction in carbon emission costs resulting from the replacement of fossil energy by new and renewable energy, D refers to the option value resulting from the uncertainty of carbon emission right prices, which is the effect of the volatility of carbon emission right prices on the economic value of new and renewable energy R&D. Therefore, the part that is to be analyzed in the present study is the part that corresponds to D in Fig. 2, which can be derived by comparing the results of analyses conducted considering and without considering the volatility of carbon emission right prices in the multi-dimensional real option model presented in the present study. Concretely, the results of analysis conducted simultaneously considering the volatility of fossil energy prices and the volatility of carbon emission right prices in the real option model correspond to ‘A+B+C+D’ in Fig. 2
[image:4.595.139.373.668.749.2]while the results of analysis conducted after setting the volatility of carbon emission right prices to 0 correspond to ‘A+B+C’ in Fig. 2 because the option value due to the uncertainty of carbon emission right prices does not occur. Therefore, the option value resulting from the uncertainty of carbon emission right prices will be derived by deducting the results of analysis conducted after setting the volatility of carbon emission right prices to 0 in the real option model from the results of analysis conducted simultaneously considering the volatility of fossil energy prices and the volatility of carbon emission right prices in the real option model.
One of the most important factors in analyses using real option models is volatility necessary to reflect uncertainty. South Korean fossil energy power generation records indicate that most of power generation other than nuclear power relies on coal (bituminous coal, anthracite), natural gas (LNG), and petroleum (light oil, heavy oil). Therefore, in the present study, to estimate the uncertainty of fossil energy prices, the volatility of the prices of coal, natural gas, and petroleum was estimated to establish volatility scenario.
- Standard volatility scenario: 40.93% - Low volatility scenario: 25.06 % - High volatility scenario: 75.14 %
In the present study, the volatility of carbon emission right prices was estimated based on the carbon emission right prices for trading at the Chicago Climate Exchange (CCX) and a carbon emission right price volatility value of 62.85% was applied for six years from January 2004 to December 2009.
The economic value of new and renewable energy R&D was empirically analyzed using the real option model that considered fossil energy price uncertainty and carbon emission right price uncertainty and according to the results, the ENPV of new and renewable energy R&D ranged from 8,653.8 billion KRW to 29,859.2 billion KRW and the ENPV of new and renewable energy R&D increased as the volatility of fossil energy prices increased. The option value resulted from the uncertainty of carbon emission right prices ranged from 302.6 billion KRW at the minimum to 524.4 billion KRW and the option value increased as the volatility of fossil energy prices decreased. That is, the results of the analysis indicated that when the volatility of fossil energy prices was lower, the volatility of carbon emission right prices had larger effects on the economic value of new and renewable energy R&D.
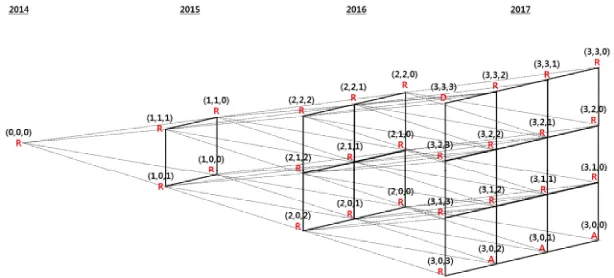
The result of schematization of optimal decisions for the standard volatility scenario as a representative case among fossil energy price volatility scenarios is shown in Fig. 3. In
Fig. 3, ‘A’ means abandonment, ‘D’ means deployment, and ‘R’ means R&D investment. (t,i,j) refers to cases where fossil energy prices rose i times and carbon emission right prices rose j times at time t. To review optimal decisions, in 2014, R&D investment is an optimal decision and in 2015 and 2016 too, continuously making investments in R&D regardless of the rises or drops of fossil energy prices and carbon emission right prices is an optimal decision. It can be seen that, if fossil energy prices drop and carbon emission right prices drop one or more times until 2017, selecting abandonment should be optimal and if fossil energy prices continuously rise until 2017, deploying the technologies developed through R&D is an optimal decision.
To review in detail, in cases where fossil energy prices drop and carbon emission right prices drop one or more times until 2017, even if investments are made in new and renewable energy R&D, new and renewable energy prices will decrease so that expected values of revenues will be smaller than the current R&D costs. Therefore, the decision maker becomes to select the alternative abandonment in order to reduce losses. Since the new and renewable energy power generation
quantity that can be secured in future increases in cases where developed technologies are deployed earlier, if new and renewable energy is more competitive in price compared to fossil energy, the decision maker can select whether to secure larger new and renewable energy generation quantities in future while maintaining the new and renewable energy prices at the current level or to increase revenues per unit power by reducing new and renewable energy price while bearing some losses of new and renewable energy generation quantities than can be secured in future. If the revenue resulting from securing larger new and renewable energy generation quantities in future while maintaining the new and renewable energy prices at the current level is higher, the decision maker will select deployment and if the revenue resulting from increasing revenues per unit power by reducing new and renewable energy price while bearing some losses of new and renewable energy generation quantities than can be secured in future is higher, the decision maker will select R&D investment. Therefore, in cases where fossil energy prices continuously rise until 2017, the revenue that can be obtained by selecting deployment should be higher than the revenue that can result from R&D investments so that the decision maker becomes to select the alternative deployment.
As a result of whole period analysis, in the case of the standard scenario among fossil energy price volatility scenarios, the first time to review the application of the technologies developed through new and renewable energy R&D is 2017, the ENPV of new and renewable energy R&D is 16,229.9 billion KRW, and the ROV resulting from the uncertainty carbon emission right prices is 443.4 billion KRW according to the results of analyses. These results can be regarded as indicating the fact that the economic value of new and renewable energy R&D can be enhanced further thanks to the introduction of carbon emission right systems.
IV. CONCLUSION
To review the direction of future studies, the present study assumed that new and renewable energy prices would be reduced by 3% every year through R&D. However, since the efficiency of R&D varies with the amount of investments in R&D, the decreasing rates of new and renewable energy prices will differ accordingly. Therefore, studies reflecting the relationship between the amounts of investments in R&D and the decreasing rates of new and renewable energy prices are necessary and the results may be improved by applying models such as learning curve models. In addition, since the present study assumed the carbon emission factor of new and renewable energy as 0, actual carbon emission factors of new and renewable energy should applied in new studies and studies considering the relationship between new and renewable energy R&D and carbon emission factors are necessary. Finally, although the present study assumed that fossil energy prices and carbon emission right prices are independent from each other, if data on carbon emission right prices for trading in carbon emission right markets are sufficiently secured, the correlation between the two prices should be analyzed and the results should be reflected on models.
REFERENCES
[1] Fleten, S. E., & Maribu, K. M. (2004). Investment timing and capacity choice for small-scale wind power under uncertainty. In Proceedings of the Seventh IASTED International Conference on Power and Energy Systems, Clearwater Beach, Florida, USA. 2004
[2] Muñoz, J. I., Contreras, J., Caamano, J., & Correia, P. F. (2009, June). Risk assessment of wind power generation project investments based on real options. Proceedings of 2009 IEEE Bucharest Power Technology Conference, Jun. 28 – July 2, Bucharest, Romania. 2009 [3] Lee, S. C. (2011). Using real option analysis for highly uncertain
technolo gy investments: The case of wind energy technology. Renewable and Sustainable Energy Reviews, 15(9), 4443-4450. [4] Lee, S. C., & Shih, L. H. (2011). Enhancing renewable and sustainable
energy development based on an options-based policy evaluation framework: case study of wind energy technology in Taiwan. Renewable and Sustainable Energy Reviews, 15(5), 2185-2198. [5] Zhou, H., Hou, Y., Wu, Y., Yi, H., Mao, C., & Chen, G. (2007,
September). Analytical assessment of wind power generation asset in restructured electricity industry. In Universities Power Engineering Conference, 2007. UPEC 2007. 42nd International (pp. 1086-1092). IEEE.
[6] Cheng, H. M. K., Hou, Y., & Wu, F. F. (2010, July). Wind power investment in thermal system and emissions reduction. In Power and Energy Society General Meeting, 2010 IEEE (pp. 1-8). IEEE. [7] Kiriyama, E., & Suzuki, A. (2004). Use of real options in nuclear
power plant valuation in the presence of uncertainty with CO2
emission credit. Journal of nuclear science and technology, 41(7), 756-764.
[8] Davis, G. A., & Owens, B. (2003). Optimizing the level of renewable electric R&D expenditures using real options analysis. Energy Policy, 31(15), 1589-1608.
[9] Siddiqui, A. S., Marnay, C., & Wiser, R. H. (2007). Real options valuation of US federal renewable energy research, development, demonstration, and deployment. Energy Policy, 35(1), 265-279. [10] Kim, K. T., Lee, D. J., & Park, S. J. (2014). Evaluation of R&D
investments in wind power in Korea using real option. Renewable and Sustainable Energy Reviews, 40, 335-347.
[11] Trigeorgis, L. (1996). Real options: Managerial flexibility and strategy in resource allocation. MIT press.
D-J. Lee received B.E., M.S. and Ph. D. degree in the Dept. of Industrial Engineering from Seoul National University, South Korea. After working at Waseda University as a post-doctoral researcher (Tokyo, Japan), he joined a faculty member of Kyung Hee University from 2000 to 2015. Currently he is a professor of the Dept. of Industrial Engineering, Seoul National University. His research interests include investment analysis using real option, economic analysis of technological systems, and applied game theory in network economics.
[image:6.595.145.452.52.191.2]
K-T Kim received B.E., M.S. and Ph. D. degree in Industrial Engineering from Kyung Hee University, South Korea. Now he is a post-doctoral researcher in the Dept. of Industrial & Management Systems Engineering, Kyung Hee University. His research interests include economic analysis of energy technology and real option analysis.D