Zoran Rumboldt, Riyadh Al-Okaili, and John P. Deveikis
BACKGROUND AND PURPOSE: Differentiation of malignant from benign head and neck lesions is often very difficult on imaging studies, especially in patients with treated cancer. We evaluated the feasibility and reproducibility of perfusion CT (CTP) after enhanced head and neck CT and attempted to differentiate benign from malignant processes.
METHODS: CTP was attempted in 17 patients after head and neck contrast-enhanced CT. Data were postprocessed by using deconvolution-based perfusion analysis. Ipsilateral and contralateral internal, external, and common carotid arteries were used as arterial input vessels. Postprocessing-generated maps showed mean transit time (MTT), blood volume, blood flow, and capillary permeability surface product. Two readers independently placed regions of interest through the primary site, salivary glands, thyroid gland, paraspinous muscles, muscles of mastication, sternocleidomastoid muscle, base of tongue, and subcutaneous fat. One reader repeated the measurements on separate dates. Data were statistically analyzed, and histologic specimens were obtained.
RESULTS: CTP was not possible in four patients, and one was lost to follow-up. Of the remaining 12, five had cancer, and seven had benign processes. We found no significant interreader or intrareader differences and no significant difference between various input vessels. Differentiation between malignant and nonmalignant lesions was most reliable by using MTTs. Measurements were comparable to those in the literature.
CONCLUSION: CTP after enhanced head and neck CT is feasible, except perhaps at the laryngeal level. It appears to be reader independent and reproducible regardless of the input vessel. CTP shows promise in distinguishing benign and malignant processes, primarily by means of MTTs.
CT and MR imaging are routinely used to diagnose and stage cancers of the head and neck and to eval-uate treated patients with suspected recurrence. Re-liance on anatomic imaging has its drawbacks, as early lesion detection remains challenging, and nonneo-plastic processes can morphologically mimic large le-sions. This challenge is further compounded in pa-tients who have undergone surgery or irradiation and who have a background of anatomic distortion, which can preclude the early detection of recurrent neo-plasm. Tissue biopsy for pathologic confirmation is invasive, associated with a risk of hemorrhage and infection, and not infrequently limited by sampling error; however, it remains a necessary step in many cases. Several approaches have been devised to
per-form functional imaging to overcome the limitations of anatomic imaging. Most notable among these is the use of positron emission tomography (PET). How-ever, PET is not widely available and represents an extra step with substantial added cost. Perfusion CT (CTP) is a new approach that shows promise in over-coming some of these limitations.
Induction of neovascularity is a feature of malig-nant neoplasms that is essential in sustaining these tumors and allowing for their rapid growth. In theory, perfusion-based imaging is used to take advantage of neovascularity to discriminate benign structures from aggressive lesions and might help with the early de-tection of malignancy, the prediction of tumor behav-ior, and the assessment of responses to therapy.
CT and MR imaging perfusion parameters can be generated by using a number of approaches, which can be grouped into two major methods: compart-mental analysis and deconvolution-based methods. Detailed mathematical and physical principles behind these methods of calculation are available for review in the literature (1– 6). In compartmental analysis, one considers the intravascular and extravascular
Received July 16, 2004; accepted after revision October 14. From the Department of Radiology, Medical University of South Carolina, Charleston.
Address reprint requests to Zoran Rumboldt, MD, Department of Radiology, Medical University of South Carolina, 169 Ashley Avenue, P. O. Box 250322, Charleston, SC 29425.
©American Society of Neuroradiology
spaces as a single compartment, which is valid for the time points before the arrival of the contrast medium into the draining veins of the tissue of interest. Blood flow is calculated from the maximal slope of the tissue concentration-time curve or from its peak height and normalized to the arterial input function (1, 3). De-convolution uses arterial and tissue time-attenuation curves to calculate the impulse residue function for the tissue of interest, which is usually constrained to comprise a plateau followed by a single exponential decay. The height of the function gives the tissue blood flow and the area under the curve determines the relative blood volume (1, 3, 7).
The purpose of this study was to evaluate the fea-sibility of CTP in the head and neck and to evaluate interreader and intrareader reproducibility. The re-sults from various arterial input vessels were com-pared for significant differences. We looked into the reliability of performing CTP after regular enhanced CT and compared the results with those in recent publications. In addition, results from benign and malignant processes were compared.
Methods
Patients
We prospectively attempted CTP in 17 consecutive patients with known or suspected head and neck neoplasm between October and December 2003 as part of a pilot feasibility study that was approved by our institutional review board. In all patients, biopsy was performed after the imaging study.
Imaging
CTP scans were obtained by using a multisection scanner (Light speed Ultra; GE Medical Systems, Milwaukee, WI) after we performed regular enhanced CT of the head and neck. For this study, 100 mL of contrast agent was injected at a rate of 2 mL/second and images were acquired from the skull base to the thoracic inlet with 2.5-mm contiguous sections. CTP was at-tempted in 17 patients 5 minutes later. The initial regular diagnostic CT scans served as localizers for CTP, and a few minutes were needed to review the images and position for the CTP study. Five minutes was selected to standardize the time
between the two studies. For the CTP study, patients received a power injection of nonionic iodinated contrast agent (iohexol; Omnipaque, Amersham Health Inc., Princeton, NJ) (40 mL, 300 mg/mL) at 4 mL/s and were scanned to acquire four contiguous 5-mm-thick CT images every second for 50 seconds at the predetermined levels of interest. The levels of interest were centered on the area of gross anatomic distortion when a lesion was identified. For lesions larger than 10 mm in diame-ter, the levels with the largest enhancing portions were se-lected. In patients with no defined lesion on the regular en-hanced CT scans, perfusion images were obtained through the areas that were clinically suspicious.
Data Processing
The data were postprocessed by using a commercial soft-ware package based on a deconvolution-based technique (Per-fusion 2 software package, Advantage Windows workstation; GE Medical Systems). Two readers (Z.R., R.A.) independently performed the postprocessing after agreeing on the structures of interest and on the size of the region of interest (ROI), (i.e.,
⬎25 mm2). ROIs were placed in available arterial input vessels and in the internal jugular vein to generate contrast-enhanced curves. In each patient, each reader generated three sets of calculations, as different available input arterial vessels were selected for each calculation. The vessels were the internal carotid artery (ICA) on the same side of the lesion, the con-tralateral ICA, and the external carotid artery (ECA) on the side on which it was better visualized. In some patients, only the common carotid artery could be used as the arterial input vessel.
The data were processed into maps for each arterial input that represented blood volume mean transit time (MTT) (in seconds), blood volume (in milliliters per 100 g), blood flow (in milliliters per 100 g per minute), and capillary permeability surface product (CP, in milliliters per 100 g per minute) (Figs 1– 4). Blood flow was defined as the volume flow rate of blood through the vasculature in a tissue. Blood volume was the volume of blood within the vasculature of a tissue that was flowing and not stagnant. MTT was the average time taken by the blood elements to traverse the vasculature from the arterial end to the venous end. CP was the product of permeability and the total surface area of capillary endothelium in a unit mass of tissue representing the total diffusional flux across all capillar-ies. It was calculated according to the following equation: CP⫽
⫺blood flow[ln (1⫺E)], where E is the extraction fraction (the fraction of contrast material that leaks into the extravascular space from the intravascular space).
The readers subsequently obtained ROIs through the
pri-FIG 1. Patient 8 with atypical vascular proliferation of the vocal cord.
A, Contrast-enhanced neck CT scan shows a mass in the left true vocal cord. ROIs 9 and 11–13 are in the lesion, and ROI 10 is in the contralateral vocal cord.
B, CTP functional map shows a relatively low blood flow of 26 –32 mL/100 g/min in the lesion in the left vocal cord. Right vocal cord has blood flow of 26 mL/100 g/min.Scalefrom red to blue corresponds to decreasing flow.
mary site (lesion or suspected lesion) and through other struc-tures that appeared normal on regular enhanced CT scans of the head and neck: salivary glands (parotid or submandibular glands), thyroid gland, paraspinous muscles, muscles of masti-cation, sternocleidomastoid, base of the tongue, and subcuta-neous fat (Figs 1– 4). One reader performed measurements twice, 2 weeks apart, by using the ipsilateral ICA as the input vessel. The structures of interest were not available on all scans due to limited coverage on CTP. The average values of blood volume, blood flow, MTT, and CP were obtained for the pri-mary site, salivary glands, thyroid gland, paraspinous muscles, muscles of mastication, sternocleidomastoid, base of the tongue and subcutaneous fat.
Statistical Analysis
We compared the measurements obtained from different readers, and different input arterial vessels for each of the perfusion parameters (MTT, blood volume, blood flow, CP) and for each of the measured structures (primary site, sali-vary glands, thyroid gland, paraspinous muscles, muscles of
mastication, sternocleidomastoid, base of the tongue, and subcutaneous fat). This was done to evaluate for statistically significant interreader differences and for statistically signif-icant differences between CTP with ICA-versus-ECA arte-rial vessel input or a difference when the side of the input vessel was changed. In addition, differences between malig-nant and benign lesions and normal structures were as-sessed. Comparison with published measurements of perfu-sion parameters was performed. Statistical analysis of variability was determined by one-way analysis of variance. Statistical analysis of the observed differences between var-ious tissues was performed with the unpairedttest.
Results
CTP was feasible in 13 (76%) of 17 attempts and in two (40%) of five attempts at the laryngeal level. In four patients, CTP was not feasible: In one, bolus timing was poor, and in three, the studies were limited by laryngeal motion, which resulted in
FIG 2. Patient 3 with surgically treated acinic cell cancer of the parotid gland.
A, Rater 1. Contrast-enhanced neck CT scan shows a mass in the suboccipital subcutaneous fat (arrow) that was a suspected metastatic lymph node. Histology showed fat necrosis and chronic inflammation. ROIs are placed on the lesion (1) and on the masseter (3) and paraspinal (5) muscles.
B, Rater 2. CTP functional map shows relatively low blood flow of 24.9 mL/100 g/min in the lesion (arrow,ROI1) and shows ROIs in the masseter (4) and paraspinal (8and9) muscles.Scalefrom red to blue corresponds to decreasing flow.
C, Rater 2. CTP functional map shows that the lesion (arrow,ROI1) has a relatively long MTT of 10.5 seconds and shows ROIs in the masseter (4) and paraspinal (8and9) muscles.Scalefrom red to blue corresponds to increasing MTT.
FIG 3. Patient 12 with primary gingival squamous cell cancer.
A, Contrast-enhanced neck CT scan shows a mass on both sides of the left mandibular body (arrows).
B, Lesion is more conspicuous on the CTP functional map, which reveals a high blood flow of 96 –144 mL/100 g/min.Scalefrom red to blue corresponds to decreasing flow.
unsatisfactory enhancement curves. Of the remain-ing 13 patients, five had histologically confirmed new cancers or recurrences, seven had benign find-ings, and one was lost to follow-up. Therefore, our study group included 12 patients (eight men and four women; age range, 17– 80 years; mean age, 55 years). Table 1 summarizes the patients’ character-istics and diagnoses.
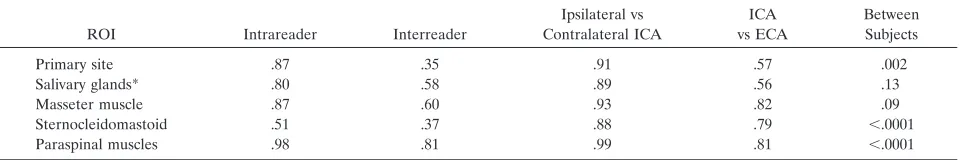
The measurements were analyzed for reproducibil-ity between different readers, the same reader on two occasions, and various arterial input vessels. Table 2 summarizes the results of this analysis. Application of the one-way analysis of variance revealed no statisti-cally significant interreader difference, and we found no significant difference between CTP with ICA-ver-sus-ECA input, between measurements of one reader
on two occasions, or between the ipsilateral and con-tralateral ICA as the input artery. Although the sta-tistical test failed to show a significant difference in these mentioned parameters, it was able to reveal significant differences in measurements between pa-tients for most structures. The primary-site lesions included retromolar trigone squamous cell cancer, gingival squamous cell cancer, squamous cell cancer on the floor of the mouth, recurrent squamous cell cancer of the larynx, orbital alveolar rhabdomyosar-coma, parotid pleomorphic adenoma, atypical vascu-lar proliferation in the vocal cords, fat necrosis and inflammation, and active chronic inflammation of the hypopharynx. None of the lesions had necrotic areas on contrast-enhanced diagnostic CT. No adverse re-actions to the contrast agent were encountered. Not
FIG 4. Patient 13 with recurrent laryngeal squamous cell cancer previously treated with radiation.
A, Contrast-enhanced neck CT scan shows thickening and diffuse enhancement of supralaryngeal structures. ROIs1and2are placed bilaterally in the abnormality. Both sampled sites were positive for recurrence on histology. ROI4is in the left sternocleidomastoid muscle.
B, CTP functional map reveals areas of increased perfusion with blood flows of 67 and 77 mL/100 g/min.Scalefrom red to blue corresponds to decreasing flow.
[image:4.585.57.534.59.177.2]C, CTP functional map shows short MTTs of 2.5 and 3.4 seconds in the abnormality.Scalefrom red to blue corresponds to decreasing MTT.
TABLE 1: Summary of the study group
Patient/Age (y)/Sex Pathology History
1/74/M Retromolar trigone squamous cell cancer Not applicable
2/28/M Fat necrosis Surgically treated parotid gland acinic cell cancer
3/43/M Floor-of-the-mouth squamous cell cancer Not applicable
4/56/M Granulation tissue, chronic inflammation Oropharyngeal squamous cell cancer treated with chemoirradiation
5/17/F Parotid pleomorphic adenoma Not applicable
6/63/M Chronic inflammation Diffuse large cell B lymphoma treated with chemotherapy
7/40/M Vocal cord, atypical vascular proliferation Not applicable
8/74/F Goiter Not applicable
9/68/M Orbital alveolar rhabdomyosarcoma Not applicable
10/56/F Active chronic inflammation of hypopharynx Not applicable
11/58/M Gingival squamous cell cancer Not applicable
12/80/F Recurrent larynegeal squamous cell cancer Previously treated with chemoirradiation
TABLE 2:PValues from analysis of variance
ROI Intrareader Interreader
Ipsilateral vs Contralateral ICA
ICA vs ECA
Between Subjects
Primary site .87 .35 .91 .57 .002
Salivary glands* .80 .58 .89 .56 .13
Masseter muscle .87 .60 .93 .82 .09
Sternocleidomastoid .51 .37 .88 .79 ⬍.0001
Paraspinal muscles .98 .81 .99 .81 ⬍.0001
[image:4.585.55.538.278.421.2] [image:4.585.55.535.451.531.2]all of the structures were measured in all subjects because of the limited available coverage of the CTP images.
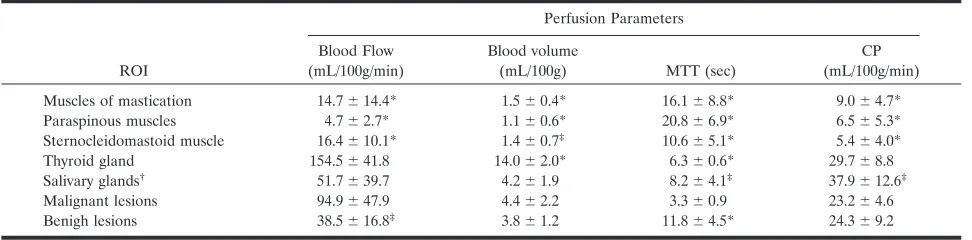
Table 3 summarizes of the results for blood flow, blood volume, MTT, and CP. Measurements in the subcutaneous fat and base of the tongue provided highly variable results ranging from 0 to the highest values. On closer inspection, we frequently observed substantial motion in these areas, which at least partly explained the variability. Minimal repositioning of ROI lead to major changes in the values in the sub-cutaneous fat, which presumably depended on pres-ence of vascular structures in the ROI. Therefore, measurements in the subcutaneous fat and at the base of the tongue were considered unreliable and ex-cluded from further analysis. As seen in Table 3, muscles had low blood volume, blood flow, and CP and a long MTT. Malignant lesions and muscles clear differed in all measured parameters.
Unpairedttest analysis showed a significant differ-ence between the malignant lesions and salivary glands in MTT (P⫽.008) and CP (P⫽.011), with the normal glands having relatively longer MTT and higher CP. Significant differences were also observed between the malignant and benign lesions in blood flow (P⫽ .032) and especially in MTT (P⫽ .0005), with benign processes having lower blood flows and longer MTTs. In the thyroid gland, MTT was longer than that of malignancies (P⫽.0007). Blood volumes in the salivary glands, benign lesions, and malignant tumors notably overlapped. Differences in blood vol-umes between the thyroid gland and malignancies were significant (P⫽.0004), with the normal thyroid gland having higher volumes.
No malignant lesion had a MTT longer than 5.5 seconds. All lesions with MTT slower than 3.5 seconds were malignant, and malignant lesions with MTT of 3.5–5.5 seconds differed from the nonmalignant lesions by having a CP of less than 25 mL/100 g/min.
Discussion
Perfusion can be defined as the blood flow through a tissue of interest per unit of volume. Our CTP
technique was based on the central volume principle, which related blood flow, blood volume, and MTT as follows: blood flow ⫽ blood volume/MTT. After an intravenous bolus injection of an iodinated contrast agent, attenuation changes in vessels and tissue can be observed during the first pass by means of rapid (dynamic) image acquisition at a given anatomic level. Time-attenuation curves can then be con-structed for reader-defined ROIs. Within the limits of some assumptions, tissue perfusion can be estimated on the basis of the observed attenuation changes: The time course of the iodine concentration is a measure of the regional perfusion, and this concentration is linearly correlated to tissue attenuation values, as seen on CT. Several algorithms and mathematical techniques may be applied to measure tissue perfu-sion with CT. The deconvolution-based calculation of these parameters is the method we used. Compared with other methods, deconvolution analysis is less sensitive to noise, requires lower injection rates, and is more reliable for measurement of low perfusion values (1, 3, 7, 8). Deconvolution of arterial and tissue enhancement curves is a complex mathemat-ical process that gives the blood flow as the height of the plateau, whereas blood volume is calculated as the area under the curve. The equation MTT ⫽ blood volume/blood flow can then be used to obtain the MTT.
With MR imaging, tumor perfusion can be appreci-ated with a dynamic acquisition of T1- or T2*-weighted images through the tumor after a bolus injection of gadolinium-based contrast material. The pharmacoki-netic behavior of gadolinium-based agents is similar to that of iodinated contrast agents. With this method, absolute quantification of tumor perfusion is difficult because signal intensity and the gadolinium concentra-tion are not linearly related (9 –12).
CTP applications were almost exclusively con-ducted for research until a number of CT manufac-turers released commercial software packages, facili-tating its clinical use. It has found an important role in evaluation of the CNS, especially for evaluating pa-tients with stroke, for assessing the risk of stroke when vascular surgery is planned, and for examining
Malignant lesions 94.9⫾47.9 4.4⫾2.2 3.3⫾0.9 23.2⫾4.6
Benigh lesions 38.5⫾16.8‡ 3.8⫾1.2 11.8⫾4.5* 24.3⫾9.2
Note.—Data are the mean⫾standard deviation. CP⫽capillary permeability surface product. *P⬍.001, malignant lesions vs other structures.
†
Parotid and submandibular glands.
‡
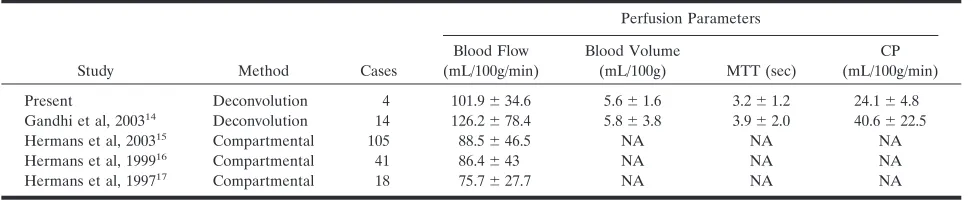
[image:5.585.53.539.70.190.2]brain tumors (1–7, 8, 12, 13). To our knowledge, only one previous group studied CTP of head and neck squamous cell carcinomas (SCCs) by using the decon-volution method (14), and a few performed compart-mental analysis of head and neck SCCs (15–17), as summarized in Table 4. We evaluated one case of rhabdomyosarcoma that had somewhat decreased blood flow, in addition to four cases of SCC.
Our results show that CTP of the head and neck is feasible except at the laryngeal level, at least in some cases. Three of four patients with uninterpretable CTP data had lesions of larynx or hypopharynx, where CTP was severely compromised by breathing and swallowing artifacts. These artifacts are a conse-quence of a relatively long study time of 50 seconds, and CTP was successful in only two (40%) of five attempted cases at this level. CTP in other areas of the head and neck was not as severely hampered by these artifacts. Poor bolus timing was the cause in the fourth patient, who was one of our first patients; this outcome was likely due to some inexperience.
In most reported studies, CTP was performed with no contrast material in the patients’ system, as it is a hypothetical confounding factor in CTP calculations that may potentially cause underestimation of micro-vascular permeability (18). In our method, CTP fol-lowed routine diagnostic enhanced CT of the neck. Comparison of our values in head and neck SCCs with those in the literature indicated that a preceding contrast-enhanced study may not substantially affect CTP (Table 4). The practical advantage of perform-ing CTP after the routine CT is obvious, as target levels for CTP can be better defined by reviewing the enhanced anatomic images first. In addition, the pa-tient is not subjected to the added radiation of the nonenhanced neck CT, which may be used to plan the levels of coverage for CTP. Performing CTP after routine CT may affect capillary permeability values, however image acquisition times of at least 2 minutes would be needed for adequate assessment of the CP (3). Some have argued that the ideal arterial input vessel for CTP calculations is the ECA, as head and neck tumors typically derive their blood supply from this vessel. We found no significant difference when the ICA was used instead. In addition, we did not find a significant difference with the arterial input vessels on either side. The ability to use the ICA instead of the ECA makes CTP more robust and adds great flexibility. The ECA is more challenging to define
than the ICA, and it is more sensitive to motion artifact, resulting in inaccuracies on CTP. CTP was reproducible, with no significant intrareader or inter-reader variability.
For normal structures (excluding the thyroid and salivary glands), the blood volume, blood flow, and CP where clearly lower than those for malignant le-sions, and all normal structures without exception (including the thyroid and salivary glands) had long MTTs relative to malignant lesions. Excluding the thyroid and salivary glands, we observed significant differences between malignant lesions and normal structures in all four parameters; malignant lesions tended to have higher blood volumes, blood flows, and CPs, but the difference was most reliably seen with MTTs (Figs 1– 4). The thyroid and salivary glands had high blood volumes, blood flows, and CPs, with some overlap with values seen in malignant le-sions. These structures also had a short MTT relative to those of other anatomic structures and benign lesions, but the MTTs were not as short as observed in malignant tumors.
CPs, blood volumes, and blood flows for benign lesions overlapped those of malignant tumors, but MTT values clearly differed (Figs 1– 4). A short MTT reflects high perfusion pressure, which represents rel-atively high blood flow with relrel-atively low blood vol-ume. This situation indicates a large pool of stagnant blood in the lesion and is likely due to increased capillary leakiness, which may explain why MTTs ap-peared to be reliable in distinguishing malignant tu-mors from benign lesions in our study. If this assump-tion proves true, CP values (along with long imaging times and associated motion artifacts) may possibly not be needed to assess tumor perfusion.
[image:6.585.53.539.70.170.2]The elevated blood flows, blood volumes, and CPs and the short MTTs in malignant lesions were most probably due to tumor neovascularity. Although blood flow and MTT differed between malignant and benign lesions, our results unexpectedly failed to show a high CP in malignant lesions. The initial pres-ence of contrast medium and the relatively short ac-quisition times could explain our relatively low CP values in malignant lesions. Gandhi et al (14) com-mented on the wide range of CPs and postulated that this is due to differing biologic properties of tumors. Comparison of their blood flow, blood volume, and MTT values showed that our standard deviation was TABLE 4: Values from perfusion CT studies of head and neck squamous cell cancers to date
Study Method Cases
Perfusion Parameters
Blood Flow (mL/100g/min)
Blood Volume
(mL/100g) MTT (sec)
CP (mL/100g/min)
Present Deconvolution 4 101.9⫾34.6 5.6⫾1.6 3.2⫾1.2 24.1⫾4.8
Gandhi et al, 200314 Deconvolution 14 126.2⫾78.4 5.8⫾3.8 3.9⫾2.0 40.6⫾22.5
Hermans et al, 200315 Compartmental 105 88.5⫾46.5 NA NA NA
Hermans et al, 199916 Compartmental 41 86.4⫾43 NA NA NA
Hermans et al, 199717 Compartmental 18 75.7⫾27.7 NA NA NA
blood volumes. Therefore, discrimination of malig-nant tumors from normal structures (and benign le-sions) on the basis of blood volume may not be as reliable in the head and neck as it is in the brain.
Apart from numerical differences, malignant le-sions tended to clearly stand out on the color maps (Fig 3), allowing for a quick overview of the whole plane. As with any other functional result, this finding should not be used in isolation, but rather, inter-preted in conjunction with the anatomic images.
Some have postulated that relative values are more important than absolute values (14). Although time may prove this to be true, an absolute value is more practical to use. In our patients, no malignant lesion had a MTT longer than 5.5 seconds. All lesions with a MTT of less than 3.5 seconds were malignant, and malignant lesions with an MTT of 3.5–5.5 seconds differed from benign lesions in that they had a CP of less than 25 mL/100 g/min. Reliability of these cutoff values must be evaluated, and we are currently testing this in a prospective study. In addition to testing MTT as a discriminator between benign and malignant pro-cesses, we will examine the use of blood flow as a predictor of tumor radiation sensitivity, as others have suggested (15–17, 18, 19). Response to radiation therapy is linked to oxygenation of the target tissue. Tumor perfusion and tumoral oxygen concentration are factors that are usually strongly linked. Although CT-determined primary tumor volume has been shown to be an important predictor of local control for several head and neck cancers, the perfusion rate was found to be independent of tumor volume in that regard as well (11, 12, 18, 19). Some have also postulated that CP might have potential value in predicting the local delivery of chemotherapeutic agents (1–3, 10).
Perfusion parameters seem to overlap for malig-nant lesions, the salivary glands, and the thyroid gland. This overlap may present a challenge in eval-uating malignant lesions invading or arising from these organs. However, these organs are easily iden-tifiable on an anatomic basis, and they are not ex-pected to be a source of confusion as long as the primary lesion of interest is outside them.
The reproducibility of brain CTP studies over time has ranged from 15% to 35% in animal studies, and a single study in patients demonstrated 13% variability between examinations performed 24 hours apart (1, 3). The absolute measurement of perfusion in a nor-mal tissue or tumor depends on the cardiac output, which may vary over time, likely explaining the ob-served variability. A possible solution that Miles et al
helpful in cases in which the benign or malignant nature of the tumor is unclear, sometimes even after pathologic analysis of tissue biopsy samples. Although PET is currently the study of choice, CTP might also be useful in evaluating an unknown primary tumor in patients with metastatic neck lymph nodes. However, for CTP to meet this objective, some technical ad-vances are necessary; the main limiting factor is the small area of coverage currently provided (i.e., only 2 cm in the craniocaudal direction), which may be in-creased to 4 cm with acquisitions at one-half of the time points (13).
Conclusion
CTP after a routine head and neck enhanced CT is feasible except perhaps in the larynx, where three of five attempts failed. CTP appears to be reproducible with no significant intrareader or interreader variabil-ity. Values are also reproducible irrespective of the arterial input vessel selected, they seem comparable to those from studies performed before contrast en-hancement for routine diagnostic study. The method appears to have value in distinguishing between be-nign and malignant processes, primarily on the basis of the short MTT of malignant lesions.
References
1. Miles KA, Griffiths MR.Perfusion CT: a worthwhile enhance-ment?Br J Radiol2003;76:220 –231
2. Cenic A, Nabavi DG, Craen RA, Gelb AW, Lee TY.Dynamic CT measurement of cerebral blood flow: a validation study.AJNR Am J Neuroradiol1999;20:63–73
3. Miles KA.Perfusion CT for the assessment of tumour vascularity: which protocol [Suppl]?Br J Radiol2003;76:S36 –S42
4. Wintermark M, Thiran JP, Maeder P, Schnyder P, Meuli R. Simul-taneous measurement of regional cerebral blood flow by perfusion CT and stable Xenon CT: a validation study.AJNR Am J Neuro-radiol2001;22:905–914
5. Cenic A, Nabavi DG, Craen RA, Gelb AW, Lee TY.A CT method to measure hemodynamics in brain tumors: validation and appli-cation of cerebral blood flow maps. AJNR Am J Neuroradiol 2002;21:462– 470
6. Aksoy FG, Lev MH.Dynamic contrast-enhanced brain perfusion imaging: technique and clinical applications.Semin Ultrasound CT MR2000;21:462– 477
7. Eastwood JD, Lev MH, Azhari T, et al.CT perfusion scanning with deconvolution analysis: pilot study in patients with acute middle cerebral artery stroke.Radiology2002;222:227–236
8. Eastwood JD, Alexander MJ, Petrella JR, Provenzale JM.Dynamic CT perfusion imaging with acetazolamide challenge for the preproce-dural evaluation of a patient with symptomatic middle cerebral artery occlusive disease.AJNR Am J Neuroradiol2002;23:285–287 9. Larsson HB, Stubgaard M, Frederiksen JL, Jensen M, Henriksen
10. Tofts P, Kermode A. Measurement of the blood-brain barrier permeability and leakage space using dynamic MR imaging. I.
Fundamental concepts Magn Reson Med1991;17:357–367 11. Rijpkema M, Kaanders J, Joosten F, Joosten FB, van der Kogel AJ,
Heerschap A.Method for quantitative mapping of dynamic MRI contrast agent uptake in human tumors.J Magn Reson Imaging 2001;14:457– 463
12. Eastwood JD, Lev MH, Wintermark M, et al.Correlation of early dynamic CT perfusion imaging with whole-brain MR diffusion and perfusion imaging in acute hemispheric stroke.AJNR Am J Neu-roradiol2003;24:1869 –1875
13. Roberts HC, Roberts TP, Smith WS, Lee TJ, Fischbein NJ, Dillon WP.Multisection dynamic CT perfusion for acute cerebral isch-emia: the “toggling-table” technique. AJNR Am J Neuroradiol 2001;22:1077–1080
14. Gandhi D, Hoeffner E, Carlos R, Case I, Mukherji SK. Com-puted tomography perfusion of squamous cell carcinoma of the upper aerodigestive tract. Initial results.J Comput Assist Tomogr 2003;27:687– 693
15. Hermans R, Meijerink M, Van den Bogaert W, Rijnders A, Wel-tens C, Lambin P.Tumor perfusion rate determined noninvasively by dynamic computed tomography predicts outcome in head-and-neck cancer after radiotherapy. Int J Radiat Oncol Biol Phys 2003;57:1351–1356
16. Hermans R, Lambin P, Van der Goten A, et al.Tumoural perfu-sion as measured by dynamic computed tomography in head and neck carcinoma.Radiother Oncol1999;53:105–111
17. Hermans R, Lambin P, Van der Goten A, Haustermans K, Van der Goten A, Baert AL.Non-invasive tumour perfusion measurement by dynamic CT: preliminary results.Radiother Oncol1997;44:159 –162 18. Martin L, Lartigau L, Weeger P, et al.Changes in the oxygenation
of head and neck tumors during carbogen breathing. Radiother Oncol1993;27:123–130
19. Lartigau E, Le Ridant A, Lambin P, et al.Oxygenation of head and neck tumors.Cancer1993;71:2319 –2325