Modelling the link between aggregate
income and carbon dioxide emissions in
developing countries: The case of the
Dominican Republic
Sánchez-Fung, José R.
University of Nottingham, Ningbo
20 January 2016
Online at
https://mpra.ub.uni-muenchen.de/68958/
THE CASE OF THE DOMINICAN REPUBLIC
Abstract
The paper estimates the link between aggregate income and carbon dioxide emissions for the Dominican Republic. The econometric analysis finds evidence of an environmental Kuznets curve revealing that the level of annual real per capita income at which carbon dioxide emissions start to stabilise is around US$1,600. The estimations support evidence in the literature revealing that the curve has been flattening and shifting to the left.
Keywords: CO2 emissions;Environmental Kuznets curve; Dominican Republic.
JEL classification numbers: Q56.
Contact details: José R. Sánchez-Fung, University of Nottingham, Department of Quantitative and Applied Economics, Business School, 199 Taikang East Road, Ningbo 315100, PRC. T: +86 574 8818 0918; F: +86 574 8818 0125.
E-mail: [email protected].
1. Introduction
Nurturing the conditions to achieve economic growth and development is a primary goal for
governments across the world. But in so doing attention has to be paid to the limits imposed
on the pace of economic growth and development by various factors, including the potential
adverse impact on the natural environment and the actions required to reverse the damages
(e.g. Stern, 2015). Therefore understanding the link between aggregate income and the
environment is a pressing task for academics and policymakers (e.g. Greenstone and Jack,
2015).
The paper contributes by investigating the Dominican Republic, an economy that has
been fairly successful in implementing policies to preserve the natural environment vis-à-vis
other developing countries. As an illustration, Diamond (2005) discusses concrete historical
initiatives by the authorities in the Dominican Republic towards saving the natural
environment starting from the second half of the last century. The policies, including
successful schemes to educate people about agriculture’s potentially damaging impact on the
soil, reveal the preferences of domestic policy makers for encouraging a more balanced
development. The precedent of implementing effective polices could also be the foundation
to subsequently tackle other dimensions in the domain of environmental policy management,
like reducing greenhouse gas emissions.
But there is no contribution assessing the level of pollution, as measured by carbon
dioxide (CO2) emissions, and its relation to aggregate income in the Dominican Republic, i.e.
investigating the existence of an environmental Kuznets curve (EKC). Pursuing that line of
research could generate results that serve as a yardstick for gauging the success or otherwise
of environmental policies. The investigation seeks to answer the following questions: Is there
becomes negatively sloped, also known as the EKC’s turning point? Is that period related to
the implementation of specific policies for safeguarding the natural environment?
The literature contains theoretical and empirical contributions, starting with the
seminal work of Grossman and Krueger (1995). Grossman and Krueger estimate that for a
cross-section of countries the turning point for various pollutants happens when real per
capita income reaches US$8,000. But studies focusing on individual developing countries are
more difficult to come by; Vincent (1997) tackles the matter and does not find evidence of an
EKC for Malaysia. Therefore focusing on a country like the Dominican Republic could help
in learning from specific experiences on the evolution of greenhouse gas emissions as
developing economies grow.
The rest of the paper proceeds as follows. Section 2 motivates the specification to
investigate the EKC and runs the econometric modelling. The exposition relates
environmental policies in the Dominican Republic to the findings from the empirical analysis.
Section 3 concludes.
2. Estimating an environmental Kuznets curve for the Dominican Republic
The environmental Kuznets curve arises from the empirical observation of a negative link
between the level of output and pollution. The seminal work is Grossman and Krueger (1995)
and there is a substantial literature deriving from that work. The EKC can be split into several
possible original effects that vary through time, as discussed by Brock and Taylor (2005).
The impact of economic growth can lead to an increase in pollution if the underlying
either grow by less or more than overall growth pollution could decrease or increase in
relation to economic performance. The empirical observation of a negative link between
economic growth and pollution could imply that more advanced countries implement
environment-friendly production techniques. And that is subsequently reflected in a lower
level of pollution at higher income levels, generating the EKC. Ultimately, the nature of the
link between income and pollution is an empirical question and what follows attempts to
throw light on the matter by examining the case of the Dominican Republic.
The time series for the empirical modelling are obtained from the World Bank World
Development Indicators and range from 1960 to 2010. The data are CO2 emissions in metric
tons per capita (EN.ATM.CO2E.PC), gross domestic product (GDP) per capita
(NY.GDP.PCAP.KN), population density (EN.POP.DNST), and annual % population growth
(SP.POP.GROW) -World Bank codes are inside parentheses.
The econometric analysis begins by estimating the following benchmark equation
𝑙𝑜𝑔𝐶𝑂2𝑡= 𝛼 + 𝛽1𝑙𝑜𝑔𝑌𝑡+ 𝛽2𝑙𝑜𝑔𝑌𝑡2+ 𝛿𝑡𝑟𝑒𝑛𝑑 + 𝜀𝑡. (1)
In equation 1 all the variables are defined as above and log denotes the natural logarithm of a
series; 𝛽1, 𝛽2 are coefficients to be estimated empirically. If a Kuznets curve exists 𝛽1 > 0
and 𝛽2 < 0, meaning that CO2 emissions increase with output but decline after reaching a
threshold level. The equation also contains a time trend.
Running equation 1 using ordinary least squares (OLS) and annual data spanning
𝑙𝑜𝑔𝐶𝑂2𝑡= − 89.16⏟
11.90 + 17.59⏟ 2.34 𝑙𝑜𝑔𝑌𝑡− 0.86⏟0.11
𝑙𝑜𝑔𝑌𝑡2+ 0.01⏟ 0.01
𝑡𝑟𝑒𝑛𝑑. (2)
𝐴𝑑𝑗𝑅2 = 0.95 𝑆𝐸𝑅 = 0.1369
Equation 2 reports heteroscedasticity and autocorrelation consistent standard errors (HACSE)
below each coefficient. The diagnostic statistics under the equation are the goodness of fit
(adjusted𝑅2) and standard error of the regression (𝑆𝐸𝑅). All the coefficients in equation 2 are
significant at the 1% level excepting the time trend which is significant at the 8% level. The
coefficients affecting the level and the squared value of GDP are positive and negative,
implying that there is an environmental Kuznets curve for the Dominican Republic during the
period under investigation. The analysis also runs a RAMSEY test to detect the adequacy of
the functional form. The F-test examines the hypothesis that the coefficients on the squared
values of the fitted model (equation 2) are zero and the hypothesis cannot be rejected
{0.325(0.570)}.
Even if the functional form is correct, there could be reasonable concerns about the
lack of ancillary variables in equation 2 so the analysis proceeds to exploring a more general
model. The investigation considers the following extended EKC specification
𝑙𝑜𝑔𝐶𝑂2𝑡=
𝛼 + 𝛽1𝑙𝑜𝑔𝑌𝑡+ 𝛽2𝑙𝑜𝑔𝑌𝑡2+ 𝛽3(𝑙𝑜𝑔𝑌𝑡− 𝑙𝑜𝑔𝑌𝑡−1) + 𝛽4𝑃𝑜𝑝𝑑𝑒𝑛𝑡+ 𝛽5𝑃𝑜𝑝𝑔𝑟𝑜𝑤𝑡ℎ𝑡+
The additional regressors in equation 3 are GDP growth (𝑙𝑜𝑔𝑌𝑡− 𝑙𝑜𝑔𝑌𝑡−1), population
density (𝑃𝑜𝑝𝑑𝑒𝑛) and population growth (𝑃𝑜𝑝𝑔𝑟𝑜𝑤𝑡ℎ). Estimating equation 3 using OLS
and annual data from 1961 to 2010 generates the following results
𝑙𝑜𝑔𝐶𝑂2𝑡=
− 40.19⏟
17.18
+ 8.49
2.93𝑙𝑜𝑔𝑌𝑡− 0.41⏟0.13 𝑙𝑜𝑔𝑌𝑡
2 + 0.53⏟
0.36 (𝑙𝑜𝑔𝑌𝑡
− 𝑙𝑜𝑔𝑌𝑡−1) + 0.05⏟ 0.02
𝑃𝑜𝑝𝑑𝑒𝑛𝑡−
2.03⏟
0.37 𝑃𝑜𝑝𝑔𝑟𝑜𝑤𝑡ℎ𝑡− 0.21⏟0.08 𝑡𝑟𝑒𝑛𝑑 + 𝜀𝑡
.
(4)
𝐴𝑑𝑗𝑅2 = 0.96 𝑆𝐸𝑅 = 0.1130
Equation 4 also reports HACSE below each coefficient. In equation 4 all the coefficients are
significant at least at the 5% level, excepting the one affecting the rate of growth of GDP
(𝑙𝑜𝑔𝑌𝑡− 𝑙𝑜𝑔𝑌𝑡−1) which is not statistically significant at conventional levels. The key
coefficients on the level of output and on squared output carry positive and negative
coefficients, confirming the existence of an EKC for the Dominican Republic. Also, the
coefficients on the two income measures are smaller than those reported in equation 2,
lending support to focusing attention on a more general econometric model. Figure 1 shows
the residuals from equation 4 and they reveal a stationary pattern.
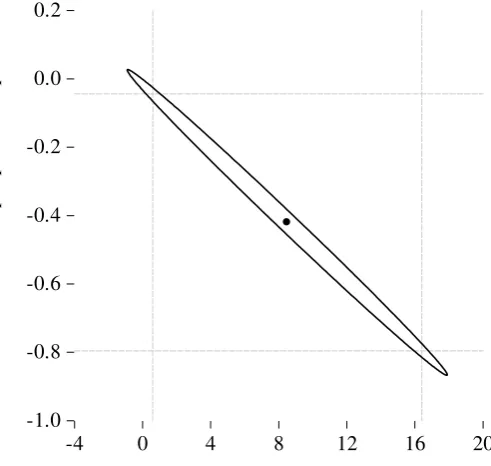
Given the importance of the results in equation 4, the investigation computes an
F-statistic to test the hypothesis that both coefficients on real output per head are zero {𝛽1 =
shown in Figure 2 provides a visual impression of the range of values for 𝛽1 and 𝛽2 derived
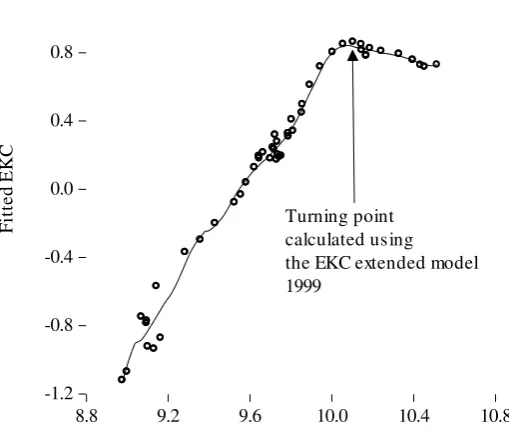
from equation 4. Figure 3 shows a cross-plot of the fitted values from equation 4 and the log
of real income per head: the graph clearly reveals the EKC pattern implying the existence of a
turning point in the income-pollution relationship for the Dominican Republic.
The turning point for the EKC, meaning the level of income at which pollution starts
to decline, can be calculated using the following formula
𝑌𝑡 = −𝛽1
2𝛽2
⁄ . (5)
Using the coefficients from equation (4) yields
𝑌𝑡 = −8.499068 2(−0.419991)⁄ = 10.11 . (6)
The calculation implies that for the Dominican Republic the turning point occurs in 1999.
The estimated turning point is around the time when the Dominican Republic took concrete
steps to boost the government’s capacity to regulate the natural environment. This relates to
discussions in Dasgupta et al (2002) and references therein, citing empirical evidence
showing that the main factor driving reductions in pollution in countries reaching
middle-income status seems to be changes in the pertinent regulatory framework (see also the
In the Dominican Republic the General Law on the Environment and Natural
Resources (Law 60 of 2000) provides the legal basis for the Ministry of the Environment and
Natural Resources (see Lizardo and Guzmán, 2005). The Ministry’s mandate is to foster
policies aimed at preserving and improving the environment and natural resources, with the
ultimate goal of securing its sustainability. It is worth noting that so far the Dominican
Republic’s Ministry of the Environment and Natural Resources has been fairly effective and
commands considerable credibility in the country.
Going back to the results from the empirical modelling, the turning point in the EKC
occurs around an annual real GDP per capita of US$1,600 -calculated at market exchange
rates. Considering PPP-based GDP numbers, converted with current dollars, the turning point
would amount to an annual real per capita income of US$5,300 according to data produced
by the World Bank.The number is lower than the corresponding figure for the conventional
EKC and could help to support evidence suggesting that the EKC has been flattening and
shifting to the left -Dasgupta et al (2002) label this a ‘revised EKC’. The EKC’s changing
pattern could be the result of catch-up growth involving the adoption of environment-friendly
technologies in developing countries. But, more likely, it is the outcome of specific policies
aimed at preserving the environment.
In that regard, going back to the institutional context, subsequent to creating the
Ministry of the Environment the Dominican Republic has taken concrete steps towards
reducing greenhouse gas emissions. Concretely, the National Committee on Climate Change
and Clean Development Mechanism was created in 2008. The Committee’s mandate includes
designing and implementing policies to mitigate and prevent greenhouse gas emissions in the
Dominican Republic. The institution also keeps track of the compliance with commitments
agreed with the United Nations concerning climate change, notably those derived from the
Plan Compatible with Climate Change in order to keep greenhouse emissions under control,
and recently passed new legislation to tax motor vehicles according to their CO2 emissions, a
policy that has being difficult to implement in other Latin American countries1. Another
example of related efforts is the Dominican Republic’s success in reducing ozone depleting
emissions of hydrochlorofluorocarbons by 10% during the three years preceding 2015 –
according to the United Nations Development Program’s office in the country. World-wide
efforts in that direction are partly supported by funding from advanced countries pledged via
the Montreal Protocol -a treaty focusing on reducing substances that deplete the ozone layer.
3. Conclusion
The paper investigates the link between aggregate income and CO2 emissions for the
Dominican Republic. The econometric analysis shows evidence of an environmental Kuznets
curve revealing that the level of annual real per capita income at which CO2 emissions start
to stabilise is around US$5,300 measured in PPP terms. The level computed for the
Dominican Republic is lower than for conventional EKC estimates reported in the literature
but in line with the revised Kuznets curve discussed in Dasgupta et al (2002). The findings
may contribute to substantiate the hypothesis that the curve has been flattening and shifting to
the left, possibly due to catch-up growth involving the adoption of environment-friendly
technologies and specific policies to preserve the natural environment.
1Oliva (2015) studies Mexico’s experience in trying to regulate automobile emissions in
References
Brock, William, and M. Scott Taylor (2005) Economic growth and the environment: a review of theory and empirics, Chapter 28 in the Handbook of Economic Growth, edited by Philippe Aghion and Steven N. Durlauf. Amsterdam: North Holland.
Carson, Richard T. (2010) The environmental Kuznets curve: Seeking empirical regularity and theoretical structure, Review of Environmental Economics and Policy, 4, 3-23.
Dasgupta, Susmita, Benoit Laplante, Hua Wang, and David Wheeler (2002) Confronting the environmental Kuznets curve, Journal of Economic Perspectives, 16, 147-168.
Diamond, Jared (2005) Collapse: How societies choose to fail or survive, Penguin Books: London.
Dominican Republic: National Committee on Climate Change and Clean Development Mechanism: http://cambioclimatico.gob.do/.
Greenstone, Michael, and B. Kelsey Jack (2015) Envirodevonomics: A research agenda for an emerging field, Journal of Economic Literature, 53, 5-42.
Grossman, Gene M., and Alan B. Krueger (1995) Economic growth and the environment,
Quarterly Journal of Economics, 110, 353–77.
Lizardo, Magdalena, and Rolando M. Guzmán (2005) Coordinación de las políticas fiscales y ambientales en la República Dominicana, United Nations Economic Comission for Latin America and the Caribbean (ECLAC), Serie Medio Ambiente y Desarrollo no. 100, Santiago, Chile.
Oliva, Paulina (2015) Environmental regulations and corruption: Automobile emissions in Mexico City, Journal of Political Economy, 123, 686-724.
Stern, Nicholas (2015) Why Are We Waiting? The logic, urgency, and promise of tackling climate change, MIT Press, Cambridge, MA, USA.
Vincent, Jeffrey R. (1997) Testing for environmental Kuznets curves within a developing country, Environment and Development Economics, 2, 417-431.
Figure 1
Residuals from the extended EKC model, equation (4)
-.3 -.2 -.1 .0 .1 .2 .3
60 65 70 75 80 85 90 95 00 05 10
Figure 2
1% confidence ellipse for 𝛽1 and 𝛽2 coefficients, equation 4
-1.0 -0.8 -0.6 -0.4 -0.2 0.0 0.2
-4 0 4 8 12 16 20
Coefficient on real output per head
[image:12.595.180.426.469.702.2]Figure 3
Environmental Kuznets curve for the Dominican Republic
Cross-plot of the fitted values from equation 4 and the log of real income per head 1961-2010
-1.2 -0.8 -0.4 0.0 0.4 0.8 1.2
8.8 9.2 9.6 10.0 10.4 10.8
Log of real income per head
F
it
te
d
E
K
C