Ultrasonic Method for Testing Spot-Welds
Hajime Takada
1;*, Takafumi Ozeki
1, Rinsei Ikeda
2and Tomoyuki Hirose
3 1Instrument and Control Engineering Research Department, Steel Research Laboratory,JFE Steel Corporation, Kawasaki 210-0855, Japan
2
Joining and Strength Research Department, Steel Research Laboratory, JFE Steel Corporation, Chiba 260-0835, Japan
3Automotive Steel Section, Product Design & Quality Control Department, West Japan Works,
JFE Steel Corporation, Fukuyama 721-8510, Japan
We developed a technique for nondestructively evaluating spot-welds based on through-transmission of Lamb waves. The nugget diameter can be evaluated by measuring the width of the zone where attenuated transmitted waves are observed. A particularly important feature of the developed technique is that spot-welds with no weld metal can be reliably distinguished from spot-welds with weld metal. We also developed a measuring system using array transducers. The measurement results using the system agree well with the nugget diameters measured by cross-sectional observation. [doi:10.2320/matertrans.M2010336]
(Received September 24, 2010; Accepted December 13, 2010; Published February 2, 2011) Keywords: spot welds, nondestructive testing, ultrasound, probe array, nugget diameter
1. Introduction
In the manufacturing plants for automobile bodies and electrical appliances, the product parts are assembled by spot-welding at multiple points. When viewed exteriorly, welds usually appear as small dimples. Typical spot-welding is performed by pressing 2 to 4 steel sheets between two electrode tips several mm in diameter.
Spot-welds must be carefully inspected, as the quality of the welds directly influences the strength and durability of the welded body. One conventional method for inspecting spot-welds is to check a cross-section of the welded metal. Another is to drive a cold chisel between spot-welded sheets to determine if the sheets can be pried apart. These methods are problematic, however, as both are destructive (breaking the spot-welds) and can only be performed using spot-welds sampled from the products. For this reason, industries have long awaited the development of a reliable nondestructive method for spot-weld inspection.
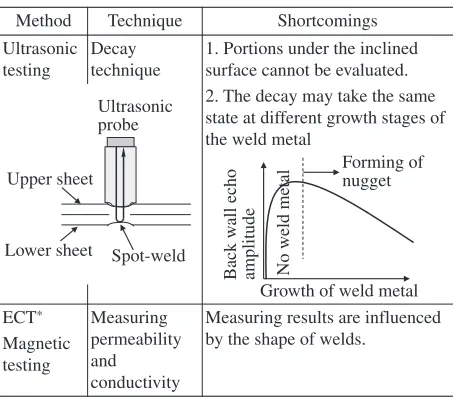
Engineers aspiring towards the nondestructive testing of spot-welds have attempted to develop an ultrasonic testing method based on the decay technique1–6) and an electro-magnetic method (see Table 1). The conventional ultrasonic testing method, however, has two fatal shortcomings de-scribed as follows:
(1) Portions under the inclined surface in the spot-welds cannot be evaluated by the method based on the straight beam technique, because transmitted ultrasonic waves are severely scattered in such portions.
(2) The decay may take the same state at different growth stages of the weld metal (nugget). In detail, the decay observed with the spot-welds with little or no weld metal may equal that observed with the spot-welds with large weld metal. That is to say, the two different growth of the weld
metal mentioned above cannot be distinguished by the method.
The conventional electromagnetic method is also imper-fect, because measuring results by the method are strongly influenced by the shape of welds. In particular, there is no reliable means for distinguishing spot-welds with no weld metal from spot-welds with weld metal. Neither the ultra-sonic nor the electromagnetic methods are reliable for nondestructive testing of spot-welds. In last 10 years ultra-sonic imaging technologies based on the straight beam technique have been applied to the nondestructive testing of spot-welds.7–10)But they still have the problems mentioned above.
[image:1.595.314.543.348.547.2]Therefore, we recently developed a method that can distinguish between spot-welds with and without weld metal in the nondestructive testing of spot-welds. This paper outlines this new method.
Table 1 Conventional techniques for spot-weld testing.
Method Technique Shortcomings Ultrasonic
testing
Decay technique
1. Portions under the inclined surface cannot be evaluated. 2. The decay may take the same state at different growth stages of the weld metal
ECT*
Magnetic testing
Measuring permeability and conductivity
Measuring results are influenced by the shape of welds.
Growth of weld metal
Back w
all echo
amplitude
Upper sheet
Lower sheet
Ultrasonic probe
Forming of nugget
No weld metal
Spot-weld
*Eddy current testing
*Present address: Non-destructive Inspection Technology Department, Instrument System Division, JFE TECHNO-RESEARCH CORPORA-TION, Chiba 260-0835, Japan
2. Principle behind the Method for Nondestructive Testing of Spot-Welds
2.1 Ultrasound attenuation measurement
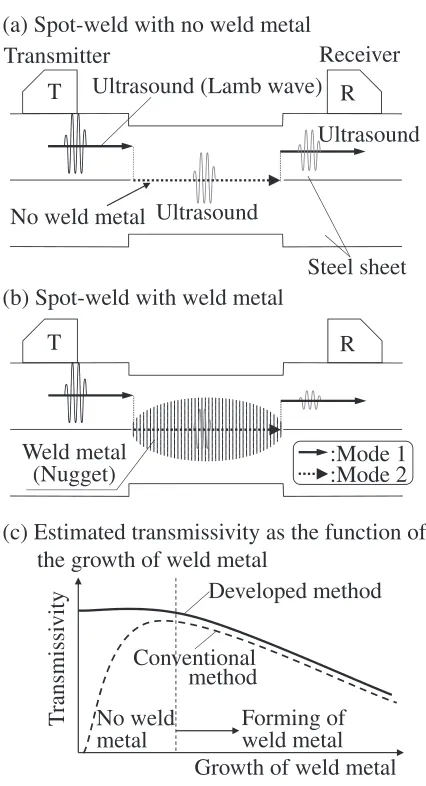
Figure 1 outlines our recently developed nondestructive spot-weld testing method. Ultrasounds (ultrasonic Lamb waves) are transmitted to a steel sheet at a ‘‘sending point’’ outside the weld metal of a spot-weld (nugget) and propagate toward the weld metal as a certain propagation mode (mode 1). When the ultrasounds reach the edge of the weld metal, the propagation mode of the ultrasounds is converted into other mode (mode 2) by reason of change in thickness and the ultrasounds propagate toward the opposite edge of the weld metal as the propagation mode 2. At the opposite edge of the weld metal, the propagation mode of the ultrasounds is converted into the former mode (mode 1) and the ultrasounds propagate toward a ‘‘receiving point’’ opposite to the sending point. Finally through-transmitted waves are detected at the receiving point. The ultrasounds with different fdvalues are treated as different modes in the description above. Here, f is frequency of the ultrasounds; andd is the thickness of the propagation medium.
The weld metal usually has a thickness-direction-oriented structure, because the heat generated by spot-welding moves toward the electrode tips and then a temperature gradient occurs in the thickness direction. Figure 2 shows a typical optical micrograph of weld metal.
As the weld metal has a coarse structure compared with the crystal structure of the steel sheet to be welded, low transmissivity for ultrasonic waves (large attenuation) is observed as shown in Fig. 1(b). In contrast, if there is no weld metal in the spot-weld, high transmissivity for ultrasonic waves (little attenuation) is observed as shown in Fig. 1(a), because there is no coarse structure in the propagation path. On occasions when two steel sheets are not jointed, through-transmitted waves with large amplitudes similar to the through-transmitted wave shown in Fig. 1(a) are observed. Figure 1(c) shows the relationship between the estimated transmissivity for ultrasonic waves and the growth of the meld metal. The estimated transmissivity with the developed method is a monotonic decreasing function of the weld metal growth. Accordingly, discrimination between spot-welds with and without weld metal is easy to be carried out by
observing the amplitude of the through-transmitted wave. Whereas the estimated transmissivity with the conventional method based on the straight beam technique may take the same value at different growth stages of the weld metal.
No weld metal
Ultrasound (Lamb wave)
Ultrasound
Ultrasound
Transmitter
Receiver
Steel sheet
(a) Spot-weld with no weld metal
(b) Spot-weld with weld metal
Weld metal
(Nugget)
:Mode 1
:Mode 2
Growth of weld metal
T
ransmissi
vity
Forming of
weld metal
No weld
metal
Developed method
Conventional
method
(c) Estimated transmissivity as the function of
the growth of weld metal
T
R
T
R
Fig. 1 Spot-weld evaluation method using the difference between (a) ultrasound (Lamb wave) propagation in the spot-weld with no weld metal and (b) that in the spot-weld with weld metal; and (c) estimated transmissivity as the function of the growth of weld metal.
1mm
[image:2.595.319.532.67.460.2] [image:2.595.90.505.605.768.2]Therefore, discrimination between spot-welds with and without weld metal is not easy to be carried out by using the conventional method.
The ultrasounds propagating along the surface of the steel sheet are attenuated proportionately with the path length of the weld metal, that is, the nugget diameter. The nugget diameter can be measured by measuring ultrasound attenuation. The accuracy of the ultrasound attenuation measurement, however, depends on the coupling between the ultrasonic probe and the test object. A testing technique, in which the nugget diameter is evaluated by detecting the planar zone where the nugget-induced attenuation of the ultrasound is observed, is preferable.
The attenuation of ultrasonic waves can be altered by the scattering of ultrasound resulting from the step-like shape formed in a spot-weld. Yet ultrasonic waves propagate in many modes along a steel sheet. For this reason, it is possible to use a propagation mode that minimizes the influence of the step-like shape.
2.2 Ultrasound through-transmission time measure-ment
The thickness-direction-oriented structure also has aniso-tropy similar to transversely isotropic materials. Since ultrasound velocity varies depending on the propagation direction in the anisotropic medium, the region where the weld metal exists is distinguishable by measuring the through-transmission time.
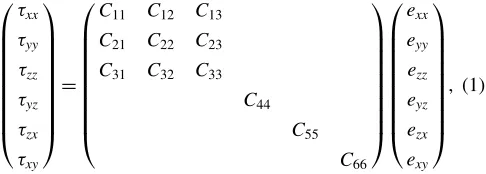
The general linearly elastic constitutive equation for anisotropic medium is given by the following equation:11,12)
xx yy zz yz zx xy 0 B B B B B B B B @ 1 C C C C C C C C A ¼
C11 C12 C13
C21 C22 C23
C31 C32 C33
C44 C55 C66 0 B B B B B B B B @ 1 C C C C C C C C A exx eyy ezz eyz ezx exy 0 B B B B B B B B @ 1 C C C C C C C C A
; ð1Þ
whereijis the stress tensor;eijis the strain tensor;Cijis the
elastic constant stiffness matrix. Considering the symmetry in the transversely isotropic medium, eq. (1) is simplified as
xx yy zz yz zx xy 0 B B B B B B B B @ 1 C C C C C C C C A ¼
C11 C12 C13
C12 C11 C13
C13 C13 C33
C44 C44 C66 0 B B B B B B B B @ 1 C C C C C C C C A exx eyy ezz eyz ezx exy 0 B B B B B B B B @ 1 C C C C C C C C A
; ð2Þ
here, C66 ¼ ðC11C12Þ=2; z-direction is the thickness
direction of the weld metal. The equation of motion is given as follows:
@
2u
@t2 ¼
@xx @x þ
@xy @y þ
@xz @z ;
@
2v
@t2 ¼
@yx
@x þ @yy
@y þ @yz
@z ; ð3Þ
@
2w
@t2 ¼
@zx @x þ
@zy @y þ
@zz @z ;
whereðu;v;wÞis the displacement;is density.
The propagation of ultrasound satisfies the abovemen-tioned two equations. Then, let us assume the following plane wave as a general solution:
u¼Axexpð2iðkDLVtÞ=Þ;
v¼Ayexpð2iðkDLVtÞ=Þ;
w¼Azexpð2iðkDLVtÞ=Þ; ð4Þ
wherekis the wave vector and k¼ ðl;m;nÞ;DL¼ ðx;y;zÞ; V is ultrasound velocity and is wavelength.
Accordingly, from eqs. (1) to (3), the following equation is derived:
A1V2
A2V2
A3V2
Ax Ay Az
¼0; ð5Þ
where
A1 ¼C11l2þ fðC11C12Þ=2g m2þC44n2;
A2 ¼ fðC11C12Þ=2g l2þC11m2þC44n2;
A3 ¼C44l2þC44m2þC33n2;
¼ ðC13þC44Þ mn;
¼ ðC13þC44Þ nl;
¼ fC12þ ðC11C12Þ=2g lm:
As the determinant on the left side must be zero to obtain a nontrivial solution, the relationship between the ultrasound velocityV and the elastic constant stiffness coefficients can be determined. Next, the values of the elastic constant stiffness coefficients can be obtained by measuring the velocity of ultrasound that propagates along the specified direction. As a result, the velocity of ultrasound propagating along an arbitrary direction can be calculated based on the values of the elastic constant stiffness coefficients.
Using low-carbon cast steel as a representative sample of transversely isotropic steel, the elastic constant stiffness coefficients measured with a solidified structure oriented in one direction are shown in Table 2. Figure 3 shows the velocity curves calculated using the values in Table 2. Both the velocity of shear (transverse) wavesVSV,VSHand that of longitudinal wave VL vary depending upon the propagation direction.
[image:3.595.48.291.435.522.2]The samples shown above are not results for the weld metal of low-carbon steel. However, it is considered that the shape of the velocity curve is similar in the weld metal. Therefore, the through-transmitted waves that pass through the weld metal are distinguishable by measuring the through-transmission time. The region where weld metal exists is distinguishable by measuring the through-transmission time as well.
Table 2 Elastic constant stiffness coefficients. Elastic constant stiffness
coefficients/ Measured value
(C11/)/(m2/s2) 3:37107
(C33/)/(m2/s2) 3:21107
(C44/)/(m2/s2) 1:53107
(C12/)/(m2/s2) 1:75107
3. Spot-Weld Evaluation Method Using Piezoelectric Element Array and Developed Measuring System
As mentioned in 2.1, the accuracy of the ultrasound attenuation measurement depends on the coupling between the ultrasonic probe and the test object. With this in mind, we decided to study a testing technique in which the nugget diameter is evaluated by detecting the planar zone where the nugget-induced attenuation of the ultrasound is observed. However, mechanical scanning of the coupled ultrasonic probe is unsuitable for the nondestructive spot-weld evalua-tion in a manufacturing plant. As an alternative, we developed a method for linearly scanning the ultrasonic beams using piezoelectric element arrays.
3.1 Developed measuring system using piezoelectric element array
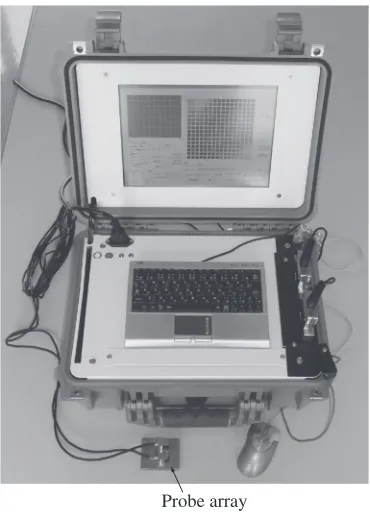
The appearance of the developed measuring system is shown in Fig. 4. Switching circuits interposed between an ultrasonic pulser/receiver and the probe arrays (piezoelectric element arrays) switch the connections between the piezo-electric elements in the probe array and the ultrasonic pulser/ receiver. All received signals are subjected to A/D con-version and are handled by personal computer (PC). The
[image:4.595.334.519.71.327.2]amplitude of the through-transmitted ultrasonic waves is detected and displayed using a signal-processing application on a PC. As all the components are assembled in a plastic case, the system can easily be handled and brought to wherever it is needed.
Figure 5 shows the schematic depiction of measurement by using the developed piezoelectric element arrays (probe arrays) and an appearance of the coupled piezoelectric element arrays. Both the transmitting and receiving probe arrays are equipped with a piezoelectric element array. Each array comprises 16 piezoelectric elements with a nominal frequency of 10 MHz, width of 0.5 mm in the array direction, and element spacing of 0.1 mm in the array direction.
The Lamb wave used in this method is the combination of shear wave (SV wave) with a refraction angle of about 32
and longitudinal wave with a refraction angle of about 78.
The waves might be called as partial waves.13)Referring to Fig. 3, it is expected that the through-transmitted wave that passes through the weld metal is received later than the through-transmitted wave that does not pass through the weld metal.
The system works via the detection of the through-transmitted wave moving between every element in both the transmitting probe array and the receiving probe array. The through-transmitted wave sent from the piezoelectric element i(i¼1;2;. . .;16) in the transmitting probe array one by one is received by all of the piezoelectric element (16 elements) in the receiving probe array one by one. The amplitude of the through-transmitted waves moving along the 256 (1616) paths in total is detected. In other words, the amplitude of the through-transmitted waves that take the oblique path is also detected.
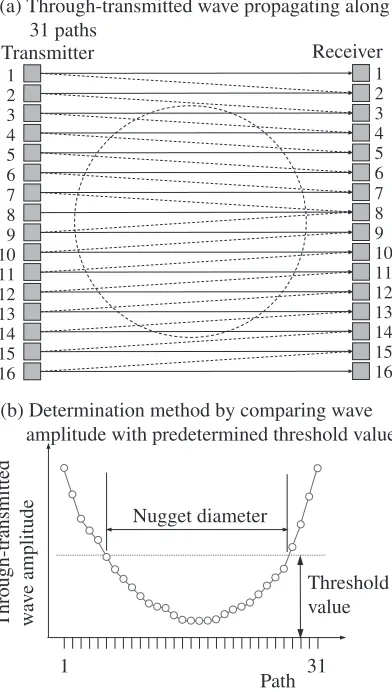
The nugget diameter of a spot-weld is measured using the amplitude of the received through-transmitted waves along 31 paths as shown in Fig. 6(a). The through-transmitted
Z (Thickness direction)
T (Transverse direction)
Z (Thickness direction)
T (Transverse direction) (a) Longitudinal Wave
(b) Shear Wave
VL/(m/s)
5600
6200 6000 5800
6400
VSV/(m/s)
VSH/(m/s)
3200
3600
4000 2800
Velocity curve for isotropic steel
Velocity curve for isotropic steel
Fig. 3 Velocity curve of (a) longitudinal wave and (b) shear wave in thickness-direction-oriented structure.
Probe array
[image:4.595.62.276.72.445.2]waves propagating along the paths are recognized based on the arrival time delay and then their amplitude and transit time are detected. As shown in Fig. 6(b), the amplitude profile of the received through-transmitted waves along the array direction is determined by interpolation using the amplitude of the received through-transmitted waves de-scribed above. Then, the width of the portion where the amplitude was lower than the predetermined threshold value is measured as the nugget diameter. In the transit time measurement, the transit time of the through-transmitted wave that propagates outside the weld metal is used as the reference time. The path where the transit time of a through-transmitted wave is longer than the predetermined time delay with respect to the reference time is judged as having the weld metal.
Moreover, the amplitude of the through-transmitted waves measured for all the paths is shown in a representation using a matrix. The brightness of each element indicated in the matrix is modulated according to the amplitude of the through-transmitted wave, where an indicated bright element shows that the received through-transmitted wave has a large amplitude. The matrix display can be used to determine the positional relationship between the probe arrays and the spot-weld, as illustrated in Fig. 7. For simplification, the figure is drawn with a total of 8 piezoelectric elements (64 paths in total). The positions of the probe arrays are easily adjusted to the spot-weld using the matrix display. Though the number of indicated dark elements along the right-side-down diagonal in the matrix display shown in Fig. 7 corresponds to the nugget diameter, it is not suitable for the precise
measure-ment of the nugget diameter. The matrix display can be used as an auxiliary function which shows the size of the nugget roughly.
The measurement time per spot-weld is less than 3 s.
3.2 Test samples
The spot-welded samples shown in Table 3 were used as the test objects. The samples were prepared by stacking and spot-welding two steel sheets 0.7 to 2.0 mm in thickness. The nugget diameters were varied by adjusting the weld current. The samples 0.0 to 6.0 mm in nugget diameter could be made by the method described above.
Two samples were made under identical conditions for each welding current. One (test sample) was used for the ultrasonic measurement and the other (reference sample) was sectioned for the measurement of the nugget diameter (reference diameter). The measured nugget diameters are shown in the rightmost column of Table 3. Samples of 17 sets and 68 pieces were prepared in total.
3.3 Measuring results and discussion
The samples were measured on both surfaces along two directions that intersect perpendicularly with each other. Accordingly, four measurements were made per sample. The same probe arrays as mentioned in 3.1are used for all the
Coupled
Transmitting probe array
Ultrasound (Lamb wave) Steel sheet
1 16
Receiving probe array
Attenuated zone
(a) Measurement setup by using the developed probe arrays
(b) Appearance of the developed probe array
Fig. 5 Schematic depiction of (a) measurement setup by using the developed probe arrays; and (b) appearance of the developed probe arrays.
1
Path
Through-transmitted wav
e amplitude
Nugget diameter
31 Threshold value
1
3
5
7
10
12
14
16
Transmitter Receiver
2
4
6
8 9
11
13
15
1
3
5
7
10
12
14
16 2
4
6
8 9
11
13
15
(a) Through-transmitted wave propagating along 31 paths
(b) Determination method by comparing wave amplitude with predetermined threshold value.
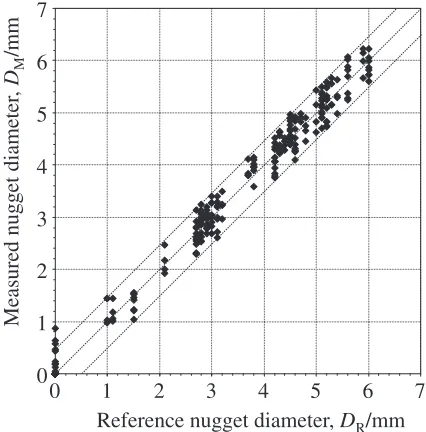
[image:5.595.63.266.72.369.2] [image:5.595.328.524.76.422.2]measurements. Figure 8 shows the relationship between the nugget diameters DM measured using the abovementioned method based on attenuation measurement and the reference diameters DR determined by cross-sectional observation using the samples shown in Table 3. As shown in Fig. 8, the measured nugget diameters DM agreed with the reference nugget diameters DR to a precision of 0.5 mm except for several samples. Overestimation tended to happen with the samples that had no weld metal. The likely reasons for the overestimation are as follows:
(1) Coarse grains produced by high temperature during welding attenuate the ultrasound.
(2) It is possible that the actual nugget diameters of the samples used in the nondestructive measurement mentioned above were different from the reference diameters to some degree. Exact estimation of the precision is a future task.
Incidentally, as mentioned above, spot-welds with little or no weld metal are harmful due to their poor strength and they definitely must be rejected, so it is important not to overestimate the nugget diameter. We therefore refined the
nugget diameter measurement method based on the attenu-ation measurement.
Figure 9 shows examples of B-scope representation using the signal received in the abovementioned 31 paths. The horizontal axis is the time and the vertical axis is the ultrasound path shown in Fig. 6(a). As shown in Fig. 9, in the sample with a reference diameter of zero, the time difference between the through-transmitted wave along the center path and the through-transmitted wave along the side path is very short, because there is no weld metal to change the ultrasound velocity. On the contrary, in the sample with a large reference diameter, the time difference between the through-transmitted wave along the center path and the through-transmitted wave along the side path is long. Namely, the nugget diameter measured by attenuation measurement can be compensated by using the transit time measurement result. The path where the transit time of the Receiving
1 2 3 4 5 6 7 8 1
2 3 4 5 6 7 8
T
ransmitting
1 2 3 4 5 6 7 8 1
2 3 4 5 6 7 8 Transmitting array
Spot-weld
1 2 3 4 5 6 7 8 1
2 3 4 5 6 7 8
1 2 3 4 5 6 7 8 1
2 3 4 5 6 7 8 Receiving array
Ultrasound
Fig. 7 Detection of misalignment using matrix display.
Reference nugget diameter,
D
R/mm
Measured nugget diameter
,
D
M/mm
0
1
2
3
4
5
6
7
0
1
2
3
4
5
6
7
Fig. 8 Relationship between measured nugget diameter and reference nugget diameter.
(a) No weld metal
(b) Large weld metal
Time Path
Time Path
Amplitude +127
-128 0
Through-transmitted wave
[image:6.595.59.284.71.490.2] [image:6.595.320.533.74.290.2] [image:6.595.313.539.341.529.2]through-transmitted wave is shorter than the predetermined time delay with respect to the reference time is judged as having no weld metal, and then the nugget diameter is determined as zero.
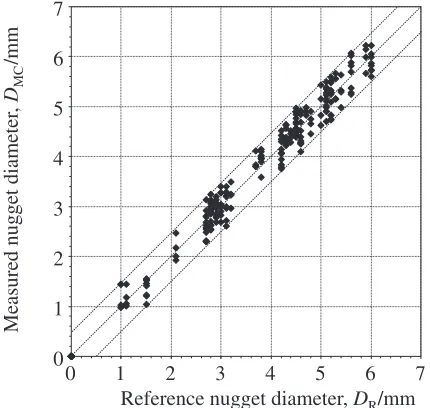
Figure 10 shows the relationship between the nugget diametersDMCmeasured using the abovementioned method with the compensation based on the transit time measurement and the reference diametersDR. The spot-welds with no weld metal are accurately distinguishable using the developed method.
It is expected that the nugget diameter can be measured only by using the transit time measurement. The orientation of the thickness-direction-oriented structure, however, is changeable in some degree depending upon the spot-welding condition, so there is a possibility that the time delay arisen from the anisotropy of the weld metal changes depending upon the spot-welding condition. Accordingly, the nugget diameter measurement by comparing the time delay with the predetermined threshold value will not have sufficient accuracy.
Referring again to Fig. 9, it was observed, as expected, that the transit time of the through-transmitted wave along the path including weld metal is longer than that of the through-transmitted wave along the path including no weld metal. Thus, it is qualitatively confirmed that the velocity of the ultrasound passing through the weld metal changes depend-ing upon the anisotropy of the weld metal.
For practical application, matching the coupled probe arrays with curved surfaces is thought as a task to be cleared. This is the important future task.
4. Conclusions
We developed a method for nondestructively evaluating spot-welds based on the measurement of ultrasound (Lamb waves) through-transmission, and drew the following con-clusions:
(1) The nugget diameter can be evaluated by measuring the width of the zone where highly attenuated through-transmitted waves are observed.
(2) The spot-welds with no weld metal are accurately distinguishable by comparing the transit time of the through-Table 3 Samples for nugget diameter measuring test.
Top side sheet Bottom side sheet Reference Nugget Diameter,DR/mm
No. Tensile Thickness, Tensile Thickness,
Strength,
tT/mm
Strength
tB/mm
Type A Type B Type C Type D
TST/MPa TSB/MPa
1 270 0.7 270 0.7 0.0 1.1 3.8 4.5
2 270 1.2 270 0.7 0.0 0.0 2.7 5.4
3 590 1.2 590 1.2 0.0 3.1 4.5 5.2
4 590 1.6 590 1.6 1.0 3.0 4.6 5.9
5 590 2.0 590 2.0 0.0 3.2 4.6 6.0
6 980 1.0 980 1.0 0.0 2.9 4.3 4.8
7 980 1.2 980 1.2 1.5 2.8 4.2 5.2
8 980 1.6 980 1.6 0.0 2.8 4.3 5.1
9 270 1.2 270 1.2 0.0 2.8 3.8 5.1
10 440 1.2 440 1.2 0.0 3.0 4.7 6.0
11 590 1.2 590 1.2 0.0 3.1 4.5 5.6
12 780 1.2 780 1.2 0.0 2.9 4.2 4.6
13 270 1.2 980 1.2 0.0 2.1 3.7 5.3
14 440 1.2 980 1.2 0.0 2.7 4.3 5.0
15 590 1.2 980 1.2 0.0 2.9 4.4 5.2
16 270 1.2 270 1.2 1.5 2.8 4.5 5.6
17 590 1.2 270 1.2 0.0 2.7 4.2 5.1
TST: Tensile Strength of top side sheet,TSB: Tensile Strength of bottom side sheet,tT: thickenss of top side sheet,tB: thickenss of bottom side sheet.
Reference nugget diameter, DR/mm
Measured nugget diameter
,
DMC
/mm
0 1 2 3 4 5 6 7
[image:7.595.50.548.83.373.2]0 1 2 3 4 5 6 7
[image:7.595.62.277.410.614.2]transmitted wave with the reference transit time of the through-transmitted wave that propagates outside the spot-weld.
(3) We developed a measuring system using a piezo-electric element array. The results of measurement by this system agreed well with the nugget diameters measured by cross-sectional observation.
REFERENCES
1) The Japanese Society for Non-Destructive Inspection: Ultrasonic Testing III, (The Japanese Society for Non-Destructive Inspection, Tokyo, 2001) pp. 235–236 (in Japanese).
2) T. Matsushima: Proc. JSNDI Fall Conf. (Fukuoka, 2001) pp. 57–58 (in Japanese).
3) T. M. Mansour: Mater. Eval.46(1988) 650–658.
4) S. Rabinovich, K. Jassby, O. Livni and R. Aharoni: Proc. 15th World
Conference on NDT (Rome, 2000) idn372.
5) G. Mozurkewich: Proc. 16th World Conference on NDT (Montreal, 2004) p. 303.
6) P. Buschke and W. Schappacher: Proc. 9th European Conference on NDT (Berlin, 2006) ECNDT 2006-Fr.1.6.2.
7) F. Reverdy and D. Hopkins: Review Progress Quantitative NDE, vol. 23A, (Am. Inst. Physics, New York, 2004) pp. 801–808. 8) T. Ikeda, H. Karasawa, S. Matsumoto, S. Satonaka and C. Iwamoto:
IIW Doc.No.III-1343-05.
9) T. Ikeda, H. Karasawa, S. Matsumoto, H. Isobe and T. Nakamura: IIW Doc.No.III-1494-08.
10) A. A. Denisov, C. M. Shakarji, B. B. Lawford, R. Gr. Maev and J. M. Paille: J. Res. Natl. Inst. Stand. Technol.109(2004) 233–244. 11) J. L. Rose:Ultrasonic Waves in Solid Media, (Cambridge Univ. Press,
Cambridge, 1999) pp. 24–33.
12) J. L. Rose:Ultrasonic Waves in Solid Media, (Cambridge Univ. Press, Cambridge, 1999) pp. 358–367.